Business Intelligence
How to evaluate a generative BI tool before committing to a 12-month contract
Test generative BI tools: validate use cases, data readiness, accuracy, governance, costs, and run a 30–90 day pilot.
Generative BI tools combine large language models (LLMs) with business intelligence, allowing users to interact with data conversationally and intuitively. But committing to a 12-month contract without proper evaluation can lead to costly mistakes. Here's how to assess these tools effectively:
Define your needs: Identify specific use cases and success metrics, like reducing time-to-insight or improving user adoption.
Check data readiness: Ensure your data stack is clean, centralized, and governed. Poor data quality can derail even the best tools.
Test functionality: Evaluate natural-language accuracy, semantic layer reliability, and governance features like row-level security.
Assess integration and performance: Confirm compatibility with your data warehouse, test query performance, and simulate real-world usage.
Analyze costs and contracts: Account for hidden expenses like setup, training, and AI-specific costs. Negotiate terms for pricing protection, data portability, and exit assistance.
Run a proof of concept: Test the tool with real data and queries during a 30–90 day pilot to validate its performance and total cost of ownership.
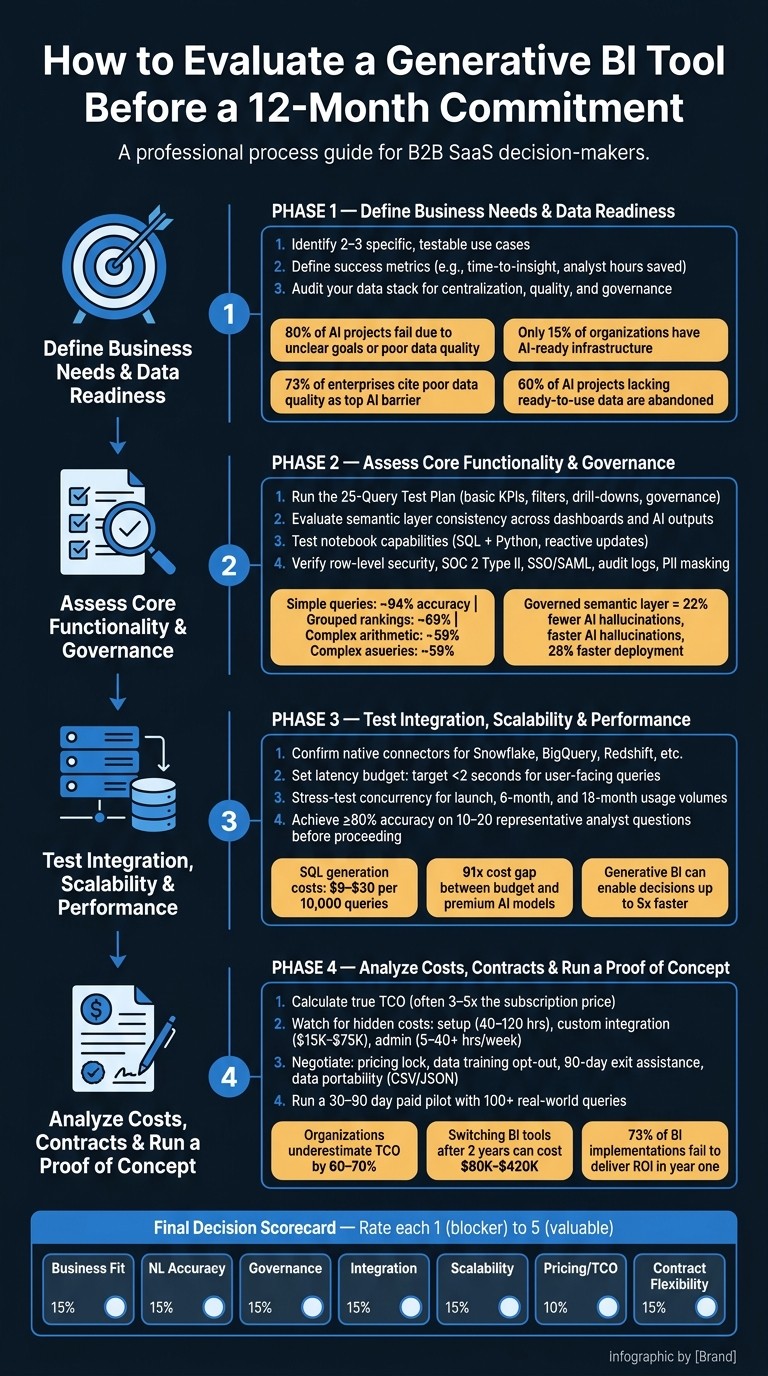
How to Evaluate a Generative BI Tool Before Signing a 12-Month Contract
Step 1: Define Business Needs and Data Readiness
Identify Use Cases and Success Metrics
Before diving into vendor demos, take a step back and define why you need a generative BI tool. It’s worth noting that 80% of AI projects fail due to unclear problem definitions or poor data quality [3].
Start by pinpointing the department with the most pressing challenge. Maybe your finance team is bogged down by hours spent creating rolling forecasts, your marketing team struggles with multi-touch attribution, or your leadership team waits days for summaries of key business trends. Zero in on two or three specific, testable scenarios. This focused approach gives you measurable criteria to evaluate potential solutions.
Once you’ve outlined your use cases, translate them into clear success metrics. Examples might include cutting the time-to-insight, reducing analyst hours, or boosting user adoption. Defining these metrics upfront not only helps you compare tools objectively but also sets clear "kill criteria" - the point where you decide to walk away if a tool doesn’t deliver.
With your use cases and metrics in place, the next step is to ensure your data infrastructure can support these goals.
Assess Your Data Stack and Governance Readiness
Defining success metrics is just the beginning. The real question is: Can your data stack deliver the accuracy you need? Only 15% of organizations have the infrastructure fully prepared for AI [3]. Even more concerning, 73% of enterprises cite poor data quality as the biggest hurdle to adopting AI [3]. A generative BI tool won’t magically fix bad data - it will only make those flaws more obvious.
"If your data is messy, your processes are undefined, and your team hasn't been prepared, even an excellent AI tool will fail." – AI Primer [3]
Before evaluating tools, conduct a thorough audit of your data stack. Is your data centralized in a warehouse? Do you have systems in place for quality monitoring? Are governance practices - like access controls, data classification, and lineage tracking - clearly documented and enforced? Without these elements, tools designed for AI may fall short. In fact, 60% of AI projects lacking ready-to-use data are abandoned [3].
For instance, tools like Querio rely on a well-structured semantic layer to standardize metrics and enforce governance. The better organized and cleaner your input data, the more accurate and reliable your outputs will be. Investing in data readiness upfront ensures that your generative BI tool can truly deliver on its promise.
Back to Basics: Generative BI Pattern for Self-Service Analytics
Step 2: Assess Core Functionality and Governance Features
Once you've outlined your use cases and audited your data stack, it's time to dive into the evaluation process. This is where many teams stumble - getting mesmerized by flashy demos instead of testing tools in practical scenarios. A solid evaluation ensures you're not just impressed but confident in the tool's ability to meet your real-world needs.
Test Natural-Language Querying and Answer Accuracy
The main draw of a generative BI tool is its ability to let users ask questions in plain English and get accurate answers. But the accuracy often depends on the complexity of the query. For instance, while simple aggregation queries succeed about 94% of the time, more challenging operations like grouped rankings drop to 69%, and complex arithmetic queries succeed only 59% of the time [5].
One practical way to test this is by using the "25-Query Test Plan." This involves running queries across four areas: basic KPIs, time and filter nuances, follow-up drill-downs, and governance-related questions. Pay extra attention to how the tool handles multi-turn context. For example, start with, "Show me revenue for the Northeast region", and then follow up with, "Now exclude trial accounts." If the tool loses track of the context, that’s a red flag for usability in real-world scenarios.
Two critical questions to ask during this process:
Does the tool generate SQL that can be inspected to understand how answers are derived?
Can you run dry-query validations to catch syntax errors and estimate costs before executing on live data? These steps ensure both transparency and efficiency [4][7].
Evaluate the Semantic Layer for Consistent Business Logic
A strong semantic layer sets apart a reliable BI tool from one that simply looks good in a demo. Without it, the tool may rely on raw database schemas, increasing the risk of output errors or "hallucinations." In fact, teams using a governed semantic layer report 22% fewer AI hallucinations and deploy AI 28% faster [6].
To test this, define a key metric like "revenue" or "active users" in the semantic layer and ensure that this definition remains consistent across dashboards, notebooks, and AI-generated answers. A useful vendor question would be, "What happens to our semantic layer if we switch to a different data warehouse?" This is crucial since 66% of data leaders prioritize the ability to migrate BI tools without rebuilding their definitions [6].
"The question is not 'Does this vendor have a semantic layer?' It is 'Will this semantic layer still work when our stack changes?'" – Henry Guo, Director of Outbound Product Management, Strategy [6]
Querio's shared context layer is an example of this in action. It allows teams to define joins, metrics, and business terms once and apply them consistently across all outputs, ensuring reliability and stability.
Check Notebook Capabilities for Deep Analysis
While natural-language querying is a core feature, deep analysis often requires robust notebook functionality. Not every analytical problem fits neatly into a chat-based interface. Data analysts and scientists need tools that support iterative and complex workflows. Look for reactive notebooks that accommodate both SQL and Python while automatically updating results when underlying logic changes.
To assess this, replicate a recent analysis in the notebook. If the process feels clunky or takes significantly longer than expected, it’s a sign that the notebook functionality may not be up to par.
Review Dashboard and Reporting Features
Dashboards should be more than just visually appealing - they must deliver functionality. Ensure that reports pull from live warehouse data rather than outdated cached extracts. Scheduled reports should support U.S. time zones (ET, CT, MT, PT) and adhere to standard date formats (MM/DD/YYYY), which is critical for teams spread across the country.
Additionally, check for support for embedded analytics tools and platforms. If your team needs to integrate insights into a customer-facing app, the BI tool should offer APIs or iframe embedding that uses the same governed logic across outputs. Secure data governance underpins all reliable reporting.
Review Governance, Security, and Compliance
Finally, after confirming the tool's core features, focus on its security and compliance capabilities. A key area to examine is row-level security (RLS). Verify that RLS is enforced at query time on live warehouse data, not on cached extracts that could bypass permissions. For example, log in as two different user roles and run the same query. The results should automatically reflect the appropriate permissions for each role without manual intervention [5].
Other critical security features to confirm include:
SOC 2 Type II compliance to ensure the vendor meets baseline security standards.
SSO/SAML integration for centralized access management.
Audit logs that track all AI prompts and queries, supporting regulatory compliance.
PII masking to protect sensitive customer data by masking fields for unauthorized users.
For instance, Querio connects to data warehouses using encrypted, read-only connections and avoids storing data for model training - minimizing privacy risks.
Governance Capability | What to Verify | Why It Matters |
|---|---|---|
Row-Level Security | Enforced at query time, not via cached extracts | Prevents unauthorized data exposure |
Audit Logs | Exportable logs of all AI prompts and queries | Supports regulatory compliance |
PII Masking | Sensitive fields masked for unauthorized roles | Protects sensitive customer data |
SSO/SAML | Integration with your existing identity provider | Enables centralized access management |
SOC 2 Type II | Current certification held by the vendor | Confirms baseline security practices |
Step 3: Test Integration, Scalability, and Performance
Once core functionality and governance are in place, the focus shifts to ensuring the tool integrates well with your existing systems and performs efficiently under real-world conditions. Integration hiccups or performance bottlenecks can derail user adoption and limit the tool’s usefulness. A critical step here is verifying seamless integration with your data warehouse.
Verify Data Warehouse Integration
Start by checking if the tool offers native connectors for your data warehouse, whether it’s Snowflake, BigQuery, Amazon Redshift, or another platform. Native connectors enable the tool to query live data directly, ensuring that reports always reflect the most current numbers.
Pay close attention to support for U.S.-specific formats, like USD ($) currency, MM/DD/YYYY date formats, and comma-separated thousands (e.g., 1,250,000). These details might seem minor, but they’re essential for maintaining consistency in financial reporting and other critical outputs.
To ensure data quality, it’s a good idea to implement automated validation processes. Tools like Great Expectations or Deequ can help by running unit tests on the data feeding into the tool [9]. This step can catch issues like pipeline failures or schema changes before they lead to flawed insights.
Test Query Performance and Concurrency
A tool that works well for a single user might struggle under heavier workloads. Start by setting a latency budget - for user-facing queries, aim for results within 2 seconds. Then, simulate real-world usage by testing how the tool handles multiple users working simultaneously. Estimate query volumes for launch, 6 months in, and 18 months down the road, and stress-test the system accordingly [12].
Keep peak demand in mind. For instance, calculate the number of active users during high-traffic periods, factor in a multiplier for workflows (since one user query might trigger multiple SQL calls), and include retries for failed queries [12]. Don’t forget about repair loops - these regenerate SQL after errors but can add to both latency and operational costs [11].
"The question isn't just whether your BI tool can generate SQL. It's whether your users trust the results enough to make decisions with them." – Databricks [10]
Performance costs can vary widely. SQL generation costs, for example, typically range from $9 to $30 per 10,000 analyst queries, and there’s a 91x cost gap between budget-friendly and premium AI models handling similar volumes [11]. These differences can significantly affect the total cost of ownership as your usage grows.
Review Reliability and Monitoring Practices
Before moving to user acceptance testing, aim for at least 80% accuracy on a set of 10–20 representative questions validated by your analysts [10]. While tools using generative BI have been reported to enable decision-making up to 5x faster by improving data access [1] through generative BI embedded natural language question answer capabilities, this advantage only holds if the tool produces consistently reliable answers. If accuracy falls short during testing, treat it as a major red flag that needs immediate attention.
Step 4: Analyze Costs, Contracts, and Proof of Concept
Once you've confirmed that the technical performance meets your needs, it's time to dig into the financial and contractual details. This step is essential to avoid unexpected risks and ensure that the solution is not only effective but also sustainable for your organization.
Break Down Total Cost of Ownership
Many organizations underestimate their total cost of ownership (TCO) - often by 60–70%. In reality, the TCO can end up being 3–5 times higher than the initial subscription budget [13]. Why? Because some costs don’t show up on the vendor's pricing page.
Here are some of the most common hidden expenses:
Technical configuration: Setting up the system can take anywhere from 40 to 120 hours.
Custom data warehouse integration: This can cost between $15,000 and $75,000.
Ongoing platform administration: Depending on your team size, this could require 5 to 40+ hours per week.
Validation time costs: If your team spends time validating AI-generated insights or fixing data errors, the costs add up quickly. For instance, a 20-person sales team dedicating just 30 minutes a day to data validation could cost your organization $250,000 annually in lost productivity [13].
Don't forget to include AI-specific costs, which can vary widely between standard and premium models. To stay prepared, add a 20–30% contingency for unexpected expenses [11][13].
Review Contract Terms and Risk Mitigation
Signing a 12-month contract is a serious commitment, and the fine print can make or break your experience. For instance, switching BI tools after two years could cost anywhere from $80,000 to $420,000 when you factor in migration, parallel running, and lost productivity during the transition [2]. It’s far better to negotiate the right terms upfront than to deal with costly fixes later.
Key clauses to focus on include:
Pricing protection: Lock in pricing for the full initial term and limit renewal increases to a set percentage above CPI.
Data training opt-out: Ensure your prompts and outputs won’t be used to train the vendor’s models.
Exit and portability rights: Confirm that your data can be returned in standard formats like CSV or JSON, and secure at least 90 days of exit assistance. If the vendor uses proprietary transformation layers, negotiate to retain your data logic in a tool like dbt. This can cut migration effort by 40–60% if you ever need to switch [2].
"The AI vendor sales cycle is designed to create urgency. The best protection for enterprise buyers is a structured checklist that forces answers to the questions the vendor would prefer to defer until after the contract is signed." – Fredrik Filipsson, Redress Compliance [15]
Additionally, request current SOC 2 Type 2 reports and ISO 27001 certification before signing. Make sure the contract includes IP indemnity coverage for AI-generated outputs [15].
Once these safeguards are in place, validate everything with a real-world test during the proof of concept phase.
Design a Structured Proof of Concept
A polished vendor demo might look impressive, but it’s no substitute for testing the system with your actual data. Before committing, insist on a 30–90 day paid pilot [13][14]. This test period should follow a clear structure:
Week 1: Align stakeholders on goals and requirements.
Week 2: Shortlist tools by reviewing a business intelligence software comparison that meets your needs.
Week 3: Conduct a hands-on proof of concept using real queries.
Week 4: Complete a 3-year TCO analysis based on pilot findings.
During the proof of concept, test the system with at least 100 real-world questions your team regularly asks - not cherry-picked examples. Evaluate key factors like answer accuracy, integration challenges, and how much manual validation your analysts need to do. Use the results to ask the vendor for a production cost model that accounts for a 3x–5x growth multiplier. These pilot insights will give you a far clearer picture than any sales estimate ever could [15].
Conclusion: Making the Final Decision
Recap the Key Evaluation Criteria
When evaluating a tool, focus on seven critical areas: business fit, natural-language accuracy, data governance, integration effort, scalability, pricing/TCO, and contract flexibility. It's important not to let a single factor carry too much weight. Each criterion should meet baseline requirements - if any fail, the tool shouldn't be considered. The ultimate decision depends on how well you compare business intelligence tools across all these dimensions, starting from defining business needs to the proof of concept phase. To ensure fairness and clarity, use a structured scoring framework to quantify your evaluation.
Use a Scoring Framework to Guide Your Decision
Making an informed decision, especially when committing to a 12-month contract, requires an objective scoring process. A scoring matrix can help translate pilot outcomes into a clear decision. Rate each tool on a scale of 1 (major blocker) to 5 (clearly valuable) for each criterion, applying weights based on your organization’s priorities. Define your pass/fail thresholds upfront to avoid bias - for example, setting a requirement such as "must save at least 30 minutes per analyst per week." This approach ensures the evaluation remains grounded in measurable outcomes[16][17].
Criterion | Suggested Weight | Rate (1=blocker, 5=valuable) |
|---|---|---|
Business & problem-solution fit | 15% | |
Natural-language accuracy | 15% | |
Governance & data security | 15% | |
Integration effort | 15% | |
Scalability (3x current load) | 15% | |
Pricing & 3-year TCO | 10% | |
Contract flexibility | 15% |
If a tool fails a non-negotiable criterion - such as insufficient governance or security - it should be disqualified, no matter how well it scores in other areas.
"The most successful generative BI implementations we've seen don't replace human analysts - they augment them. The technology handles routine queries and basic analysis, freeing up data scientists to focus on more complex, high-value problems." – Michael Chen, Research Director, Gartner[1]
Document Lessons Learned for Future Decisions
After making your decision, take time to formalize the insights gained during the process. This step is critical, as 73% of BI implementations fail to deliver ROI in the first year[8]. Teams that succeed often credit their success to carefully documenting evaluation findings.
Track the actual hours spent on setup and data preparation compared to vendor estimates. Identify which user groups faced challenges with the interface and understand why. Pay close attention to proprietary features like custom transformation layers or vendor-specific dashboards, as these can become migration hurdles, raising future switching costs[2]. Additionally, keep shared metric definitions (e.g., "Monthly Active Users" or "Churn Rate") outside the BI tool - using a shared data dictionary or a dbt model can reduce migration efforts by 40–60%[2].
"The wrong BI tool costs you twice: once to implement, and again to replace." – Valiotti.com[2]
FAQs
What should my pilot prove before I sign a 12-month contract?
Before signing up for a 12-month contract with a generative BI tool, use the pilot phase to ensure it meets your needs. Check that it integrates securely with your data systems, aligns with your workflows, and produces accurate insights you can act on. It’s also important to evaluate its scalability, how easily users adopt it, and key performance indicators like query speed and success rates. Consistency in results and its ability to support decision-making processes are crucial for determining long-term value and ROI.
How do I test if answers are accurate and explainable?
To make sure answers are both accurate and easy to understand, compare the tool's results to what you'd expect from the query. Test how well it handles complex questions and whether its explanations are clear. Pay attention to source references, the logic it uses, and any assumptions it makes. Use examples from real business situations to see if the outputs match your expertise. Additionally, monitor its performance over time to ensure it remains dependable.
Which contract terms reduce vendor lock-in the most?
To avoid being overly dependent on a single vendor, it’s important to include specific terms in your contracts. Here are the key elements to focus on:
Data portability: Make sure the vendor allows you to export your data in open formats like CSV or JSON. This ensures you can easily take your data elsewhere if needed.
Flexible cancellation policies: Look for clear cancellation clauses that don’t include hefty penalties or long-term commitments. This gives you the freedom to exit the agreement without unnecessary complications.
Avoid proprietary restrictions: Ensure there are no restrictions on migrating your data or content ownership. You should retain full control over your assets, even if you decide to switch providers.
These terms simplify the process of moving to a new vendor and help maintain your independence.
Related Blog Posts