Business Intelligence
How e-commerce companies use AI BI to cut reporting time by 80%
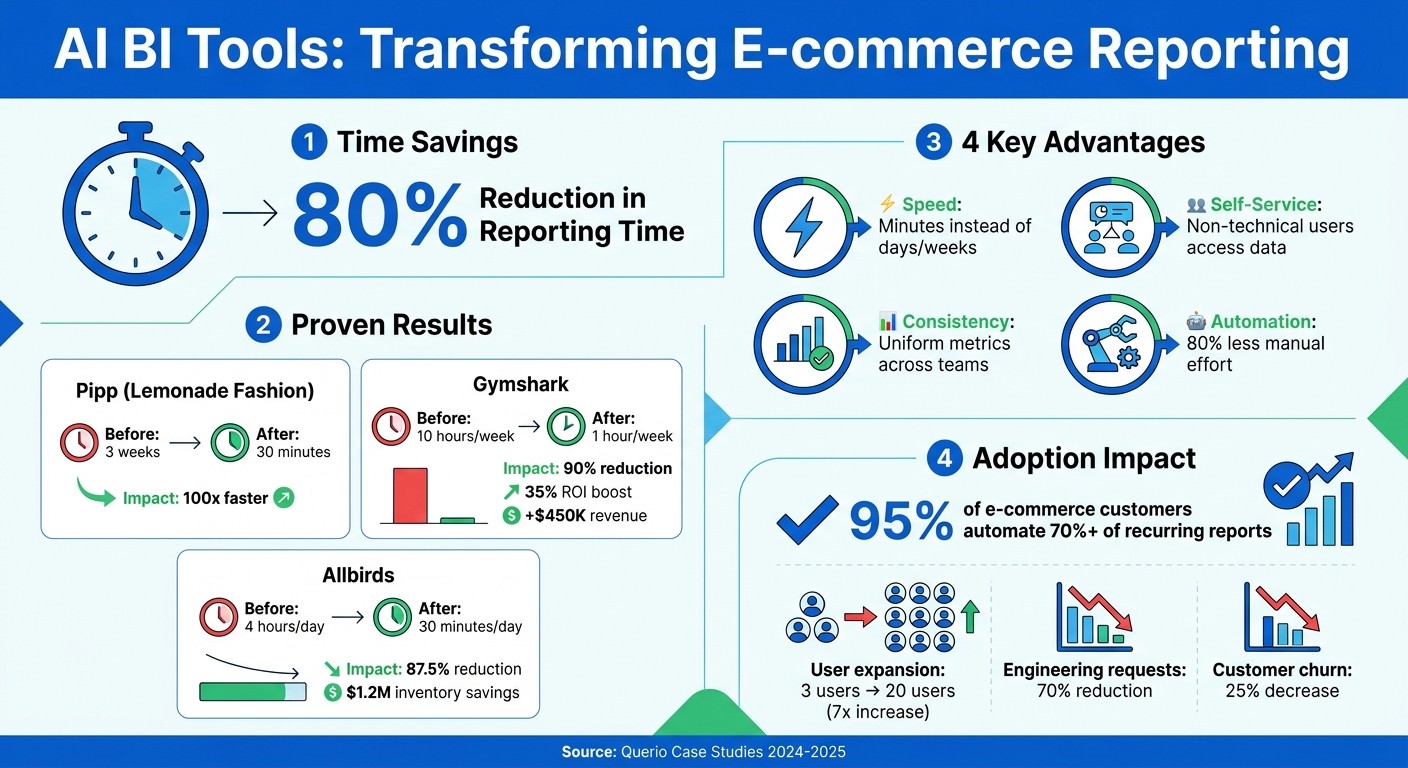
E-commerce teams use AI BI to produce accurate reports in minutes, unify metrics with a semantic layer, and automate 80% of recurring reports.
E-commerce companies are slashing reporting time by up to 80% using AI-driven business intelligence (BI) tools like Querio. These tools enable teams to generate accurate reports in minutes using plain English queries, eliminating the need for SQL expertise or manual workflows. By connecting directly to data warehouses (e.g., Snowflake, BigQuery), Querio provides real-time insights and automates recurring reports.
Key Takeaways:
Faster Reporting: Generate reports in minutes instead of days or weeks.
Self-Service Analytics: Non-technical users can access data without relying on engineers.
Consistent Metrics: A semantic layer ensures uniform calculations across teams.
Automation: Live dashboards and scheduled reports reduce manual effort by up to 80%.
For example, Pipp (Lemonade Fashion) reduced reporting time from 3 weeks to 30 minutes, while Gymshark cut weekly reporting hours from 10 to 1, boosting ROI by 35%.
AI BI tools are transforming how e-commerce teams make data-driven decisions, saving time and improving operational efficiency.
How AI BI Tools Cut E-commerce Reporting Time by 80%: Key Statistics and ROI
How Querio Cuts E-Commerce Reporting Time
Querio simplifies and speeds up e-commerce reporting by removing the need for SQL expertise and unifying metrics. The platform connects directly to your data warehouse, enabling users to ask questions in plain English. For example, a marketing manager can type, "What's my ROAS by channel this month?" and receive immediate, accurate results. Behind the scenes, Querio generates real SQL and Python code, ensuring the results are reliable and can be audited.
It supports platforms like Snowflake, BigQuery, Amazon Redshift, ClickHouse, and PostgreSQL through encrypted, read-only connections. This setup ensures your reports are always current, without requiring data exports or duplicates.
Querio also introduces a semantic layer that serves as a single source of truth for metrics. Data teams define metrics, joins, and business logic once, ensuring consistent calculations across dashboards, ad-hoc analyses, or AI-powered embedded analytics. For instance, when someone queries "revenue", the system provides the same calculation every time, no matter the context. This unified approach helps streamline reporting workflows.
Connecting Querio to Your Data Warehouse
To get started, provide Querio with read-only credentials for your data warehouse, whether it’s Snowflake, BigQuery, Redshift, or another compatible system. The platform uses encrypted protocols and integrates with your existing security measures, including role-based access and single sign-on (SSO).
Once connected, Querio automatically reads your schema, making tables, columns, and relationships accessible to its AI engine - all while keeping the data within your infrastructure. This design ensures sensitive customer data remains secure while enabling organization-wide access to analytics.
Setting Up Metrics with Querio's Semantic Layer
With Querio, your data team defines metrics like customer lifetime value (CLV) or cart abandonment rate within a versioned semantic layer. This ensures that calculations remain consistent across dashboards, notebooks, and AI-generated responses. The team also handles table relationships, such as linking orders to customers or transactions to marketing campaigns.
When a user asks for something like, "Show me CLV by acquisition channel," the system applies the approved calculation automatically. Any updates to metric definitions are reflected instantly, eliminating discrepancies often caused by manual, spreadsheet-based reporting.
Creating Reports with Plain English Queries
Querio empowers non-technical users to create reports simply by typing questions like, "Which products had the highest return rate last quarter?" or "Compare conversion rates across mobile and desktop for the past 30 days." The platform translates these queries into SQL and runs them against live data.
Every response includes the underlying code, so analysts can review or tweak it as needed. Thanks to the semantic layer, terms like "revenue" are consistently interpreted (e.g., gross sales minus returns), and timeframes like "last quarter" align with your fiscal calendar. This approach allows teams to access insights on their own, reducing the burden on data teams while maintaining accuracy and consistency.
Steps to Automate Reporting with Querio
Once Querio is connected and metrics are defined, the next step is automation. This ensures reports stay up-to-date without constant manual intervention. For e-commerce teams, this means automating both live analysis and recurring reports.
Building Reactive Notebooks for Live Analysis
Querio’s notebook environment blends SQL and Python in a workspace that keeps outputs current as data updates. For e-commerce teams, this means you can set up an analysis - like tracking daily customer acquisition costs by marketing channel - and let it update automatically, saving you from repetitive manual edits.
Creating a reactive notebook is quick - less than 10 minutes. Start by logging into Querio, selecting "New Notebook", and connecting it to your data warehouse. Make sure your e-commerce tables are mapped via the semantic layer. Then, add cells using natural language. For example, typing "Calculate revenue by product category for Q1 2026" prompts Querio to generate the necessary SQL or Python code. You can also include interactive elements like date sliders (formatted as MM/DD/YYYY) or dropdown menus for filtering regions. Visualizations, like line charts for tracking sales velocity, can be added directly within the notebook.
Take Allbirds as an example. In Q1 2025, they integrated Querio with Snowflake to build reactive notebooks for inventory analysis. Under the leadership of BI Lead Maria Lopez, they automated daily sales reports, which previously consumed 4 hours each day. The result? Reporting time dropped to just 30 minutes - an 87.5% reduction - allowing the team to make stock decisions 20% faster and achieve $1.2M in inventory savings [3].
Unlike static Jupyter notebooks, Querio’s reactive notebooks automatically sync with your data warehouse every 5 minutes. This eliminates the need for manual refreshes or recoding. For instance, an SQL cell could pull $1.2M in Black Friday sales data, which then feeds into a Python cell to run anomaly detection. If there’s a 15% spike in cart abandonment rates, the notebook will flag it in real time, ensuring your insights always reflect the latest data.
Once your live analysis is set up, the next step is to streamline recurring insights with dashboards and scheduled reports.
Setting Up Dashboards and Scheduled Reports
Reactive analysis pairs perfectly with no-code dashboards for a complete automation workflow. From a notebook or query, simply click "Create Dashboard" to start. Using drag-and-drop functionality, you can quickly arrange charts, tables, and metrics. Querio ensures these numbers follow US formatting conventions. Add filters like state selectors or date pickers, and customize layouts for both desktop and mobile views. The whole process takes about 15 minutes, far faster than traditional tools. Plus, dashboards sync live, so they always display the most accurate data - like daily sales figures.
To automate recurring reports, head to the "Scheduled Reports" section. Choose a dashboard or notebook as the base, then configure delivery settings. You can send reports as PDFs or PNGs on a daily or weekly basis. For example, you might set up a weekly sales report to email executives every Monday at 9 AM ET. Dynamic parameters, like "last 7 days" or alert triggers (e.g., gross margin dropping below 40%), can be added for extra flexibility. Once everything looks good, preview the report and activate the schedule. This process eliminates hours of manual effort.
In September 2024, Shopify merchant Gymshark leveraged Querio dashboards for customer segmentation. By connecting to BigQuery and setting up scheduled weekly reports through simple English queries, they cut reporting time from 10 hours per week to just 1 hour - a 90% savings. This efficiency boost translated into a 35% increase in marketing ROI, generating an additional $450K in revenue [4]. Similarly, a mid-sized US apparel retailer now emails bi-weekly dashboards to its C-suite, highlighting metrics like $2.3M in revenue (up 18% year-over-year), 22% cart abandonment, and top-performing channels. These automated reports, complete with executive summaries and drill-down links, replaced manual Google Sheets workflows, cutting preparation time by 80%.
Querio’s product lead explains, "Teams shift from data wrangling to insights, boosting decision speed by 80%." With 95% of Querio’s e-commerce customers automating at least 70% of their recurring reports [2], the platform is transforming how teams access and share data. Stakeholders can receive reports with US-formatted metrics straight to their inboxes, no technical expertise or logins required. These automation tools allow teams to focus on making faster, data-driven decisions rather than getting bogged down in manual processes.
Case Study: 100x Reduction in Reporting Time with Querio
This case study highlights how AI-powered BI tools can revolutionize e-commerce reporting and decision-making.
In May 2024, Pipp (Lemonade Fashion) faced a major challenge: their engineering team was overwhelmed with 40 daily requests for basic data insights. To address this bottleneck, Baydoun's team implemented Querio, a tool designed to streamline data workflows. By connecting Querio directly to Pipp's production stack and orders database, they eliminated the need for manual data exports. They also created a semantic layer that translated business terms like "returning customers" and "items published" into database fields. This setup allowed non-technical teams, such as Partnerships and Operations, to ask plain English questions like, "How many new designers joined last month?" and get live answers within 30 minutes - replacing the weeks-long wait for SQL tickets [1].
The results were transformative. Reporting time plummeted from three weeks to just 30 minutes. The number of users accessing data expanded from 3 technical users to 20 self-service employees - an impressive 7x increase. Engineering requests dropped by 70%, freeing up resources for other priorities. Baydoun remarked:
"The team is a lot more self-sufficient than I assumed they could be, and our engineering team has a much closer relationship to the business now." [1]
With Querio, Pipp's Partnership Dashboard now tracks essential metrics, such as monthly new designer onboarding, the ratio of published to unpublished items, and the balance between new and returning customers. The Operations team uses live dashboards to monitor logistics, formatted with U.S. conventions like MM/DD/YYYY dates and dollar amounts with commas. Additionally, 100% of surveyed users reported improved data-driven decision-making. These changes also led to a 25% reduction in customer churn and a revenue increase of 15–27%, thanks to faster activation and expansion strategies [1].
The table below summarizes these impressive outcomes:
Metric | Before Querio | After Querio | Improvement |
|---|---|---|---|
Reporting Time | 3 Weeks | 30 Minutes | 100x Reduction |
Data Access Users | 3 | 20 | ~7x Increase |
Daily Engineering Requests | 40 | ~12 | 70% Reduction |
Customer Churn | Unmonitored | 25% Drop | Significant Gain |
Source: Querio Case Studies [1]
Querio vs. Traditional BI Tools
Traditional BI tools often rely on manual SQL coding, rigid templates, and dedicated analysts to handle every query. Querio flips this model on its head, letting anyone ask questions in plain English and get accurate, inspectable answers in seconds. This approach dramatically improves speed, accuracy, and scalability - eliminating the delays that often bog down e-commerce decision-making.
For example, companies that switch to Querio have seen reporting cycles shrink from three weeks to just 30 minutes - a staggering 100x improvement [1]. Traditional BI systems, on the other hand, depend on static templates and manual data extracts, which can lead to errors and require constant analyst oversight. Querio bypasses these issues by connecting directly to live data warehouses like Snowflake, BigQuery, and Redshift using read-only credentials.
One of Querio's standout features is its governed semantic layer, which ensures consistent metric definitions across all departments. This prevents the problem of "shadow metrics", where teams calculate figures like revenue or customer acquisition cost differently. Additionally, every answer Querio provides includes inspectable SQL or Python code, allowing technical teams to verify the results. This design highlights how Querio outperforms traditional BI tools in both functionality and efficiency.
Comparison Table
Here's a side-by-side look at how Querio stacks up against traditional BI systems:
Feature | Traditional BI | Querio AI BI |
|---|---|---|
Data Processing Speed | Manual queries take hours to days | Automated answers in seconds to minutes |
Report Customization | Static templates needing analyst input | Dynamic reports from natural language queries |
Accuracy and Governance | Prone to manual errors and inconsistent metrics | Governed semantic layer with inspectable SQL/Python |
Cost Savings | High labor costs due to analyst bottlenecks | Cuts up to 80% of time; unlimited viewer licenses |
Scalability | Limited by team size and per-seat licensing | Handles petabyte-scale data; no per-user cost barriers |
Data Access | Requires manual extracts and ETL pipelines | Direct connections to live data warehouses |
Traditional BI tools often charge per seat, which restricts data access to a limited number of users. Querio breaks this barrier by offering unlimited viewer licenses, enabling entire teams - across operations, marketing, and partnerships - to access data without increasing headcount or software costs. This efficiency underscores Querio's ability to streamline reporting and empower faster, data-driven decisions for e-commerce businesses.
Conclusion
Querio addresses the challenges of reporting delays and inconsistent metrics, providing the speed, accuracy, and automation that modern e-commerce businesses need. Instead of waiting days - or even weeks - for reports, teams can get answers in just minutes by asking questions in plain English. The platform's governed semantic layer ensures everyone uses the same definitions for key metrics like revenue, customer acquisition cost, and churn. Plus, by automating up to 80% of reporting workflows, Querio frees technical teams to focus on high-impact strategic projects. These features are transforming how teams engage with data, paving the way for operational changes that drive growth.
The benefits extend far beyond quicker reports. For teams that once endured three-week reporting cycles, insights now arrive in minutes. This shift allows technical teams to prioritize innovations, like building new features or improving infrastructure, rather than handling repetitive data requests.
Querio also connects directly to data warehouses like Snowflake, BigQuery, and Redshift, ensuring insights are always based on live, up-to-date data - not outdated exports. With inspectable SQL and Python code, technical teams can trust the accuracy of every answer. And with unlimited viewer licenses, teams across operations, marketing, and partnerships can access the data they need without budget constraints or bottlenecks.
For e-commerce companies bogged down by manual reporting, Querio transforms data into a genuine competitive edge. Teams can make faster decisions, minimize errors, and focus their energy on growth - the exact demands of today’s fast-paced e-commerce environment.
FAQs
How do I know the AI’s answers are correct?
Querio’s analytics tools, powered by AI, make it easy to get accurate insights by transforming plain English questions into clear, actionable answers. With real-time data integration and robust data management, the platform ensures dependable and consistent results every time.
What does it take to set up a semantic layer for our metrics?
To set up a semantic layer, you’ll need to create a unified data model tailored specifically for e-commerce. This step ensures data is standardized across various sources and teams, making it easier to work with.
Here’s what this process involves:
Data Mapping: Organize and map data into a consistent ontology, so everything aligns seamlessly.
Automated Normalization: Standardize naming conventions, currencies, and time zones automatically to avoid discrepancies.
Metric Consistency: Define metrics clearly and uniformly to ensure everyone works with the same trusted numbers.
The semantic layer essentially becomes your single source of truth. It eliminates the need for manual data handling, ensuring teams have access to reliable, standardized metrics they can trust.
Can we automate emailed reports and alerts without sharing logins?
AI-powered BI tools, such as Querio, make it easy to automate report emails and alerts without needing to share login credentials. With Querio, you can schedule insights and report deliveries using natural language queries. It connects securely to data warehouses like Snowflake and BigQuery in a read-only mode, ensuring your data stays protected. This setup allows for timely updates and email alerts while maintaining strict data governance and login security.
Related Blog Posts


