Business Intelligence
BI for marketplaces: how to track GMV, take rate, and cohorts without a data team
Centralize data, automate imports, and use self‑service analytics to track GMV, take rate, and cohorts without a data team.
Tracking GMV, take rate, and customer cohorts is essential for marketplace growth. These metrics help you understand transaction volume, revenue retention, and customer loyalty over time. However, many small teams struggle with data challenges like fragmented systems, manual reporting, and lack of analytics expertise.
Here’s how you can simplify the process:
Centralize your data: Use tools like direct connectors, third-party ETL platforms, or custom pipelines to unify data from platforms like Shopify, Amazon, and Google Analytics.
Automate imports: Schedule incremental data updates to avoid errors and save time.
Use self-service analytics: Tools like Querio let you query metrics in plain English, define reusable formulas for GMV, take rate, and cohorts, and create automated reports.
Monitor and improve: Analyze trends, segment metrics by category or region, and run experiments to refine pricing and retention strategies.
With the right tools and processes, even lean teams can track these metrics effectively without needing a dedicated data team.
Eleven marketplace metrics to measure your success | Marketplace Academy
How to Centralize Your Marketplace Data
Comparison of Three Data Centralization Methods for Marketplace Analytics
Connecting Your Sales, Inventory, and Customer Data
Centralizing your marketplace data is the first step to effectively tracking metrics like GMV, take rate, and customer cohorts. Marketplace operators often pull data from various platforms - Shopify for direct sales, Amazon Seller Central for FBA orders, eBay for auctions, and Google Analytics for traffic. Without a unified system, your reports will always be incomplete.
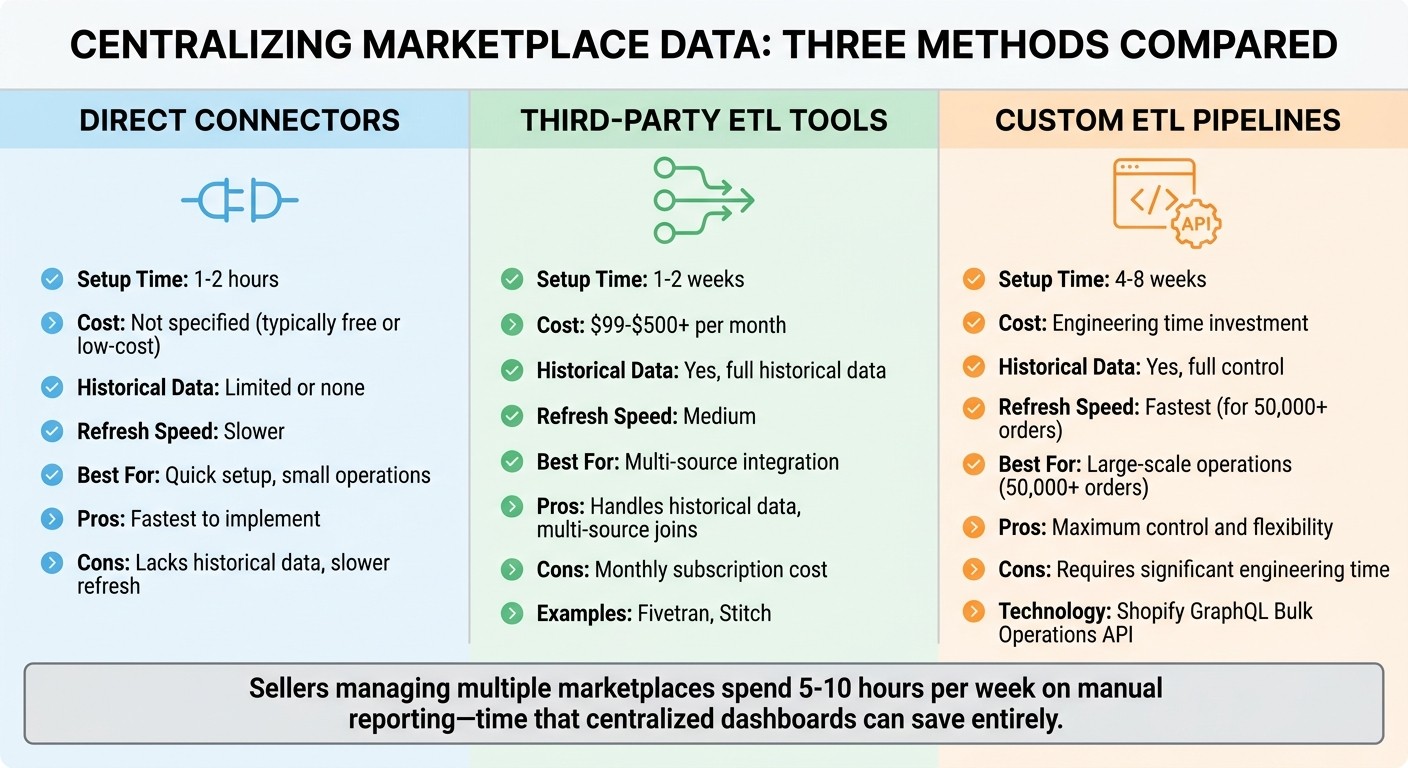
There are three main ways to consolidate this data:
Direct connectors: These are the quickest to set up, usually taking just 1-2 hours. However, they often lack historical data and tend to refresh more slowly.
Third-party ETL tools: Platforms like Fivetran or Stitch cost between $99 and $500+ per month and can handle historical data and multi-source joins within 1-2 weeks [3].
Custom ETL pipelines: Using APIs like Shopify's GraphQL Bulk Operations offers maximum control but requires 4-8 weeks of engineering time [3]. For stores managing over 50,000 orders, GraphQL Bulk Operations is faster than REST APIs, which can hit rate limits during nightly updates [3].
Once your data is centralized, structuring it in a star schema can make processing and analysis much more efficient. Group transactional data like orders and refunds into "Fact Tables" and descriptive information like customers, products, and dates into "Dimension Tables" [3]. If you’re managing multiple marketplaces, ERP systems like Odoo can serve as a central hub, integrating platforms like Amazon, eBay, and Walmart directly into your operational and financial records [5]. Sellers juggling multiple marketplaces often spend 5-10 hours per week on manual reporting - time that a centralized dashboard can save entirely [5].
After centralizing your data, the next step is automating its import to keep everything current.
Automating Data Imports to Keep Information Current
Manually updating data is not only time-consuming but also prone to errors. Automation ensures your analytics stay up-to-date without constant intervention. Incremental refreshes are particularly effective - they process only the most recent 30 days of data instead of reprocessing your entire dataset, avoiding API rate limits and significantly reducing refresh times [3].
Schedule these automated imports during off-peak hours, such as 4 AM UTC, and set up systems to detect API changes, credential expirations, or schema shifts to prevent data gaps [3][6]. For marketing attribution, automate UTM capture using Shopify's landing_site field or similar attributes [3]. It’s also essential to maintain two views: one for near-real-time operational monitoring and another reconciled view for formal reporting [2]. Standardize key definitions - like GMV, average order value, and net revenue - across platforms early on, and decide whether to include or exclude shipping and taxes [2][4].
"Revenue is vanity; contribution margin is sanity." - ECOSIRE Team [5]
Lastly, ensure you capture snapshot metadata and campaign mappings before ad platforms overwrite historical data. This is crucial for reconstructing first-touch or first-order cohorts later [2]. With automation, your data remains consistent and ready for immediate analysis.
Setting Up Self-Service Analytics with Querio
Once you've centralized and automated your data imports, the next step is enabling your team with self-service analytics. Querio makes this process seamless.
Connecting Querio to Your Data Warehouse
Querio integrates directly with your existing data warehouse using encrypted, read-only credentials. It supports major platforms like Google BigQuery, Snowflake, Amazon Redshift, ClickHouse, and PostgreSQL, covering most common setups for marketplace operators.
The connection process is quick - typically taking 15 to 30 minutes. You'll need to provide your warehouse credentials, specify which schemas or tables Querio can access, and set up role-based permissions for your team. Once connected, Querio queries your live data in real-time, so your analytics always reflect the most up-to-date information without needing manual refreshes or scheduled syncs.
After connecting, you'll configure a shared semantic layer - a centralized space for defining how tables relate to each other, clarifying metrics, and standardizing the business terms used across your organization. This step ensures everyone works from the same definitions for key metrics like GMV, take rate, and customer cohorts, avoiding inconsistencies across reports. You'll also create reusable formulas to streamline metric calculations for your team.
Creating Reusable Formulas for GMV, Take Rate, and Cohorts
With your warehouse connected, Querio allows you to define reusable metric formulas that your team can use without needing SQL expertise. For example:
Define GMV as
SUM(order_value), specifying whether to include or exclude shipping, taxes, and refunds.Calculate the take rate as
platform_fees / GMV, with the flexibility to segment by seller, category, or region.For cohort analysis, group customers by their first purchase month using a formula like
DATE_TRUNC('month', first_purchase_date). This enables tracking of repeat purchase rates, lifetime value, and retention by cohort, across various acquisition channels or promotional campaigns.
"It's not just about saving time and money, it's about making data accessible." - Enver Melih Sorkun, Co-founder & CTO, Growdash [7]
These formulas, defined within Querio's semantic layer, are applied consistently across dashboards, reports, and AI-generated answers. This means your team can ask natural-language questions like "What was our GMV last month?" or "Which seller segment has the highest take rate?" Querio then uses the predefined formulas to generate precise SQL queries and deliver accurate results. Plus, every answer is inspectable, allowing you to view the exact logic and data behind the results.
How to Track and Improve Your Key Metrics
With your data centralized and formulas ready, you’re set to track and refine your marketplace’s core metrics. Querio’s natural-language interface makes it easy to query your data without needing SQL skills, while also letting you review the underlying logic for accuracy.
Monitoring GMV Trends with Plain English Questions
Want to know your Gross Merchandise Value (GMV) trends? Just ask questions like, “What was our GMV last month?” or “Show me GMV by category for Q1 2026.” Querio automatically generates the SQL query using your predefined formulas. You can verify the generated code, save the query for future use, or share it with your team.
Break down your GMV data to uncover growth drivers. For example, you can segment GMV by device type, traffic source, geography, or customer profile (e.g., new versus repeat buyers). A query like, “What’s our GMV from mobile users in California this month?” helps pinpoint which channels or audiences are delivering the most value [2]. To ensure growth is sustainable, pair GMV data with profitability metrics like contribution margin and return rates [2].
Once you’ve analyzed GMV, dive deeper into your pricing strategy by examining take rate variations across seller groups.
Analyzing Take Rate Across Seller Segments
Understanding how your take rate differs across seller tiers can reveal whether your pricing strategy is consistent. For instance, you might query, “Show me take rate by seller volume tier” or “Compare take rate between new and established sellers.” Querio applies your predefined take rate formula to segment the data.
Segmenting take rates by seller tier can uncover pricing inconsistencies [8]. When calculating take rate, it’s important to adjust for refunds, cancellations, and chargebacks to avoid skewing the metric [8]. A notable example is Etsy’s decision in February 2022 to raise its take rate from 5% to 6.5%. Despite a strike involving 5,000 sellers, Etsy’s revenue jumped 10% the following quarter, and the platform added 6–7 million new buyers. This underscores the importance of monitoring take rate alongside seller retention [1].
Once you understand pricing performance, shift your focus to customer behavior through cohort analysis.
Building Cohort Analysis for Retention and Lifetime Value
Cohort analysis helps you group customers by their first purchase date and track their behavior over time. For example, you could ask, “What’s the repeat purchase rate for customers who joined in January 2026?” or “Show me lifetime value by acquisition channel.” Querio organizes customers by first_purchase_date to calculate retention and lifetime value metrics.
This approach highlights high-value customer segments and flags early retention problems. For perspective, 65% of e-commerce executives now track satisfaction metrics like Net Promoter Score (NPS) alongside financial KPIs in real-time dashboards [2]. By combining retention and customer experience data, marketplace operators can make more informed decisions. You can also refine your strategies by asking follow-up questions like, “Which cohort has the highest 90-day retention rate?” to better target acquisition and retention efforts.
Automating Reports and Scaling Your Analytics
Querio makes it easier to automate reports and streamline workflows, cutting down the manual work involved in analytics.
Setting Up Automated Reports for Your Key Metrics
To get started, click on "Dashboards" and then select "New Automated Report." From there, you can choose pre-built formulas for metrics like GMV, take rate, and cohorts. Set up schedules to fit your needs - whether that’s daily at 9:00 AM ET, every Monday, or the first of each month. You can also add recipients for email delivery, with options for PDF or CSV exports, or even push updates directly to Slack or Microsoft Teams.
Run a test report to confirm everything is working, ensuring metrics like $500,000 monthly GMV are displayed accurately. Activate "Data Freshness Alerts" to get notified immediately if a sync issue arises, such as a dropped connection to your data warehouse. You can also set thresholds to catch anomalies early, like triggering an alert if GMV drops by more than 20% compared to the previous period. According to Gartner’s 2024 research, 70% of organizations using automated BI reporting save over 10 hours a week on manual data tasks [9]. For example, one marketplace team reduced manual checks by 80% by setting alerts for take rate anomalies below 5%.
Tailor reports to specific roles. Share live, view-only dashboards with executives, send weekly cohort retention tables to marketing teams, and provide seller-specific take rate summaries to operations teams. Querio supports branded templates for cohort retention tables (e.g., Week 1: 85%, Week 4: 45%) and embedded charts for investor updates. In one instance, a report flagged a 15% GMV dip, prompting inventory adjustments that mitigated further losses.
With automated reports keeping watch on your metrics, you can focus on optimizing performance through controlled experiments.
Running A/B Tests and Iterative Experiments
Once your reporting is automated, you can take things further by running A/B tests to refine strategies and improve key metrics. Querio’s notebook feature integrates SQL, natural language queries, and visualizations - perfect for testing pricing changes or promotional campaigns. Simply create a new notebook and segment users into test and control groups using your cohort formula (e.g., "Users exposed to 10% vs. 15% take rate"). Query metrics like "Compare GMV and conversion rate between groups, USD, past 30 days (04/10/2026–05/10/2026)" and visualize the results with split bar charts.
You can quickly fork notebooks to test new ideas. For example, compare email promotions to in-app promotions or evaluate 20% discount campaigns against free shipping offers. One SaaS marketplace tested three promotional variants and increased retention by 22% by analyzing Day 30 cohort behavior. McKinsey Digital’s 2023 research found that marketplaces automating A/B tests see a 15–25% improvement in key metrics like take rate through rapid iteration [10]. To stay organized, tag your queries and set up dashboards that aggregate experiment metrics like p-values and lift (e.g., +$50,000 GMV at 95% confidence).
Steer clear of common mistakes. Validate your formulas before automating to avoid errors. For instance, one team discovered a take rate miscalculation (dollar amounts were used instead of percentages) during pre-validation, saving them 10 hours per week. Limit active tests to five at a time and auto-archive low-impact experiments. This approach allows lean teams to run over 20 experiments a year without overloading their data systems. For added control, integrate notebooks with Git to track changes in cohort definitions and pricing logic over time.
Marketplace Case Studies
Marketplace operators turn to Querio to tackle analytics challenges and achieve measurable growth, even without a dedicated data team. These stories show how self-service analytics empower lean teams to make quick, data-driven decisions.
E-Commerce Marketplace Boosts GMV by 20%
From October 2024 to October 2025, Jeddo George, a Lebanese meal service based in Dubai, UAE, grew from zero to $5 million in ARR - all without hiring a dedicated data specialist. The team faced a familiar hurdle: every business decision required a full day of manual data collection.
"We were flying blind. Every decision took a day of pulling data together before we could even have the conversation." - Maya Doumit, Co-Founder, Jeddo George
To solve this, Co-founder Maya Doumit integrated Querio with their production stack, pulling in app usage events and order data. This eliminated the need for manual data consolidation. With automated cohort analysis, they identified high-value customer segments, leading to a 20% increase in GMV. The integration saved the team 20 hours per week and helped them avoid $120,000 in annual costs by skipping two planned data-related hires.
"Honestly, it's amazing because it's taking 20–30% off my daily energy or focus. I never thought one tool could save me so much time." - Maya Doumit, Co-Founder, Jeddo George [11]
Querio's capabilities also shine in dynamic pricing adjustments, particularly for SaaS marketplaces.
SaaS Marketplace Enhances Take Rate Efficiency
Another example highlights how Querio helped a SaaS marketplace fine-tune its pricing strategy. Struggling with inconsistent fee structures, the operations team used Querio's live integration with transaction data to simplify take rate calculations. By running plain English queries, they compared seller segment performance and tested multiple pricing scenarios using interactive notebooks. This process uncovered opportunities to refine fee structures. Automated alerts ensured real-time monitoring, allowing the team to quickly address pricing issues - all without the need for a dedicated analyst.
Getting Started with Marketplace Analytics
What Marketplace Teams Should Remember
When diving into marketplace analytics, focus on tracking GMV (Gross Merchandise Value), take rate, and cohorts - even if you don't have a dedicated data engineering team. Use centralized data to simplify KPI tracking, and from the very beginning, clearly define and assign ownership for each KPI. For example, make sure there's no confusion between gross demand and net orders when calculating GMV. Break down blended metrics by device type, traffic source, and geography to spot trends and address issues more quickly [2].
Assigning ownership is key. Every KPI should have a designated team member responsible for monitoring and responding to changes in the numbers [12]. Tailor your review schedule to fit the pace of each metric: daily check-ins for fast-moving operational metrics like order volume, and monthly reviews for bigger-picture trends like cohort retention [12]. To keep your team motivated, set tiered targets - baseline, target, and stretch goals [12].
"The real value of a KPI isn't the number itself, but the conversation it starts." - Querio Practical Guide [12]
Don't forget to regularly audit your KPIs to make sure they align with your evolving business goals [12]. Here's a compelling stat: companies that adopt BI (Business Intelligence) solutions report an average ROI of 112%, and 95% of business professionals believe analytics are critical for future success [13]. A disciplined, structured approach like this ensures your marketplace analytics can scale as your business grows.
Try Querio Free
Querio makes it easy to put these practices into action. Its user-friendly platform connects directly to your data warehouse - whether you're using Snowflake, BigQuery, Redshift, PostgreSQL, or ClickHouse. With Querio, you can query metrics in plain English, define GMV, take rate, and cohort formulas just once, and reuse them across dashboards, reports, and ad hoc analyses.
Kick off your unlimited free trial today. Discover how self-service analytics can empower your team to make faster, data-driven decisions - without the need for a dedicated data specialist.
FAQs
What’s the simplest way to define GMV for my marketplace?
GMV, or Gross Merchandise Value, represents the total dollar amount of all goods or services sold via your platform within a specific timeframe, such as a month or a quarter. It’s a simple yet powerful way to gauge the overall transaction volume and track growth in your marketplace.
How do I calculate take rate correctly with refunds and chargebacks?
To determine the take rate precisely, start by removing refunds, cancellations, and chargebacks from the total transaction value. Once you have the net transaction value, divide the platform's fee revenue by this amount. Finally, multiply the result by 100. This method ensures the take rate represents the revenue earned solely from finalized transactions, adhering to standard industry practices.
How can I build accurate customer cohorts if my data is spread across tools?
To build precise customer cohorts even when data is scattered, it’s essential to standardize definitions and establish a process that can be repeated. Start by consolidating your data sources using platforms like Snowflake or BigQuery. Next, create consistent metrics by leveraging a semantic layer such as dbt. Finally, offer self-serve dashboards featuring certified data, so your team can explore and analyze cohorts without needing SQL expertise. This approach promotes consistency and makes scaling your analysis much easier.
Related Blog Posts


