Business Intelligence
How fintech startups use AI to replace weekly analyst reporting
How AI automates weekly analyst reports for fintech—cuts errors, speeds reporting, and delivers real-time insights for better decisions.
Fintech startups are turning to AI to replace time-consuming, error-prone weekly analyst reporting. Manual processes like gathering data from CRMs, ERPs, or Google Analytics take hours, strain resources, and lead to high error rates - up to 12%. AI platforms like Querio streamline this by automating data collection, analysis, and reporting, saving time, reducing errors, and improving decision-making.
Key takeaways:
Time savings: AI cuts reporting time from hours to minutes.
Accuracy boost: Error rates drop by up to 90%.
Efficiency gains: Teams focus on solving problems, not compiling data.
Real-time insights: Continuous monitoring flags issues as they arise.
For example, Cotera's VP of Sales reduced a 2.5-hour task to 20 minutes, improving forecast accuracy from 65% to 81%. AI-driven reporting is reshaping how fintech teams operate, delivering sharper insights and faster decisions.
AI in FP&A: From Raw Data to Reporting Automation
AI Use Cases for Fintech Reporting
Fintech startups are taking advantage of AI to reshape reporting processes, turning manual weekly tasks into seamless, automated workflows. By implementing AI, these companies can generate continuous, actionable insights without delays caused by traditional reporting methods. From financial statement creation to market sentiment analysis, AI is proving to be a game-changer in the world of fintech reporting.
Automated Financial Report Generation
AI platforms connect directly to data warehouses like Snowflake and BigQuery, pulling in real-time numbers without the need for manual exports. Using Natural Language Generation (NLG), this data is transformed into easy-to-understand narratives that explain not just the numbers, but the reasons behind them.
Take BPCE, France’s second-largest banking group, as an example. In 2022, they partnered with Yseop to automate mortgage monitoring. Within just eight weeks, they were able to produce 30 detailed reports - an impressive leap from their previous single group-level report [4]. BPCE’s COO, Olivier Irisson, highlighted the importance of this innovation:
Natural Language Generation allows us to model human expertise. For me, this is absolutely key. [4]
Another success story comes from a global banking group that used Yseop’s "Augmented Financial Analyst" to automate 25% of its credit review writing process. This saved 30 minutes per analysis for 200 analysts who collectively produce 16,000 reports annually [4]. The difference? AI systems automatically refresh financial models and generate real-time breakdowns - like dissecting gross margin changes into Price, Volume, and Mix components - before analysts even log in for the day [6].
Market Analysis Using Natural Language Processing
Natural Language Processing (NLP) goes beyond just creating reports. It extracts valuable insights from unstructured data, uncovering information that analysts might never have time to review manually. For instance, machine learning models can scan thousands of documents to extract metrics like revenue, EBITDA, and cash flow with an accuracy rate of 99.2% [7]. These models also perform sentiment analysis on management commentary and earnings filings, identifying subtle shifts in tone that could indicate confidence - or potential risks.
What sets NLP apart is its ability to provide context. Large Language Models can distinguish between recurring and one-time items, while also pulling forward-looking guidance from management statements. One Stanford study revealed that an AI analyst outperformed 93% of fund managers, generating $17.1 million in quarterly alpha through predictive optimizations [7]. For fintech startups, this means AI can flag emerging trends - like shifts in customer sentiment - without requiring analysts to sift through countless sources.
Anomaly Detection and Expense Classification
AI doesn’t just analyze market trends - it also identifies anomalies and simplifies expense classification. By monitoring transactions around the clock, AI systems can flag irregularities immediately, rather than waiting for month-end reviews. These tools consolidate data from multiple ERPs and sub-ledgers, normalize account codes, and match transactions to identify missing entries or mismatches [8]. Businesses using AI have reported a 90% reduction in data errors, with finance teams spending 20–30% less time processing data [8].
This approach has tangible benefits in fraud prevention and cost management. For example, one global servicer saved $1 million in fraud prevention over 12 months by analyzing over $5 billion in transactions with AI tools [5]. When it comes to expense classification, AI models can pinpoint contract leakage and misallocated costs that manual reviews might overlook. Instead of discovering budget variances weeks later, finance teams now receive real-time alerts when spending patterns deviate from expectations [2].
Predictive Analytics for Trend Forecasting
AI models excel at analyzing historical data to predict financial trends and customer behavior with unmatched accuracy. By shifting variance reporting from a backward-looking exercise to a real-time process, AI reduces the time needed for analysis from days to just hours - or even minutes [6].
For fintech startups, this means identifying potential issues early enough to take corrective action. The move toward "touchless forecasting" is already gaining traction, with AI-driven demand prediction expected to significantly reduce manual inputs by 2030 [8]. With AI handling routine variance explanations, finance teams can focus on strategic decisions, like adjusting pricing or reallocating resources, ensuring they stay ahead in a competitive market [2].
How to Implement Querio for AI-Driven Reporting
Querio makes it easy to automate your reporting without needing to overhaul your existing data systems. By connecting directly to your current data warehouse, it eliminates the need to move or duplicate data. Most startups can complete the implementation in under a week by following these five steps.
Connect Querio to Your Data Warehouse
Start by establishing a secure, read-only connection to your data warehouse. Querio supports popular systems like Snowflake, BigQuery, Amazon Redshift, ClickHouse, and PostgreSQL, ensuring compatibility with most fintech setups. To connect, navigate to "Connections" in Settings and select "New Connection." You’ll need details like your warehouse account URL, database name, schema, and a role with read-only permissions, typically authenticated via OAuth or key-pair methods.
The setup usually takes 10 to 15 minutes [11]. Querio ensures security by using encrypted, read-only access, so your data remains in your warehouse [11]. To save time, focus on connecting a single schema relevant to your weekly reporting needs rather than linking your entire warehouse. This targeted approach streamlines initial setup while allowing you to start automating key reports right away.
Define Metrics with Querio's Context Layer
Once connected, the next step is to create your Context Layer. This is where you define metrics, joins, and business logic in one place, ensuring consistency across all reports. For example, you can standardize calculations for metrics like "Weekly Active Users" with SQL queries:
Or define "Net Revenue" as gross revenue minus refunds, filtered for USD transactions. For churn rate, you might use:
The Context Layer ensures accuracy and consistency, with Querio reporting that 85% of users achieve query accuracy above 95% after setting it up [13]. Core metrics typically take one to two hours to define [12], and you can add synonyms (e.g., "revenue" = "sales" = "income") to improve how the AI interprets natural language questions.
Use AI Agents for Query Automation
With your Context Layer in place, Querio’s AI agents handle query automation. These agents convert plain-English questions into SQL or Python code, making it easy to generate insights. For instance, you can ask, "Show weekly revenue trends by product category for the last 4 weeks in USD", and the agent will create the query and display results like $1,234,567.89. For anomaly detection, you can ask, "What expense report anomalies occurred last week?" and receive a script that flags outliers exceeding a 15% variance.
The AI agents learn from your Context Layer, ensuring all answers align with your business logic. After providing 5 to 10 example question-answer pairs, most teams see accuracy rates above 90% [13]. This self-service capability allows analysts to access data without writing SQL, and Querio benchmarks indicate that 80% of queries can be resolved without manual intervention [10]. This dramatically reduces the time spent on query writing, speeding up the process of turning questions into actionable insights.
Build Analysis with Reactive Notebooks
For more complex analyses, Querio’s Reactive Notebooks combine SQL and Python in an interactive environment. These notebooks automatically update when source data or logic changes. For example, to forecast trends, you can query base data using SQL and then calculate rolling averages in Python:
Any updates to your SQL query will refresh Python calculations and visualizations downstream. Fintech teams use these notebooks to create custom metrics like ARPU (Average Revenue Per User) forecasts or expense classification models that stay current with warehouse data. This approach cuts down manual Excel work by 70% compared to traditional methods [10]. Notebooks can also be scheduled to run automatically, ensuring updated reports are ready for weekly meetings. With less time spent on repetitive tasks, teams can focus on deeper, strategic analysis.
Automate Report Delivery with Dashboards and APIs
Finally, automate report delivery to keep stakeholders informed without manual effort. Create dashboards by dragging key metrics from your Context Layer - such as revenue charts, anomaly tables, or transaction volumes - and schedule them to run automatically, for example, every Monday at 9:00 AM ET. Querio can send these reports as PDFs or CSVs via email or post updates directly to Slack or Microsoft Teams.
For more integration options, Querio provides REST APIs and iframe embeds, allowing you to include live dashboards in other tools. One fintech startup used this approach to automate over 50 weekly reports, cutting delivery time from 12 hours to just 5 minutes while ensuring all currency values displayed correctly in USD [10]. By automating reporting workflows, analysts can shift their focus from assembling reports to uncovering deeper insights.
Examples of AI in Fintech Reporting
These examples highlight how AI-powered reporting is reshaping areas like expense automation, market insights, and weekly performance tracking in the fintech sector.
Expense Automation at Scale
In 2025, Global-Tech Manufacturing, a mid-sized company, revolutionized its financial reporting by integrating AI-driven automation. Using Intelligent Document Processing (IDP) alongside AI-enhanced reporting, the company slashed processing costs by 75% and cut invoice processing time from 10 days to less than 24 hours - a staggering 90% improvement. On top of that, the error rate in accounts payable plummeted from 8% with manual methods to under 0.5% with AI automation [14]. This transformation freed up the finance team to focus on strategic tasks rather than repetitive data entry.
But the benefits of AI in fintech reporting don’t stop at cost savings and error reduction. It’s also making waves in how financial institutions generate market insights.
AI-Driven Market Insights for Financial Institutions
AI is helping financial institutions turn overwhelming amounts of data into actionable insights. A financial planning firm in the UK, for example, adopted a custom-built Digital Assistant for monthly income reporting in 2025. The results were impressive: the firm saved $388,000 annually in labor costs, reassigned 10 full-time employees to more impactful roles, and achieved flawless reporting accuracy [15]. This AI system used natural language processing to analyze market trends and client portfolios, automating a process that previously required hours of manual effort. With this added efficiency, financial advisors could spend more time building stronger client relationships while ensuring error-free communication.
Weekly Reporting Automation with Querio
Cotera took a leap forward by automating its weekly reporting process with Querio, replacing tedious Monday spreadsheet routines. The switch saved the company 120 hours annually and improved forecast accuracy from 65% to 81% [1]. Marcus, Cotera’s VP of Sales, shared the impact:
I used to spend two hours finding the problems. Now I spend that time fixing them [1].
By automating data extraction, Querio shifted the focus from reactive reporting to proactive problem-solving. Teams could now identify revenue trends and address pipeline issues before they escalated.
These examples illustrate how AI-driven reporting not only reduces operational burdens but also empowers fintech teams to prioritize strategic decisions and stay ahead of challenges.
Manual vs AI-Driven Reporting Comparison
Manual vs AI-Driven Reporting: Time, Accuracy, and Efficiency Comparison
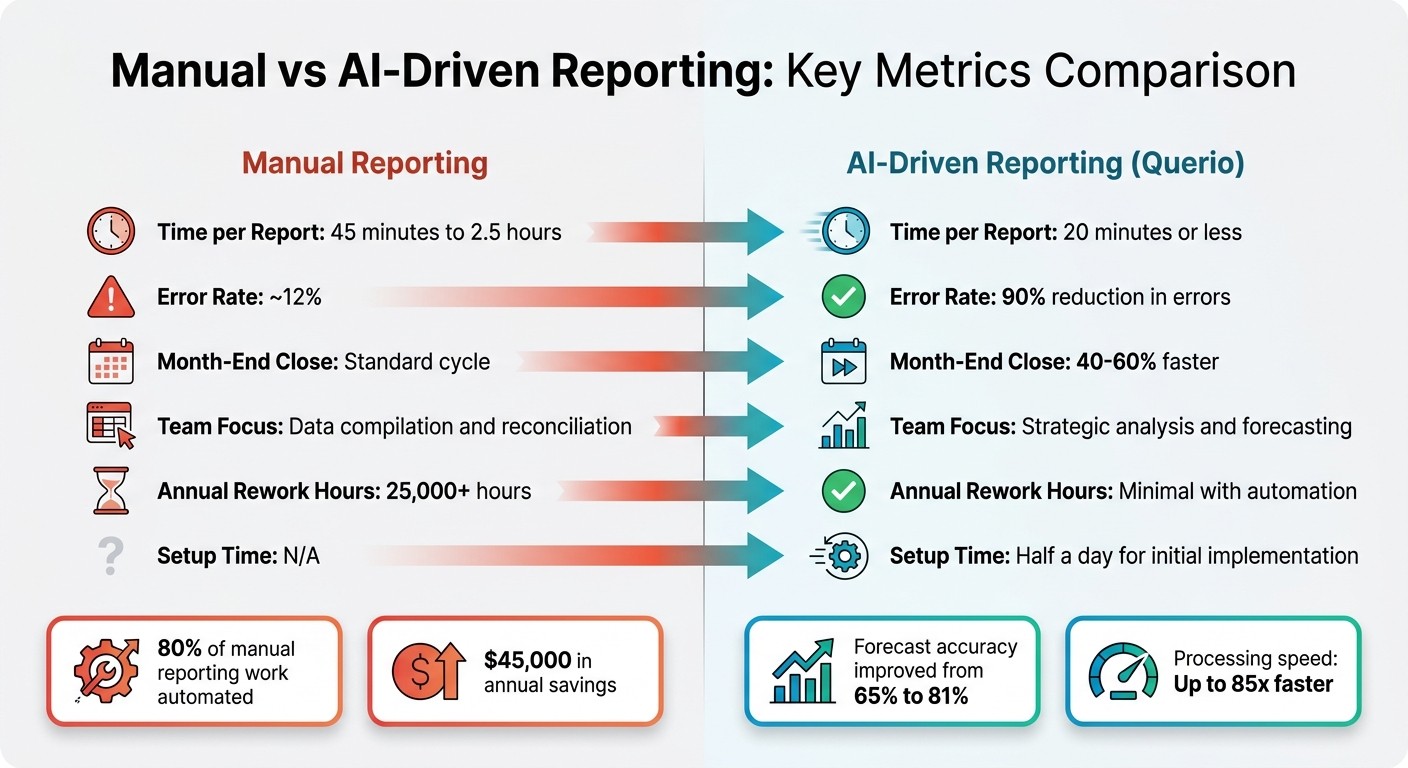
Switching from manual to AI-driven reporting does more than just save time - it allows teams to focus on strategic analysis and forecasting instead of repetitive tasks. Take Marcus, the VP of Sales at Cotera, for example. In March 2026, he replaced his manual spreadsheets with AI-generated reports. This change cut his Monday morning routine from 2.5 hours to just 20 minutes and increased forecast accuracy from 65% to 81% by incorporating more variables into the analysis [1].
The difference in error rates is another standout advantage. Manual reporting often has an error rate of around 12% [9] [3]. AI-driven reporting, on the other hand, slashes errors by up to 90% [9]. For instance, a fintech startup with 20–100 employees was spending $50,000 annually to fix mistakes in manual reports. After they introduced AI agents in late 2025, they processed over 200 reports in their first week with significantly improved accuracy [3].
Speed is another area where AI-driven workflows excel. Financial processes can be completed up to 85 times faster, and month-end close cycles are typically shortened by 40–60% [9]. These faster workflows, combined with fewer human errors, save finance departments an estimated 25,000 rework hours annually [16].
Here’s a breakdown of how the two approaches compare across key metrics:
Comparison Table: Key Metrics
Metric | Manual Reporting | AI-Driven Reporting (Querio) |
|---|---|---|
Time per Report | 20 minutes or less [1] | |
Error Rate | 90% reduction in errors [9] | |
Month-End Close | Standard cycle | 40–60% faster [9] |
Team Focus | Data compilation and reconciliation [9] | Strategic analysis and forecasting [9] |
Annual Rework Hours | 25,000+ hours [16] | Minimal with automation [16] |
Setup Time | N/A | Half a day for initial implementation [3] |
Conclusion
Switching to AI-driven reporting is reshaping how fintech teams operate by freeing up valuable time. Instead of spending hours on repetitive data tasks, analysts can focus on solving critical problems. For example, saving 10 hours per week on manual data prep means more time spent addressing challenges rather than just identifying them [17].
The results are hard to ignore. Querio can automate as much as 80% of manual reporting work, transforming tasks that used to take hours into ones completed in minutes. This efficiency translates to $45,000 in annual savings and eliminates countless hours of rework for fintech startups on the rise. Plus, with unlimited viewer licenses, your whole team gets access to live, actionable insights - without higher costs or the need to expand your workforce.
In today’s fast-paced fintech world, waiting 14 days for a monthly close or relying on outdated spreadsheets just doesn’t cut it. AI-driven reporting gets rid of the "reporting tax" - those wasted hours spent preparing outdated spreadsheets. Instead, it instantly transforms raw data into meaningful insights, allowing teams to catch and address problems mid-quarter when there’s still time to make a difference [2]. This shift not only saves time but also enhances the depth and impact of strategic analysis.
Key Takeaways for Fintech Teams
To make the most of AI-driven reporting, fintech teams can take a few practical steps:
Start with high-impact reports like weekly revenue summaries or monthly P&L statements before tackling more advanced analyses [9][17].
Build a semantic layer early on. By defining metrics like "revenue" or "CAC" in Querio’s context layer, you ensure every report uses consistent and trusted data, avoiding confusion caused by conflicting "shadow metrics."
Roll out the system in phases. Begin with trained power users who can validate AI-generated insights, then expand access across the team.
Use reactive notebooks that update automatically, instead of static reports that quickly become outdated.
With tools like SOC 2 Type II compliance, role-based access controls, and transparent SQL/Python code generation, Querio ensures your data stays secure and auditable as your organization grows. This approach helps fintech teams not only save time but also scale smarter.
FAQs
What data sources can Querio connect to for reporting?
Querio integrates directly with live data sources such as Snowflake and BigQuery, enabling access to real-time insights. This connection ensures data remains accurate and up-to-date, making it easier to trust the information at hand. By simplifying reporting processes, Querio not only saves time but also ensures the reliability and precision of your data analysis.
How do we keep AI-generated metrics consistent across teams?
Consistency in AI-generated metrics is crucial for making informed decisions across teams. Here’s how you can achieve it:
Standardize Processes: Establish clear procedures for collecting, analyzing, and reporting data. This ensures everyone follows the same steps, reducing discrepancies.
Centralized Knowledge Repository: Use a shared repository to align key metrics and provide business context. This keeps everyone on the same page and minimizes confusion.
Automate Reporting: Automating report generation with shared data sources helps eliminate variability and ensures uniformity in the information presented.
Regular Calibration: Frequently review and adjust AI outputs to ensure accuracy and relevance. Calibration keeps the system aligned with your goals.
Clear Guidelines and Training: Equip teams with detailed guidelines and training. This ensures they understand how to interpret and use the data consistently.
By implementing these steps, teams can rely on consistent, trustworthy data for their decision-making processes.
How can we validate and audit AI-generated SQL and reports?
To ensure the accuracy and reliability of AI-generated SQL and reports, it's crucial to adopt a governance-first approach. This means implementing role-based access controls (RBAC) to manage who can access and modify data, along with automated compliance checks to meet regulatory requirements. Detailed audit trails are another key component, as they allow you to track every interaction with the data.
It's also important to regularly monitor compliance with regulations such as GDPR and HIPAA to maintain data integrity. Using natural language queries can further simplify enforcing security policies, ensuring that reports remain trustworthy, transparent, and aligned with regulatory standards.
Related Blog Posts


