Business Intelligence
The 9 Best Slack Analytics Bots & Data Assistants
Pick the right Slack analytics approach—live warehouse Q&A, governed BI, or KPI alerts—for consistent, auditable answers in Slack.

If you want answers in Slack, start by picking the right job: live data Q&A, governed BI reporting, or alerts. This list covers 9 tools that fall into those three groups, and the split matters more than the feature count.
Here’s the short version:
- For live warehouse Q&A in Slack, I’d look at Querio, Dot, Databricks Genie, and Sigma Analysis Assistant
- For governed BI answers in Slack, I’d look at Looker and, in a different way, Slack AI for workspace context
- For alerts and KPI push updates, I’d look at Geckoboard and Grafana
- Compass is hard to judge because public product details are thin
The big filter is simple: where does the answer come from?
If it comes from Snowflake, BigQuery, Redshift, Postgres, or Databricks, you need a tool that can query live data and show how it got the answer. If it comes from a BI model, you need a tool tied to that model. If you just want updates in a channel, alerting tools are enough.
A few facts stand out fast:
- Querio starts at $500/month
- Dot starts at $180/month
- Looker often lands around $5,000 to $100,000+ per year
- Grafana OSS is free
- Databricks Genie is tied to Databricks consumption
- Geckoboard is built more for KPI sharing than Slack Q&A
Building an LLM powered Analytics Slack Bot @ Twitch
::: @iframe https://www.youtube.com/embed/9fUcnuDrwYU :::
Quick Comparison
::: @figure 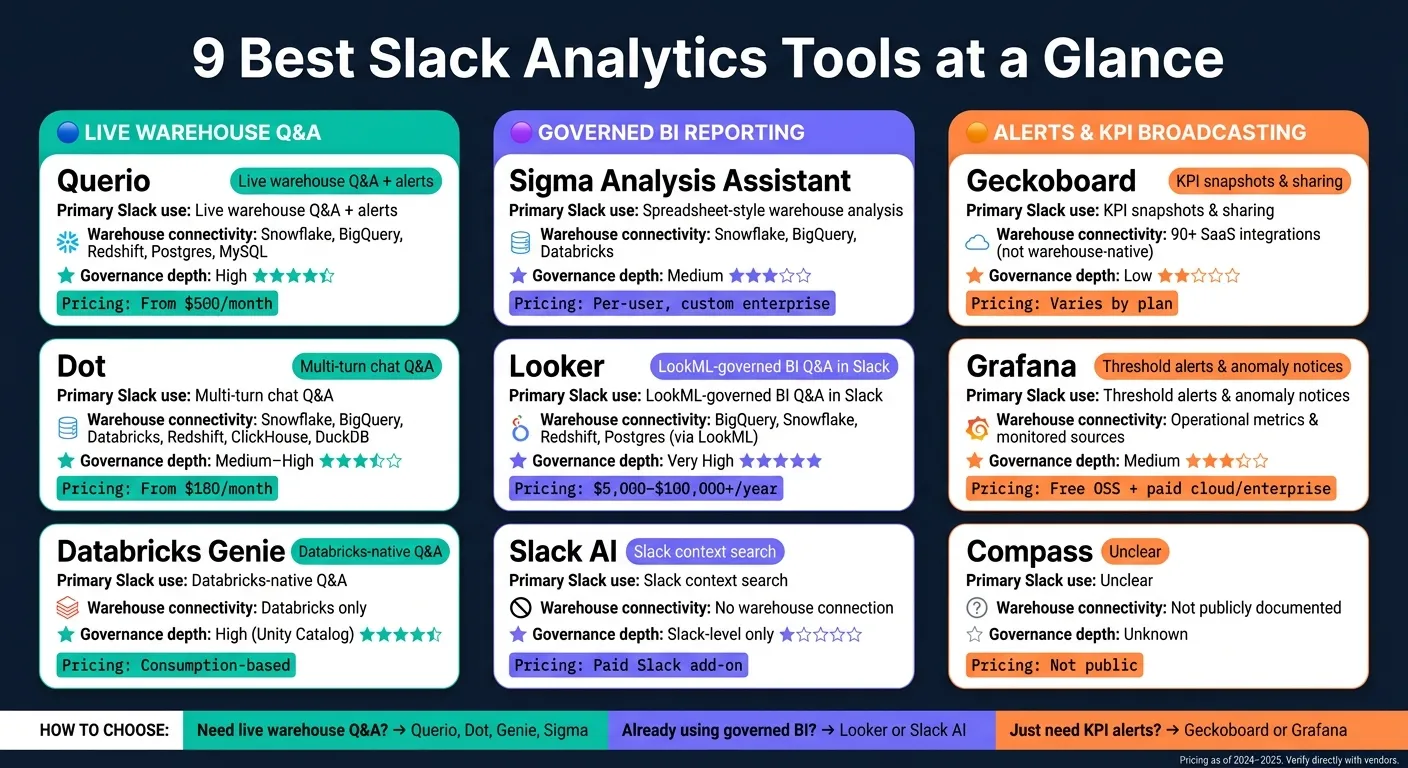 {9 Best Slack Analytics Tools Compared: Features, Pricing & Use Cases}
:::
{9 Best Slack Analytics Tools Compared: Features, Pricing & Use Cases}
:::
| Tool | Main use in Slack | Live warehouse data | Governance depth | Pricing snapshot |
|---|---|---|---|---|
| Querio | Q&A, follow-up analysis, alerts | Yes | High | From $500/month |
| Compass | Unclear | Unclear | Unclear | Not public |
| Dot | conversational AI data analyst capabilities | Yes | Medium to high, depends on your stack | From $180/month |
| Slack AI | Search messages, threads, files | No | Slack-level permissions, no metric layer | Paid Slack add-on |
| Sigma Analysis Assistant | Warehouse analysis with AI help | Yes | Medium | Per-user, custom enterprise |
| Geckoboard | KPI snapshots and sharing | Usually no direct warehouse focus | Low | Varies by plan |
| Looker | BI-based Q&A in Slack | Yes, through LookML | High | $5,000 to $100,000+ per year |
| Databricks Genie | Databricks Q&A | Yes, Databricks only | High inside Databricks | Consumption-based |
| Grafana | Alerts and anomaly notices | Yes, for monitored sources | Medium | Free OSS + paid cloud/enterprise |
If I were narrowing this list fast, I’d use three questions:
- Do you need open-ended natural language BI or just alerts?
- Do you already have governed metric definitions in dbt, LookML, or Unity Catalog?
- Do you need visible SQL and channel-level data limits?
That gets you to the right short list without getting lost in feature pages.
1. Querio
Querio is a warehouse-native Slack analytics platform built for teams that want governed answers from live warehouse data. It connects straight to your data warehouse and answers plain-English questions with inspectable SQL and Python. Every answer is traceable and auditable.
Data connectivity
Querio keeps live, read-only, encrypted connections to Snowflake, BigQuery, Redshift, Postgres, MySQL, and other supported databases [1][6]. That means no CSV exports and no data extracts. People in Slack get answers pulled from current warehouse data.
Slack Q&A and alerts
Here’s what that looks like in practice. If someone in Slack asks about net new ARR last month by segment, Querio writes SQL, runs it against the warehouse, and returns a chart plus a written answer right inside the thread. The result also opens in a reactive notebook in Querio, so an analyst can inspect the SQL and Python and keep going from there [1][4].
Querio also supports Slack automations. You can schedule a daily business health check to watch revenue, margin, or marketing efficiency. If a threshold breaks, the agent investigates the root cause and posts its findings to the right Slack channel [1][4].
Governance and permissions
This is where Querio starts to matter for shared metrics, not just one-off answers. Querio's Git-synced governed context layer stores metric definitions, joins, and trusted queries as SQL, Markdown, and Python in the same GitHub repo as your dbt project [6][7]. Only a logged-in human can approve and commit changes. So the answers people see in Slack stay lined up with the same metric definitions your data team signs off on in dbt and GitHub.
Channel-level access control lets admins limit which data each Slack channel can query [1][5]. Conversations are private by default. Querio is SOC 2 Type II certified and supports HIPAA compliance with BAAs [6].
Setup and pricing
Querio does not handle ingestion or transformation, so it makes the most sense for teams that already use tools like Fivetran and dbt [1][3]. If your warehouse and pipeline are already set up, onboarding is pretty straightforward.
| Plan | Price | Users | Notes |
|---|---|---|---|
| Starter | $500/month [6] | Up to 10 | Slack Q&A and live connections |
| Core | $1,999/month ($1,699/month billed annually) [6] | Unlimited | Git-synced context, Python notebooks, guided onboarding, 3 data connections |
| Enterprise | Custom [6] | Unlimited | Self-hosting, physical data separation, custom deployments |
AI usage is included, with no per-question charges. There’s also a free trial and a money-back guarantee, plus optional billing hard caps that can stop usage at the set limit [6]. For teams already running Snowflake, BigQuery, Redshift, Postgres, or MySQL, Querio gives them a way to bring self-serve analytics into Slack without giving up control over metrics.
2. Compass
Public documentation for Compass is very limited, which makes it hard to check how its Slack analytics workflow works, whether it connects to a warehouse, or how its governance model is set up.
Right now, its warehouse connections, natural language interfaces for data and Slack Q&A behavior, alerts, permissions, and pricing are not publicly documented. That means teams should verify fit with Compass directly before using it for executive reporting or self-serve metric access.
This gap in documentation also makes Compass tougher to assess for Slack-native analytics use cases, especially areas like governed reporting, alerts, and self-serve access. For buyers who need documented Slack analytics behavior, direct evaluation isn't optional - it's the only clear path.
3. Dot
Dot is a documented warehouse-native analyst built for teams that want Slack questions answered from live data. It connects straight to Snowflake, BigQuery, Databricks, Redshift, Postgres, ClickHouse, and DuckDB, then queries live warehouse data directly.[1]
Data Connectivity and Q&A
Dot turns plain-English questions into SQL and returns either narrative answers or charts right inside Slack. That means a team can ask for numbers in the same place where work is already happening, instead of bouncing between tools.
It also supports multi-turn conversations, so follow-up questions in the same thread keep the context from the first request. In practice, that makes it feel less like running one-off queries and more like talking through a problem step by step. Dot is an analyst layer only, so it sits on top of your current ingestion, transformation, and modeling setup.[1]
Governance and Permissions
Dot keeps Slack questions scoped to approved data through channel-level access. You can limit which Slack channels can reach certain data or metrics, which helps teams avoid the all-access, all-the-time problem that can get messy fast.
It also relies on your existing semantic layer for metric definitions. So if your team already has agreed-upon definitions in place, Dot uses those rather than creating a separate logic system.[1]
Setup and Pricing
Setup is straightforward if your data stack is already mature. Dot is designed to sit on top of an existing warehouse and data pipeline, not replace them.[1]
Pricing is usage-based, with unlimited users on paid tiers:
- Pro: $180/month
- Team: $720/month
- Enterprise: Custom pricing[1]
4. Slack AI
Slack AI works best when you need context from Slack, not when you need to query live warehouse metrics. It helps teams search conversations, threads, and files, but it isn't a warehouse-native analytics tool. So it’s handy for background and past discussions, but not a strong fit for digging into live KPIs.
Data Connectivity
Slack AI searches messages, threads, and connected content from tools like Google Drive, Notion, and Confluence. It does not connect directly to Snowflake or BigQuery. [1]
Governance and Permissions
Slack AI uses Slack's enterprise security model and does not train on customer data. But it does not include a governed semantic layer, which means the same metric question can produce different answers. [1]
Setup and Pricing
Setup is minimal since Slack AI works with content already in your workspace. It’s a paid add-on for Pro, Business+, and Enterprise Grid plans. [1]
Its value is search, not metric computation.
5. Sigma Analysis Assistant
Slack search can help you find past messages and bits of context. Sigma goes a different way. It keeps the work tied to live warehouse analysis, which makes it a strong fit for teams that already work in Sigma and like a spreadsheet-style BI setup. If your team wants a pure chat-in-Slack setup, though, Sigma feels less natural.
Data Connectivity
Sigma connects directly to Snowflake, BigQuery, and Databricks and queries live warehouse data.[2] That works well for teams that have already picked one of those warehouses as the center of their data stack.
That base is a big deal. Sigma's AI works straight from those live tables and models, so you're not dealing with stale exports or one-off CSVs sitting in someone's Downloads folder.
Slack Q&A and Alerts
Sigma's AI can use text-to-SQL query tools to turn plain-English questions into queries and then return spreadsheet-style analysis on warehouse data.[2] In practice, that makes it better for guided analysis than for casual Slack chat.
If you need a tool for digging into numbers, tracing changes, and working through follow-up questions, Sigma has a clear lane. The main thing to watch is how much control you want over the flow from question to answer.
Governance and Permissions
Because Sigma queries the warehouse directly, it stays close to the source. It also supports collaborative workbooks with real-time co-editing.[2]
That setup can help teams avoid the usual mess where one person is looking at an old dashboard and someone else is using a different export.
Setup and Pricing
Sigma works best when your data already lives in a supported cloud warehouse. Pricing is per user, with enterprise plans available on request.[2]
6. Geckoboard
If your goal is visibility, not deep investigation, Geckoboard is a strong fit. It’s a KPI broadcasting tool, not a conversational analytics assistant.
Data Connectivity
Geckoboard connects to 90+ SaaS integrations, including tools like Zendesk, Shopify, and HubSpot [8]. It is not warehouse-native. So if your data sits in Snowflake, BigQuery, Redshift, or Postgres, you’ll usually need to prep it somewhere else before Geckoboard can show it [8].
That makes Geckoboard a better fit for operational dashboards than warehouse-native analytics. Think of it as a screen for your numbers, not the place where deep analysis happens.
Slack Alerts and Sharing
Geckoboard can push KPI snapshots into Slack and share links, but it does not support natural-language questions or root-cause analysis [8]. In plain English: it helps teams see the numbers in Slack, but it won’t help them dig into why a number changed.
Use it when you want KPI distribution in Slack, not interactive analysis.
Governance and Setup
Geckoboard has no semantic layer, so metric definitions need to be prepared upstream [8]. Setup is fast, but the tradeoff is limited analysis depth [8].
For teams that need more than static KPI delivery, the next tools go deeper on analysis and governance.
7. Looker
Looker fits the governed BI-to-Slack camp. It works best when Slack questions need to stay tied to a LookML model. In plain terms, this is a BI platform first, with Slack Q&A added on top. It makes the most sense when your metrics are already defined in LookML.
Data Connectivity
Looker connects to BigQuery, Snowflake, Redshift, and Postgres through LookML, which standardizes metric and dimension definitions.[2]
Slack Q&A
The Looker Agent can answer plain-English questions in Slack using data from the LookML model. That helps keep answers consistent. The tradeoff is simple: if something hasn’t been modeled ahead of time, Looker can’t answer it.[9] Multi-turn analysis in Slack is also more limited than what you get from Slack-native analytics tools.[2]
Governance and Permissions
LookML helps keep reporting consistent, and Looker also includes row-level security and audit-grade access controls. That makes it a strong fit for regulated teams in finance, healthcare, and SaaS reporting.[5][9]
Setup and Pricing
Getting value from Looker usually starts with building the LookML model first, and that often takes 3 to 6 months before AI features become useful.[2] Pricing is custom and typically falls between $5,000 and $100,000+ per year, with Gemini AI features included for existing customers.[2]
Its core strength is governed reporting built on a defined semantic layer, not open-ended exploration in Slack.
8. Databricks Genie
Databricks Genie makes the most sense for teams that already run on the Databricks Lakehouse, especially if they use Unity Catalog. If your team works in Slack and needs governed answers that stay close to the lakehouse, Genie is the Databricks-native pick. In day-to-day use, it works best when questions stay inside Databricks-governed data.
Data Connectivity
Genie is Databricks-only.[7]
Natural-Language Q&A
Genie turns natural-language questions into SQL and queries data where it lives.[7] One setup detail matters a lot: each Genie Space has a limit of about 30 tables, so most teams split Spaces by business domain.[7] That tight scoping tends to improve answer quality, especially when each Space is backed by a mature semantic model.[7]
Governance and Permissions
Genie automatically inherits governance and permissions from Databricks Unity Catalog, so data access stays aligned with current policies.[7] It can also show the generated SQL and the definitions used to produce an answer, which helps with auditing.[7]
Setup and Pricing
Setup is mostly about scoping Genie Spaces by domain.[7] Pricing is consumption-based and bundled with Databricks.[7]
If you need alerting and KPI broadcasting instead of warehouse-native Q&A, the next tool moves from analysis into monitoring.
9. Grafana
If your goal is Slack alerting, Grafana should be on your shortlist. It fits operational monitoring in Slack, not business Q&A. In plain English, Grafana sends threshold alerts and anomaly signals from dashboards you already use straight into Slack channels.
Slack Alerts and Notifications
Grafana’s Slack integration is built for alerting, not for answering questions. When a metric crosses a threshold, Grafana can send a Slack alert with labels, current values, and a direct link to the affected dashboard. If you use Grafana Machine Learning, it can also send proactive anomaly notifications when metrics drift from past patterns. Users can also share panel or dashboard snapshots in Slack.
Use Grafana when the question is “Did something break?” not “Why did revenue change?”
Data Connectivity
Grafana connects to operational metrics and warehouse-connected sources. So it works best when you want to monitor defined metrics, not run ad hoc analysis.
Governance and Setup
Grafana supports folder-level and dashboard-level permissions. RBAC is available in Grafana Enterprise and Grafana Cloud. Setup is pretty simple: connect a webhook or use the Grafana Slack app, set up alert rules, and define notification policies. Most of the work comes later, in keeping dashboards and alert rules up to date.
Pricing
Grafana OSS is free and self-hosted. Grafana Cloud includes a free tier, while paid plans use usage-based pricing for metrics, logs, and traces. Grafana Enterprise adds SSO, advanced RBAC, and data source permissions, and pricing is per instance.
If you need business KPI questions, self-service analytics, or governed access to a data warehouse, Grafana isn’t the right tool. It’s a monitoring tool inside Slack, not a Slack analytics assistant.
Pros and Cons of Each Tool
Here’s the simple truth: these tools don’t all solve the same problem.
Some are built for live business Q&A. Others are better for alerts or Slack search. And the tradeoff shows up fast. The easier a tool is to get running, the less control you usually get over metric logic and answer consistency.
| Tool | Main Advantages | Main Drawbacks | Best Fit |
|---|---|---|---|
| Querio | Governed semantic/context layer; inspectable SQL/Python; live warehouse connections (Snowflake, BigQuery, Redshift, Postgres); SOC 2 Type II and HIPAA | No built-in ingestion or transformation | 100–500-person SaaS, fintech, or healthcare teams with a live warehouse and growing analytics demand - Q&A / self-serve analysis |
| Compass | Not publicly documented | Warehouse connections, Slack Q&A, alerts, and pricing are unverified | Teams should verify fit directly before evaluating for any Slack analytics use case |
| Dot | Slack chat layer on top of an existing dbt/Snowflake stack; multi-turn conversations | No ingestion or transformation; accuracy depends on governed metric definitions already in place [1] | Teams with a polished dbt/Snowflake stack that need a conversational interface - Q&A / self-serve analysis |
| Slack AI | Searches Slack messages, threads, and connected files with minimal setup | No warehouse connection; no semantic layer; same metric question can return different answers [1] | Teams that need Slack context search, not live metric computation |
| Sigma Analysis Assistant | Live warehouse queries; spreadsheet-style analysis familiar to finance teams | Natural-language interface is secondary to the spreadsheet UI; steeper learning curve for non-analysts | Finance and analyst teams comfortable with spreadsheet-style analysis - Q&A / self-serve analysis |
| Geckoboard | Purpose-built for executive KPI broadcasting; simple dashboard display setup; low technical overhead | Not designed for natural-language Q&A or exploratory analysis; limited drill-down [8] | Sales ops, support ops, and leadership teams that need always-on KPI screens - Alerts / KPI broadcasting |
| Looker | Strong LookML semantic layer; enterprise-grade governance; row-level security | Requires significant upfront modeling; expensive for smaller teams [2] | Google Cloud-native teams already invested in LookML - Q&A / self-serve analysis |
| Databricks Genie | Inherits Unity Catalog permissions automatically; warehouse-native Q&A | Limited to ~30 tables per Space; works best inside the Databricks ecosystem [7] | Data teams already running Databricks as their primary platform - Q&A / self-serve analysis |
| Grafana | Purpose-built Slack alerting; threshold and anomaly notifications; free OSS tier | Not designed for business Q&A or self-serve metric access | Ops and engineering teams monitoring defined metrics - Alerts / KPI broadcasting |
What the comparison tells you
A clear pattern shows up here: setup speed and governance depth pull in opposite directions.
If you want to move fast, you’ll usually do less modeling upfront. If you want tighter control over metric logic, permissions, and answer quality, you’ll spend more time setting things up.
That matters a lot in Slack. Why? Because Slack makes asking easy. The hard part is getting the same question to lead to the same answer every time.
If your metric definitions already live in dbt or LookML, answers tend to stay more consistent. Without a semantic layer, a tool can calculate the same metric in different ways, which is where trust starts to slip.
A practical way to narrow your shortlist:
- Start with your warehouse: Snowflake, BigQuery, Redshift, Postgres, Databricks, or no live warehouse at all
- Check how much governance you need: semantic layer, permissions, inspectable SQL, and metric consistency
- Match the tool to the Slack job you care about most: Q&A / self-serve analysis, alerts / KPI broadcasting, or Slack context search
That gets you out of feature-comparison mode and into fit-for-purpose mode, which is usually where the best choice becomes much more obvious.
How to Choose the Right Slack Analytics Tool
After you compare features, cut your shortlist based on the job Slack needs to handle for your team. Don’t pick the tool with the longest feature list. Pick the one that matches how your team actually works.
Use warehouse-native assistants when Slack questions need to query Snowflake, BigQuery, Redshift, or Postgres directly. This setup works best when governance is already in place. Choose this path when answers need to come from live warehouse data.
BI-to-Slack tools make sense for teams that already manage metrics in a governed BI layer such as Looker. In many cases, more complex follow-up questions end up back in the BI app anyway. If your main goal isn’t analysis but visibility, move toward alerting tools instead.
Use alerting tools for scheduled KPIs and anomalies, not open-ended analysis.
Before you buy, ask for proof. Require:
- a full example question
- visible SQL
- governed metric definitions
Ask vendors to walk through one complex question from start to finish. Check that the SQL is visible. Then verify that the metric layer and row-level security live in the warehouse or semantic model.
Querio fits teams that want governed, warehouse-native Slack Q&A with inspectable SQL and Python. If your team already has a live warehouse and governed metrics, that’s the key fit test.
FAQs
::: faq
How do I choose between Slack Q&A and alerts?
Choose based on the job: Slack Q&A works best for reactive, ad hoc investigation, while alerts work best for automated monitoring.
A lot of teams use both. Q&A helps people dig into an issue when something comes up. Alerts flag metric shifts, anomalies, or KPIs on their own. In Querio, a governed semantic layer helps keep definitions and results consistent across both. :::
::: faq
What governance features matter most in Slack analytics?
The features that matter most are read-only access by default, strict row-level security (RLS) enforced in the backend, and clear scoping for approved tables and columns. That way, if a UI filter is missing, sensitive data still doesn’t leak.
Teams also need audit logs for every query, clear visibility into lineage and metric assumptions, and governed shared metric definitions through a semantic or context layer so "revenue" means the same thing for everyone. :::
::: faq
Can Slack analytics tools answer from live warehouse data?
Yes. Many Slack analytics tools answer questions straight from live warehouse data instead of leaning on static snapshots or uploaded CSVs.
They connect to systems like Snowflake, BigQuery, Databricks, Redshift, or Postgres, run SQL when you ask a question in Slack, and send the result back there. That keeps metrics current while still supporting governance and auditability. :::