Business Intelligence
8 Best Data Chat Tools for Non-Technical Teams
Choose the data chat tool that delivers trustworthy, governed answers inside the workflow your team already uses.

If you want plain-English answers from warehouse data, I’d narrow the list to 8 tools: Querio, ThoughtSpot, Looker, Power BI, Tableau, Sigma, Hex, and Metabase. The main buying test is simple: can your team ask a question, see how the answer was built, and use it in Slack, Teams, or another tool they already open every day?
Here’s the short version:
- Querio: best if you want chat in Slack or Microsoft Teams with visible SQL and notebooks
- ThoughtSpot: best for search-style BI in a separate app, but setup can take 3 to 6 months
- Looker: best for strict metric control, but it needs data team time
- Power BI: best for Microsoft shops; Copilot can push cost to about $6,400/month
- Tableau: best for polished dashboards and leadership reporting
- Sigma: best for spreadsheet-first teams on live warehouse data
- Hex: best for analyst-built apps, not broad self-serve chat
- Metabase: best low-cost starting point for internal BI
I’d judge each one on four things:
- Answer trust: can users inspect SQL or logic?
- Governance fit: are metrics controlled in one place?
- Stack fit: does it connect to Snowflake, BigQuery, Redshift, or Postgres?
- Workflow fit: does it work where your team already works?
Quick Comparison
| Tool | Best for | Main interface | Starting price |
|---|---|---|---|
| Querio | Slack/Teams data chat | Chat + notebook | Free plan; Core $2,499/mo |
| ThoughtSpot | Search-based BI | Search bar | $25/user/month |
| Looker | Central metric control | Explores | Quote-based |
| Power BI | Microsoft teams | Dashboards + Copilot | $14/user/month |
| Tableau | Executive dashboards | Visual dashboards | $75/user/month |
| Sigma | Spreadsheet users | Workbook | Quote-based |
| Hex | Analyst-led apps | Notebook | $36/editor/month |
| Metabase | Fast internal BI | Dashboards | Free + paid tiers |
If I were choosing fast, I’d start with workflow fit first, then check governance and pricing.
::: @figure 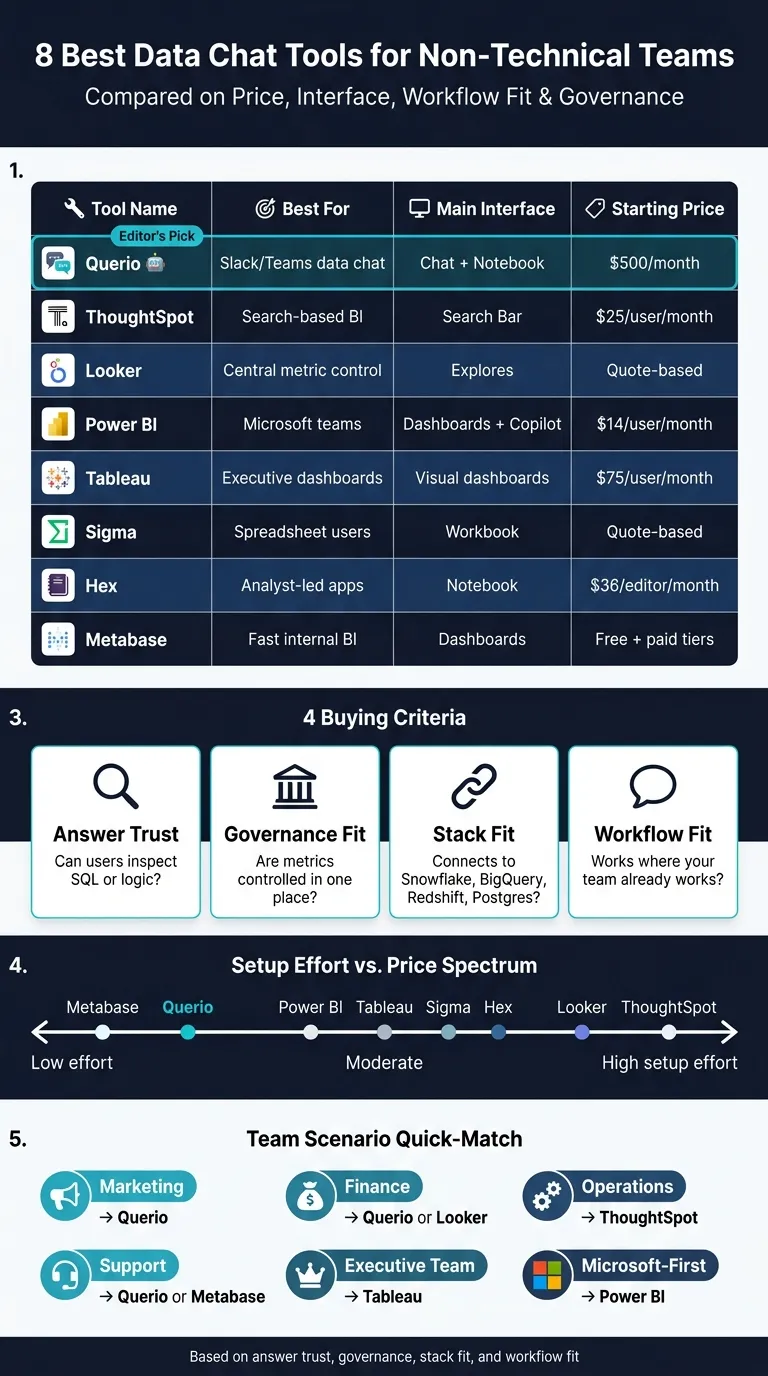 {8 Best Data Chat Tools for Non-Technical Teams: Side-by-Side Comparison}
:::
{8 Best Data Chat Tools for Non-Technical Teams: Side-by-Side Comparison}
:::
1. Querio
Querio lets business users ask questions in Slack and get answers from live warehouse data, with inspectable code behind every result.[7]
Answer trust
Each answer Querio returns is backed by real, readable SQL and Python. That code is stored in a notebook tied to the answer, so you can open it and see exactly what happened behind the scenes. Questions asked in Slack create that same notebook too, which gives each answer a clear audit trail.[7]
"Highly transparent because every AI answer is backed by verifiable code. Drastically reduces the workload on human analysts." - Dhananjay Goel, Founder and CEO, Enlight Lab [7]
Governance fit
For non-technical teams, trust often comes down to one thing: everyone needs to work from the same metric layer. Querio’s context layer—which functions as a metrics layer vs semantic layer—stores metric definitions, join logic, and business rules as SQL, Markdown, and Python synced to GitHub alongside dbt. The agent can suggest changes, but only a logged-in human can approve and commit them. That helps keep metrics like revenue, active customer, and support numbers aligned across teams.[7]
Stack compatibility
Querio connects live, read-only, to Snowflake, BigQuery, Redshift, Postgres, and other SQL warehouses. There’s no CSV exporting and no data duplication. One catch: the data team has to define the context layer before business users can self-serve.[7]
Team workflow fit
Querio fits best when teams want answers inside the tools they already use. It works in Slack and Microsoft Teams, so marketing, finance, and operations can ask questions without leaving their normal workflow. The reply includes both a chart and the notebook behind it. For example, a marketing manager can check campaign conversion in Slack instead of jumping into another app.[7]
Security includes SOC 2 Type II, RBAC, HIPAA, and SSO.[7]
Querio has a free plan, and the Core plan is $2,499/month, or $25,000 a year billed annually. Every plan includes unlimited users and unlimited data connections.
That’s the baseline for the rest of the comparison: governed answers from live warehouse data, delivered in the tools teams already use.
2. ThoughtSpot
ThoughtSpot is a standalone enterprise BI platform built for non-technical users who want to search governed warehouse data in plain English. It works best for teams that want governed natural-language search in a dedicated BI app, not inside Slack or Teams.
Answer trust
Spotter gives users inspectable SQL or logic across three query modes. Its newer modes also add explainable reasoning and anomaly detection through the SpotIQ engine [3].
Governance fit
ThoughtSpot uses RBAC and a centralized semantic layer. In practice, that means data teams define metrics, field names, and access rules in one place. That layer is what makes search workable for finance, ops, and RevOps.
The catch is setup time. Enterprise deployments usually take 3 to 6 months to get right [3].
Stack compatibility
ThoughtSpot connects live to Snowflake, BigQuery, Redshift, and Databricks. Its ThoughtSpot Everywhere SDK also lets teams embed search and reporting directly into customer-facing SaaS products [4][8].
Team workflow fit
ThoughtSpot is a strong match for executives, RevOps, and product teams that need fast KPI checks, revenue tracking, and anomaly follow-up without SQL. If the goal is to get answers fast from governed data, it does that job well.
The main downside is workflow friction. ThoughtSpot is a separate app with its own login, so users need access and onboarding before they can start using it. That can be a sticking point when adoption depends on whether people will leave their day-to-day tools just to ask a question.
Pricing starts at $25/user/month for Essentials and $50/user/month for Pro. Enterprise contracts usually land between $100,000 and $500,000+ per year [1][3].
Use ThoughtSpot when business users need governed search in a separate BI workspace and can live with heavier setup and onboarding.
3. Looker
Looker is a governance-first platform built around LookML, its proprietary modeling language. In practice, that means data teams set metrics, joins, and business logic in one central layer before anyone starts building charts [7][1]. For non-technical users, that creates a single source of truth instead of a bunch of dashboards all saying slightly different things.
Answer trust
Because the logic sits inside LookML, answers stay consistent and traceable. Gemini adds natural-language questions on top of LookML, but the experience still runs through Explores and guided paths instead of a pure chat interface. So yes, Looker is accurate. But it feels more structured and guided than chat-first tools.
Governance fit
This is where Looker stands out. Its centralized LookML layer, along with SOC 2 Type II compliance and RBAC [5][3], makes it a strong fit for regulated teams in healthcare, finance, and B2B SaaS. If a team cares about control, auditability, and shared logic, Looker checks those boxes.
There’s a tradeoff, though. Keeping LookML in good shape usually takes dedicated analytics engineers, which pushes total cost of ownership higher. In plain English: the control is strong, but the build and upkeep can be heavy.
"Looker forces organizations to define business logic centrally before anyone builds a chart." - Dhananjay Goel, Founder and CEO, Enlight Lab [7]
Stack compatibility
Looker works inside Google Cloud and also supports multi-cloud setups. It connects directly to Snowflake and Databricks [7][1]. Pricing is quote-based.
Team workflow fit
Looker works best for data-mature enterprises that have the people and time to build and maintain a LookML model. Once that model is in place, non-technical users get a governed and steady self-serve experience. But that doesn’t make Looker a true conversational chat tool.
It’s built for governed self-serve analytics, not chat-first use. That makes it a strong match for teams that care more about governance than lightweight chat-style access. The next tool leans more toward ease of use.
4. Power BI
Power BI is a strong fit for Microsoft-first teams already living in Teams, Excel, and Microsoft 365. It tends to work best for finance, operations, and leadership groups that want plain-English answers without leaving Microsoft tools. With Copilot, users can ask a question in everyday language and get DAX-backed answers plus related report pages [2]. But there’s a catch: this only works well when the semantic model is clean and managed from one place.
Answer trust
The quality of the answer comes back to the semantic model. If MRR, churn, and other business logic are defined in one central place, Copilot is more likely to return steady, consistent answers. If those definitions vary across reports or teams, things can get messy fast. Two people can ask the same question and get different results. That’s why the data team needs to lock down definitions before giving Copilot to business users.
Governance fit
Power BI leans on Certified Datasets, or approved semantic models, to keep definitions aligned across finance, operations, and other teams [4].
Stack compatibility
Power BI plays well with Snowflake, BigQuery, Redshift, Postgres, dbt, Excel, and Microsoft 365. It also has native integration with Teams, Office, and Microsoft Fabric [2][1]. At that point, the main buying question is pretty simple: can your team handle Power BI's licensing requirements?
Team workflow fit
Power BI Pro costs $14 per user/month, but Copilot requires Fabric F2 or Premium P1. Full Copilot access needs Fabric F64, which runs about $6,400/month [2][1].
Use Power BI when Microsoft already acts as the day-to-day system for reporting and collaboration. If your team wants a BI workflow that extends further outside the Microsoft world, the next tool goes in a different direction.
5. Tableau
Tableau is a strong pick for teams that want polished, executive-ready dashboards and sharp visual storytelling. Microsoft-first teams often lean toward Power BI. But for presentation-ready dashboards and leadership-facing reporting, Tableau usually has the edge. Its no-code features work best when the data sits on a curated layer.
Answer trust
Tableau Agent and Pulse work best on a semantic layer with clear metric definitions [4].
Governance fit
Tableau supports the Einstein Trust Layer, RBAC, and Row-Level Security (RLS), which makes it a good fit for teams that need controlled access to shared warehouse data [4].
Stack compatibility
Tableau connects to Snowflake, BigQuery, Redshift, and Postgres, and it supports live warehouse queries. It also works well with dbt-based transformation workflows, so it fits neatly into modern warehouse-first stacks [4].
Team workflow fit
Tableau is a good match for leadership KPI reviews and polished reporting. Creator seats start at $75/month. Tableau+ is quote-based and includes advanced natural-language features [4][6].
One thing to watch: costs can climb fast as viewer counts go up [4].
Tableau fits best when executive-ready dashboards matter more than chat-first analysis. The next tool moves closer to workbook-style analysis than presentation-first dashboards.
6. Sigma
Sigma is a spreadsheet-style analytics tool that runs live queries on cloud warehouse data. That makes it a strong fit for finance, operations, and marketing teams that want spreadsheet workflows tied to live data. For non-technical users, Sigma swaps out SQL for workbook-based analysis on top of the warehouse.
Answer trust
Sigma’s big draw is its familiar, grid-based workbook linked to live warehouse data [3][7]. If your team thinks in rows, columns, and formulas, that setup feels natural fast. But Sigma is built more for spreadsheet-first users than chat-first users, and that difference matters when you’re deciding where it belongs on this shortlist.
Governance fit
Sigma’s governance model avoids extracts, which helps teams work from the source instead of scattered copies. Its Input Tables also let users write data back to the warehouse from the workbook, which is useful for governed planning and data entry [3][7].
Stack compatibility
Sigma connects live to Snowflake, BigQuery, and Databricks as part of your modern analytics stack [3].
Team workflow fit
Sigma works well for teams that need real-time co-editing in a workbook that feels familiar from day one [3]. Pricing is per user, while enterprise pricing is quote-based [3].
Sigma tends to fit best with spreadsheet-native teams. The next tool is a better match for people who want a more notebook-driven workflow.
7. Hex
Hex is a collaborative SQL and Python notebook platform built for analyst-led teams that publish interactive data apps for stakeholders. People across the business can use those apps without touching SQL, while analysts stay in control as the main builders.
Answer trust
Business users work from analyst-built apps, not raw SQL. That matters. It means the experience is guided, and the logic behind each app can be checked or edited by analysts in the notebook itself.
Hex is a strong fit for guided analysis. It’s less suited for open-ended self-serve questions, where someone wants to poke around freely and ask follow-up questions on the fly. In many cases, those next questions still need an analyst. That setup also affects governance, since control stays close to the people building the logic.
Governance fit
Hex fits best when analysts own the logic and publish curated apps for stakeholders. At the same time, it still connects straight to live warehouse data.
Stack compatibility
Hex is one of several warehouse-native data analysis tools that connects to Snowflake, BigQuery, Redshift, and Postgres [1].
Team workflow fit
Hex makes sense for teams that want to share analysis with stakeholders, but don’t want every business user working on their own in the data. It’s built more for analyst-led sharing than broad self-serve access.
Pricing is set up to scale with editor seats:
- Professional: $36 per editor per month
- Team: $75 per editor per month
- Paid plans include unlimited viewers [1]
Hex works best when analysts remain the primary builders and business users consume curated apps. That makes it a strong option for analyst-led sharing, while the next tool is a better fit for broader self-serve use.
8. Metabase
Metabase is one of several open source self service BI tools built for fast internal reporting.
Answer trust
Metabase brings together Metabot AI, a guided question builder, and a full SQL editor. That setup lets business users ask questions in plain English while analysts check the logic in SQL [7]. The plain-language layer is useful, but answer quality still depends on how well metric definitions are managed behind the scenes.
Governance fit
Core plans come with basic permissions. Audit logs and granular permissions are limited to enterprise tiers [7].
Stack compatibility
Metabase connects to Snowflake, BigQuery, Redshift, and Postgres, which makes it a good match for warehouse-first stacks [7].
Team workflow fit
Metabase works well for finance, marketing, operations, and support teams that need fast dashboards backed by the warehouse, embedded internal reporting, and simple self-serve analysis.
Pricing is clear: there’s an open-source version, plus enterprise upgrade paths for teams that need audit logs and granular permissions [7].
So if you want something that’s easy to roll out without a lot of friction, Metabase sits on that end of the comparison.
How These 8 Tools Compare on the 4 Factors That Drive the Buying Decision
The right pick comes down to four things: answer trust, governance, stack fit, and workflow fit. For non-technical teams in finance, operations, marketing, and support, those four factors shape almost every buying call. The next four subsections turn them into plain-English tradeoffs.
Answer Trust
The biggest danger isn't always a bad query. It's a correct query tied to the wrong metric definition.
That's where governed metric layers matter. They keep revenue, churn, and other KPIs lined up across teams, so people aren't arguing over whose number is “right.” Querio shows the SQL and Python behind each answer, which gives users a clear way to inspect the logic. Hex, by contrast, tends to work better for analyst-led notebook use than for open-ended chat used by business teams.
Once you trust the answer, the next issue is simple: who gets to see it, and who controls the logic behind it?
Governance Fit
For regulated teams, the best options are the ones with centralized definitions, row-level controls, and auditable access paths.
Stack Compatibility
This is where the differences start to stand out: integrations and day-to-day workflow.
| Tool | Warehouses | Chat Integration | Governance Depth |
|---|---|---|---|
| Querio | Snowflake, BigQuery, Redshift, PostgreSQL, ClickHouse, MySQL | Slack, Teams | Semantic context layer, SOC 2, HIPAA |
| ThoughtSpot | Snowflake, BigQuery, Redshift, Databricks, PostgreSQL | Slack, Teams | SpotterModel, RBAC, RLS |
| Looker | BigQuery, Snowflake, Redshift | Slack, Teams | LookML, RBAC |
| Power BI | Snowflake, BigQuery, Azure | Teams (native) | Fabric/DAX, RLS, RBAC |
| Tableau | Snowflake, BigQuery, Redshift, Salesforce | Slack | Pulse/Metrics, RBAC, RLS |
| Sigma | Snowflake, BigQuery, Databricks | Slack, Teams | RBAC, RLS, live warehouse |
| Hex | Snowflake, BigQuery, Redshift, Databricks | Slack | RBAC, notebook agent |
| Metabase | Snowflake, BigQuery, Redshift, PostgreSQL | Slack | Basic RBAC, RLS (enterprise only) |
Team Workflow Fit
Setup effort matters just as much as features when you're trying to get non-technical teams to use a tool.
For finance and SaaS ops teams, products with strong semantic layers help cut down on metric disputes. Marketing teams often lean toward visual dashboards because they make trend-spotting easier. Executives, on the other hand, usually want a fast search-bar style experience that gets them to an answer with as little friction as possible.
The table below maps each tool to its main user, interface, and setup burden.
| Tool | Best Team Fit | Primary Interface | Setup Effort |
|---|---|---|---|
| Querio | Finance, SaaS Ops | Chat / Slack / Teams | Low |
| ThoughtSpot | Executives, RevOps | Search bar | High |
| Looker | Data-mature orgs | Governed Explores | High |
| Power BI | Microsoft-heavy orgs | Dashboards / Copilot | Moderate |
| Tableau | Marketing, Execs | Visual dashboards | Moderate |
| Sigma | Finance, Marketing | Spreadsheet | Moderate |
| Hex | Data analysts | Notebooks | Moderate |
| Metabase | Agile internal teams | Dashboards | Low |
That side-by-side view leads into the pros-and-cons summary next.
Pros and Cons of Each Tool
The Business Intelligence tools comparison table below sums up the main tradeoffs for non-technical teams: speed, trust, governance, and day-to-day workflow fit.
| Tool | Pros | Cons | Best-Fit Team |
|---|---|---|---|
| Querio | Inspectable SQL and Python for every answer; live warehouse answers with an audit trail; Slack and Teams access | Requires live warehouse data; not a fit for CSV-first workflows | Finance, SaaS ops, and data teams at 100–500-employee B2B companies |
| ThoughtSpot | Connects to multiple sources; governed natural-language search [6] | Still needs setup and modeling for reliable answers; enterprise pricing often reaches six figures annually [1][3] | Teams that can dedicate data resources to setup and modeling |
| Looker | LookML centralizes metrics and business logic; deep BigQuery integration | Requires dedicated analytics engineers to build and maintain LookML; high total cost of ownership | Data-mature organizations on Google Cloud |
| Power BI | Native Microsoft 365 and Teams integration; familiar for Excel users; Pro starts at $14/user/month [6] | Copilot requires Fabric F64 capacity at about $6,400/month [6]; modeling has a steep learning curve [6][7] | Microsoft-first teams in the Azure ecosystem |
| Tableau | Strong visual storytelling; Pulse for automated insights; large community | Creator licenses start at $75/user/month [4][6]; AI features are paid add-ons; no-code still depends on heavy upstream data prep [4][7] | Teams that need executive-ready visuals |
| Sigma | Familiar spreadsheet interface; live warehouse queries with no data extracts; supports data write-back [3][7] | Natural language chat is secondary to the spreadsheet interface; fewer custom visualization options than Tableau [3][7] | Finance and ops teams that live in Excel |
| Hex | Collaborative notebooks that publish shareable data apps; viewers are free on paid plans [1][2] | Built for analysts writing code, not business users asking questions in Slack [1][2]; paid plans run about $36–$75 per editor/month [1] | Analyst-heavy teams moving from Mode or Jupyter |
| Metabase | Open-source tier is free; fast onboarding; guided question builder [7] | Advanced governance and audit logs are locked behind higher tiers; limited AI capabilities [7] | Startups and agile product teams |
A simple way to read this table: some tools lean toward governed self-serve analytics, while others lean toward analyst-led work or spreadsheet-style operations.
If your team wants answers inside Slack or Teams, with a clear trail back to the warehouse, Querio stands out. If you already have people who can handle setup, modeling, and metric definitions, ThoughtSpot or Looker may work better. For Microsoft shops, Power BI feels familiar fast, but the jump to Copilot comes with a much bigger bill [6].
Tableau is still a strong pick when polished dashboards matter most. Sigma makes more sense when finance or ops teams think in rows, formulas, and sheets. Hex is better for analysts who want to build notebooks and apps, not for business users who just want to ask a question and get an answer. And Metabase is often the low-friction option for startups that need to get moving without a big upfront spend.
Use these tradeoffs to match each tool to a team type and workflow in the recommendation below.
Which Tool Should You Choose?
For non-technical teams, the best pick is usually the one that gets you to a trustworthy answer fast inside the workflow your team already uses. So this decision often comes down to three things: governance, workflow, and how well the tool fits your stack.
Querio is a strong match for B2B SaaS, healthcare, and finance teams using Snowflake, BigQuery, Redshift, or Postgres. It works well when you need live warehouse answers, inspectable SQL, and a clear audit trail. Looker makes sense for Google shops that want a single source of truth. ThoughtSpot is a good fit if you want search-based analytics and have the data resources needed for setup and modeling.
If your team is already tied to a main platform, lean into that. Power BI fits Microsoft-first teams naturally. Tableau stands out when polished executive reporting and visual storytelling are the top priority.
For smaller teams that care most about speed or budget, Metabase is the easiest place to start for basic BI needs. Sigma fits finance or ops teams that like a spreadsheet-style interface on live warehouse data. Hex works best for analyst-heavy teams building notebooks and shareable data apps.
The table below turns that into common team scenarios.
| Team Scenario | Best Fit | Why |
|---|---|---|
| Marketing - campaign performance checks | Querio | Slack-native warehouse answers |
| Finance - trusted KPI tracking | Querio or Looker | Governed semantic layer keeps metric definitions consistent |
| Operations - anomaly follow-up | ThoughtSpot | SpotIQ scans for trends and outliers automatically [3] |
| Support - recurring service reporting | Querio or Metabase | Governed Slack access or low-cost dashboards |
| Executive team - visual storytelling | Tableau | Strong visualization for executive reporting |
| Microsoft-first teams - Teams integration | Power BI | Native Microsoft 365 fit |
Use the matrix above to match your team to the right fit.
FAQs
::: faq
How much setup does a data chat tool usually need?
Setup time can range from a few hours to several weeks. It mostly comes down to the platform you pick.
Tools with a pre-built semantic layer, like ThoughtSpot or Looker, often need 1–3 weeks or more upfront to model data and lock in consistent, governed metrics. That work can pay off, but it does mean more setup before people can dive in.
Schema-first tools like Querio are much faster to get going. In many cases, they can connect to your warehouse and start generating insights in about 15 minutes. Even so, input from the data team still helps tighten accuracy over time. :::
::: faq
What makes an AI data answer trustworthy?
An AI data answer is trustworthy when it rests on a governed semantic layer. That’s what keeps metric definitions consistent across the organization, so “revenue,” “active users,” or “conversion rate” don’t quietly mean different things to different teams.
Trust also comes down to transparency and control. People should be able to inspect and edit the SQL or Python behind an answer instead of taking it on faith. At the same time, the tool needs to enforce warehouse access controls, keep audit logs, and ask clarifying questions when a prompt is vague rather than making a guess. :::
::: faq
Which tool is best for Slack or Teams use?
For Slack teams, Bruin is the best fit. It’s Slack-native, which means business users can ask questions right inside Slack and get answers in the same thread without hopping between tools.
It also works well for both business and data teams thanks to its built-in data pipeline and SQL/Python transformation workflow. :::