Business Intelligence
Top 7 AI Agents for Marketing Analytics (Meta, GA4, Shopify)
Choose AI analytics by where your data lives and who needs answers—warehouse-first for auditability, attribution-first for fast ad decisions.

If you need one short answer: pick based on where your data lives and who needs the answers.
I’d group these 7 tools into 3 buckets:
- Warehouse-first: Querio, ThoughtSpot Sage, Hex, Looker + Gemini
- Attribution-first: Triple Whale, Northbeam
- Sync-first: Polytomic AI
This matters because the same question can mean very different work behind the scenes. A marketer asking “Why did ROAS drop yesterday?” may need attribution. A finance lead asking “Why doesn’t Shopify revenue match GA4?” needs metric checks, refunds, returns, and SQL they can review.
Here’s the short version:
- Querio fits teams that want plain-English answers on warehouse data with visible SQL and Python.
- ThoughtSpot Sage fits teams with a clean warehouse and a set metrics layer.
- Polytomic AI fits teams focused on moving and lining up Meta, GA4, and Shopify data in the warehouse.
- Triple Whale fits Shopify-first DTC brands that care most about paid media attribution.
- Northbeam fits performance marketing teams that want channel-level attribution checks.
- Hex fits analysts doing custom SQL/Python work.
- Looker + Gemini fits teams already deep in Looker and Google Cloud.
The article judges them on 4 buying factors:
- Source connectivity
- Revenue reconciliation
- Explainability
- Team fit
A few points stand out right away:
- Triple Whale starts at about $129/month, with higher tiers from $499+/month.
- Querio has a free plan, and Core is $2,499/month.
- ThoughtSpot Sage starts at $25/user/month for Essentials and $50/user/month for Pro.
- Triple Whale reports 70% to 85% Meta match rates in some iOS-heavy cases, vs. 40% to 60% from a standard Meta pixel.
- Even then, 15% to 30% of revenue may still stay unassigned.
::: @figure 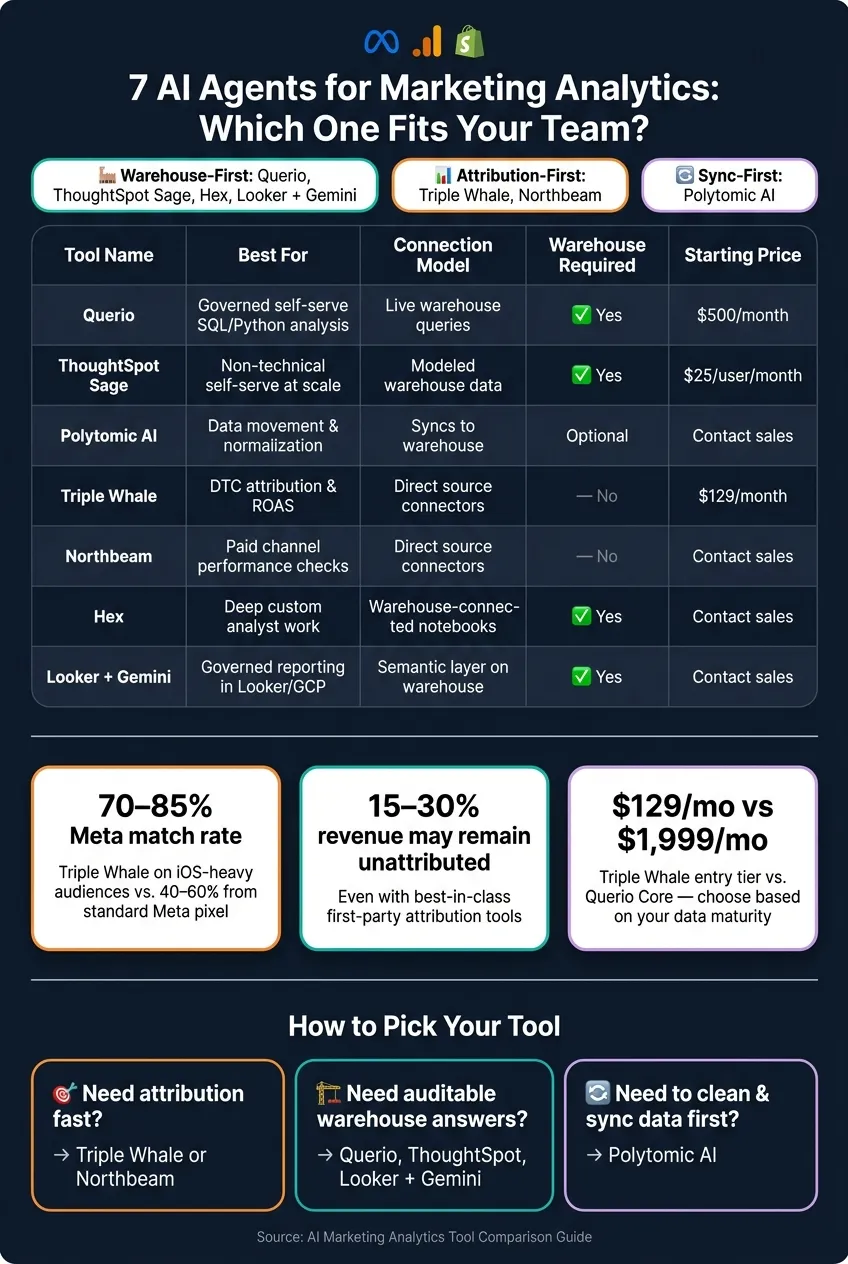 {7 AI Marketing Analytics Tools Compared: Features, Pricing & Best Fit}
:::
{7 AI Marketing Analytics Tools Compared: Features, Pricing & Best Fit}
:::
Quick Comparison
| Tool | Main model | Best for | Main limit |
|---|---|---|---|
| Querio | Live warehouse queries | Governed self-serve analysis | Needs modeled warehouse data |
| ThoughtSpot Sage | Search on warehouse data | Non-technical self-serve at scale | Needs a set semantic layer |
| Polytomic AI | Source sync to warehouse | Data movement and normalization | Less focused on analysis |
| Triple Whale | Direct ecommerce connectors | DTC attribution and ROAS | Narrower outside marketing |
| Northbeam | First-party attribution | Paid channel performance checks | Less audit depth |
| Hex | SQL/Python notebooks | Deep analyst work | Not ideal for non-technical users |
| Looker + Gemini | LookML-based Q&A | Governed reporting in Looker | Setup can be heavy |
My read: if you want auditable answers, lean warehouse-first. If you want channel attribution fast, look at Triple Whale or Northbeam. If your main problem is getting data into shape first, Polytomic AI makes more sense.
That’s the frame I’d use before reading the full breakdown.
1. Querio
Querio connects to your warehouse and answers marketing questions in plain English, with SQL you can inspect.
Source Coverage
Querio works through Snowflake, BigQuery, Redshift, and Postgres. So instead of relying on native connectors, CSV exports, or manual pulls, it queries the warehouse copy of Meta Ads, GA4, and Shopify data.
That matters for a simple reason: once the data lands in the warehouse, you need to know whether revenue, spend, and session numbers still line up.
Revenue Reconciliation
Querio queries live tables, including returns, refunds, and order adjustments. Because of that, Shopify revenue, Meta spend, and GA4 sessions can reconcile against the same governed metric definitions stored in GitHub with dbt.
In plain terms, you're working from warehouse truth instead of platform-reported numbers. And you avoid the usual mess where different people use different definitions for the same metric.
Explainability and the Query Trail
Every answer shows up as editable SQL and Python inside a reactive notebook with linked cells and auto-updating charts. You can open the query, inspect the tables, and change the logic right there.
That makes each result traceable. And that traceability is what makes it safer to share analysis with marketing, finance, and leadership.
Team Fit
Querio makes sense for data teams and analysts who already run a modern analytics stack and are tired of being the manual answer desk for marketing questions.
It also works for non-technical marketers and executives using Slack or Microsoft Teams. They can ask questions in plain English, and those questions spin up real notebooks behind the scenes, with the analysis still open to review.
The tougher part comes earlier in the process. If your team hasn't already centralized Shopify, Meta, and GA4 data in a warehouse, Querio will be harder to use well. The upstream modeling work needs to be done first.
Querio has a free plan, and Core is $2,499/month (or $25,000/year billed annually). Every plan includes unlimited users and unlimited data connections. So this is aimed at teams that want governed self-serve analysis, not just another dashboard layer.
2. ThoughtSpot Sage
ThoughtSpot Sage is a good fit for teams that already pipe Meta Ads, GA4, and Shopify into a central warehouse and want search-based self-serve analytics at enterprise scale. In plain English: it works best when your data house is already in order and the main job is finding answers, not cleaning up messy inputs.
Source Coverage
ThoughtSpot doesn’t offer native marketing connectors for Meta Ads, GA4, or Shopify. Instead, it connects to platforms like Snowflake, BigQuery, Amazon Redshift, and Databricks. So those data sources need to be loaded into a warehouse first, and they’re often modeled in dbt. [1][2][3]
Revenue Reconciliation
Revenue reconciliation happens before Sage gets involved. That work sits in the warehouse and semantic layer, where teams define ROAS, CAC, and revenue rules upstream. If those definitions aren’t lined up there, Sage won’t fix them later. [2][3]
Explainability
Spotter can generate inspectable SQL, and it handles follow-up questions and change analysis well. That makes it useful for anomaly review and digging into channel performance. [2][5]
There’s a catch, though. More complex funnel or retention logic still needs predefined measures. Without that setup, answers can drift into the wrong method. That’s the tradeoff: Sage shines once the metrics layer is already defined.
Team Fit
Sage makes the most sense for mid-market and enterprise teams with a data owner managing the warehouse and semantic layer. It’s a strong option when marketing and finance need to look at the same ROAS definition every day, instead of arguing over whose number is right.
If that governed warehouse and semantic layer aren’t already in place, setup can move slowly. Pricing starts at $25 per user per month for Essentials and $50 for Pro. Enterprise deals often land in the five- or six-figure annual range. [1][2]
3. Polytomic AI
If your biggest headache isn’t coming up with questions, but getting Meta Ads, GA4, and Shopify to tell the same story, Polytomic AI is built for that reconciliation step. It’s a strong fit for teams that need to line up data from Meta Ads, GA4, and Shopify and check the logic behind the numbers.
Source Coverage
Polytomic AI normalizes Meta Ads, GA4, and Shopify data as it lands in Snowflake, BigQuery, Redshift, or Postgres. That way, spend, sessions, orders, and revenue all use the same definitions.
Revenue Reconciliation
Attribution is incomplete by default. So teams still need dbt logic or analyst review to assign unmatched orders, refunds, and revenue before finance can trust the result.
Explainability
Because the SQL is inspectable, analysts can check joins, filters, and attribution logic before anything shows up in reporting.
Team Fit
Polytomic AI fits data and analytics teams that own reconciliation logic and need auditable answers across Meta Ads, GA4, and Shopify before numbers reach reporting. It works best when reconciliation comes first and self-serve analysis comes after.
4. Triple Whale
Triple Whale is a managed marketing analytics layer built for DTC teams. It is not a warehouse-native BI tool, so the main decision is pretty simple: do you need attribution first, or do you need company-wide warehouse analysis first?
Source Coverage
Triple Whale connects with Shopify, Meta Ads, GA4, Google Ads, TikTok, and Klaviyo through Triple Pixel, its first-party tracking layer built for iOS-era attribution.
That setup works well for paid media and ecommerce use cases. But if your team also needs 3PL logs, support costs, or finance data to get to full contribution margin analysis, that data lives outside Triple Whale's model. In practice, that means Triple Whale is strongest for marketing and ecommerce workflows, not broad finance or ops reporting.
Revenue Reconciliation
That tighter data stack is also why Triple Whale shows its best reconciliation results in ad-to-revenue attribution.
It uses its first-party pixel, multi-touch attribution, and marketing mix modeling to line up spend and revenue across channels. On iOS-heavy audiences, Meta match rates can reach 70% to 85%, compared with 40% to 60% from a standard Meta pixel [2].
That jump matters. At the same time, it doesn't solve everything. Even with better matching, 15% to 30% of revenue can still remain unassigned or unattributed, and contribution margin analysis stays partial because finance and support costs are not part of the model [2].
Explainability
Moby, Triple Whale's AI agent, helps with fast answers on ROAS by campaign, spend pacing, and channel mix.
There is a catch, though: setup and pixel calibration usually take 2 to 3 weeks before the data is reliable enough to use for decisions [2]. So it isn't the kind of tool you plug in on Monday and trust by Friday.
Team Fit
Triple Whale is a strong fit for performance marketers and DTC ecommerce operators where paid media is the main growth lever and first-party attribution is the top need.
Pricing starts at about $129/month, with the Whale tier starting at $499+/month for the most advanced modules [2]. If your team already runs Snowflake or BigQuery for company-wide analytics, Triple Whale makes more sense as a marketing system of record than as your main analytics layer.
5. Northbeam
Northbeam works best for teams that need attribution-first answers across Meta, GA4, and Shopify, rather than warehouse-native reporting. Put simply, it’s a good fit when the main question is which channel drove the result, not which governed metric should stand as the source of truth.
Source Coverage
Northbeam uses its own first-party pixel and attribution model. Because of that, its output is tuned for channel attribution, not governed warehouse metrics. That model also shapes how revenue gets assigned across channels.
Revenue Reconciliation
Use Northbeam to check channel attribution coverage, then validate edge cases in the warehouse when finance needs a governed revenue number.
Explainability
Northbeam is better for fast channel diagnostics than for fully auditable metric logic.
Team Fit
Northbeam is a strong fit for performance marketing teams when paid media attribution is the main use case. It’s well suited for campaign-level ROAS and channel mix checks across Meta, GA4, and Shopify.
Use Northbeam for:
- ROAS
- spend pacing
- channel mix analysis
Don’t use it as your central governed analytics layer. If your team needs analysis that goes past attribution, the next tool supports a different workflow.
6. Hex
If Northbeam is where you go for attribution-first questions, Hex is where the deeper warehouse work happens. It’s a collaborative notebook built for teams that work heavily in SQL and Python and need custom analysis on warehouse data. This is not the tool for instant marketing Q&A.
Source Coverage
Hex connects to Snowflake, BigQuery, Redshift, and Postgres. But sources like Meta Ads, GA4, and Shopify need to be modeled in the warehouse first.
That’s a better match for teams with data engineering support than for operators looking for a ready-to-use marketing layer. Once that warehouse model is in place, Hex becomes useful for custom metric work. You can use it for:
- Funnel analysis
- Cohort analysis
- Margin analysis
- Custom ROAS logic
Revenue Reconciliation
Once your warehouse data is modeled, Hex can take on complex reconciliation work. Analysts can use SQL or Python to calculate ROAS and CAC from ad spend, sessions, orders, and refunds.
The metric logic, schema mapping, and semantic layer definitions all live in analyst-written SQL or Python. In plain English: your team builds the logic itself, instead of relying on a prebuilt layer.
Explainability
Hex is strong on transparency for technical users. Every analysis lives in an inspectable notebook made up of SQL and Python cells that analysts can check, edit, and rerun.
Business users usually don’t ask ad hoc questions in Hex directly. Instead, they tend to use published apps built by analysts. That makes Hex a better fit for analysts than for non-technical users.
Team Fit
Hex fits analyst-heavy teams that already run a modern data stack and have solid SQL and Python skills. It works well when the goal is a collaborative notebook setup for bespoke analysis.
It’s a poor fit for marketing managers who need fast, conversational answers without writing queries.
7. Looker + Gemini
If Hex feels like analyst-built notebooks, Looker + Gemini works a bit differently. It sits on top of Looker’s semantic layer and lets people ask plain-English questions about warehouse data. For Google Cloud teams that already run on Looker, that makes it a strong option for governed analytics.
Source Coverage
Looker + Gemini connects to BigQuery, Snowflake, Redshift, and Postgres [5][1]. If you want to use data from Meta Ads, GA4, or Shopify, that data needs to be loaded into the warehouse first and then modeled in LookML before Gemini can query it.
That setup matters. If your team needs the same answer every time for ROAS, funnel performance, or Shopify-to-GA4 revenue checks, warehouse-first modeling helps keep everyone on the same page.
Revenue Reconciliation
Gemini uses approved LookML definitions, so revenue and ROAS stay in sync across teams. That’s the upside.
The catch is the setup work. Your team has to build and maintain the reconciliation logic in LookML before Gemini can use it [5][3]. So while the answers can stay clean and consistent, they don’t come out of thin air.
Explainability
This is where Looker + Gemini stands out most: explainability.
Analysts can inspect the generated SQL with Looker’s Show SQL feature. That makes it easier to check joins, metric logic, and definition choices before results get shared more broadly [1][3]. In practice, that extra visibility can save a lot of back-and-forth.
Team Fit
Looker + Gemini fits enterprise teams that already have a Looker stack, run on Google Cloud, and need governed reporting for ROAS, funnel analysis, and repeatable executive health checks [4].
It’s less suited to ecommerce operators or executives who want low-friction daily Q&A with little setup. That gap becomes a lot clearer in the side-by-side comparison below.
Side-by-Side Comparison Across Four Buying Factors
After the tool-by-tool profiles, this view focuses on the tradeoffs that matter most when you're picking one. The table below narrows the seven tools into four buying factors: source coverage, reconciliation, explainability, and team fit.
1. Source Coverage
How a tool connects to data shapes setup work and governance. The seven tools fall into two camps: warehouse-first and connector-first. Querio, Hex, ThoughtSpot Sage, and Looker + Gemini are warehouse-first. Triple Whale and Northbeam use direct source connectors. Polytomic AI sits between those two models, syncing source data into your warehouse instead of querying it live.
| Tool | Connection Model | Warehouse Required | Native Source Connectors |
|---|---|---|---|
| Querio | Live warehouse queries | Yes | No |
| ThoughtSpot Sage | Modeled warehouse data | Yes | No |
| Polytomic AI | Syncs to warehouse | Optional | Yes |
| Triple Whale | Direct source connectors | No | Yes |
| Northbeam | Direct source connectors | No | Yes |
| Hex | Warehouse-connected notebooks | Yes | No |
| Looker + Gemini | Semantic layer on warehouse data | Yes | No |
That split has a direct effect on how much cleanup your team needs to do before the tool starts paying off.
2. Revenue Reconciliation
This is where the clearest divide shows up.
Triple Whale's Moby is built for DTC attribution. It uses a first-party pixel and Marketing Mix Modeling (MMM) to reconcile ad spend with Shopify revenue [2]. Looker + Gemini and ThoughtSpot Sage deal with reconciliation through governed metric definitions. That can work well when the warehouse model is already right, but it depends on someone setting up and maintaining that logic first. Northbeam is centered on multi-touch attribution across paid channels. That's useful for marketing questions, but it's less complete for margin or P&L analysis.
The next issue is simple: can users check how those numbers were produced?
3. Explainability
Explainability decides whether users can inspect the logic behind a number. Querio and Hex show the underlying SQL and Python directly, so analysts can review and change the logic. Looker + Gemini and ThoughtSpot Sage depend on governed metric definitions. That helps keep metrics consistent, but it gives users less visibility into the full calculation path. Triple Whale and Northbeam are less easy to audit. They work well for fast marketing readouts, but they aren't built for checking every assumption.
The last filter is team structure: analyst-led, marketing-led, or enterprise-governed.
4. Team Fit
Pick based on user type and warehouse maturity, not feature count.
| Tool | Best Buyer | Key Tradeoff |
|---|---|---|
| Querio | Data teams at warehouse-native companies | Needs modeled data and clear metric definitions; no ecommerce domain knowledge out of the box |
| ThoughtSpot Sage | Mid-market BI teams and non-technical self-serve users | Works best with a governed warehouse and semantic modeling |
| Polytomic AI | RevOps/data teams syncing sources into a warehouse | Focused on data movement, not deep analysis |
| Triple Whale | DTC marketing teams and ecommerce operators | Strong attribution layer, but limited for broader financial analysis |
| Northbeam | Performance marketing teams | Attribution-focused, so less useful for SKU or funnel analysis |
| Hex | Analyst teams doing deep custom investigation | Requires SQL/Python skill and more data engineering support |
| Looker + Gemini | Enterprise teams already invested in Looker | Highest governance payoff, but only after the semantic layer foundation is in place |
Pros and Cons of Each Tool
The table below turns the earlier profiles into a buying view.
| Tool | Biggest Advantage | Biggest Drawback | Best Use Case |
|---|---|---|---|
| Querio | Live warehouse queries with inspectable SQL and Python; governed context layer you own | Needs a modeled warehouse and governed context before it reaches full value | Data teams at warehouse-native companies wanting governed self-serve across Snowflake, BigQuery, or Redshift |
| ThoughtSpot Sage | Search-style analytics for non-technical users; enterprise-grade governance | Requires a pre-modeled, governed warehouse | Mid-market BI teams replacing traditional dashboards |
| Polytomic AI | Syncs source data into your warehouse instead of creating a separate silo | Built more for syncing and activation than deep analysis | RevOps or marketing ops teams syncing source data for downstream analysis |
| Triple Whale | Fast Shopify and Meta integration with first-party pixel attribution; ROAS reporting | Data stays inside the platform, which limits margin or P&L analysis beyond marketing | DTC marketing teams where paid media is the primary performance lever |
| Northbeam | Specialized multi-touch attribution across paid channels | Narrower once you move past attribution into SKU-level or funnel analysis | Performance marketing teams running ROAS reporting and attribution checks |
| Hex | Extreme flexibility for custom SQL and Python analysis | Requires data engineering skill; not accessible to non-technical marketing users | Analyst teams doing deep, custom investigation on warehouse data |
| Looker + Gemini | Governed metrics via LookML ensure a single source of truth across departments [3] | Complex setup and high maintenance; tightly tied to the Google Cloud ecosystem [4] | Large enterprise teams with dedicated data engineers and strict governance requirements |
Use these tradeoffs to match the tool to the team that will own reporting. Start with the job you need most often: ROAS reporting, revenue reconciliation, funnel analysis, or executive health checks.
The biggest divide is pretty simple: warehouse-native control vs. speed for marketing users. Commerce-native tools come with built-in ecommerce assumptions. Warehouse-native tools depend on the context your team has already modeled.
There’s another split too: governance vs. speed. Tools like Looker + Gemini and ThoughtSpot Sage enforce metric definitions through a semantic layer, so “revenue” means the same thing whether the question comes from a marketer or a CFO. That kind of consistency matters when more people rely on the same numbers. The catch is that someone has to build and maintain that layer.
Querio takes a different path. It stores its context layer as plain SQL, Markdown, and Python files synced to GitHub alongside your dbt project. That keeps definitions close to the models that produce them instead of placing them in a separate governed system.
From there, narrow your shortlist based on team structure, warehouse maturity, and who actually owns reporting.
How to Choose the Right Tool for Your Team
The right pick comes down to one thing: what does your team need to do most often? Start there. Match the tool to that main job, and you’re far less likely to spend money on features your team barely touches.
Use this table to connect your most common workflow to the tool that fits best.
| Primary Job | Strongest Fit | Why |
|---|---|---|
| Unified reporting across Meta Ads, GA4, and Shopify | Triple Whale | Commerce-native consolidation with first-party attribution |
| Attribution and revenue reconciliation | Triple Whale / Northbeam | First-party tracking and MMM reconcile spend to revenue across channels |
| GA4 funnel analysis | Querio or Hex | Best when GA4 is already modeled in your warehouse and you need inspectable SQL on live data |
| Shopify SKU analysis | Querio or Hex | Best when product and order data are already in the warehouse |
| Governed cross-functional analytics | Querio / ThoughtSpot / Looker | Context and semantic layers keep core metrics consistent across teams |
| Daily anomaly checks | Querio or Hex | Scheduled governed query runs delivered to Slack or email before your team logs in |
If one workflow clearly drives most of your team’s work, start with that row. If two matter just as much, lean toward governance and auditability. That tends to save a lot of pain later, especially once more teams start using the same numbers.
If paid media attribution is the main headache, put Triple Whale or Northbeam at the top of your list. Triple Whale makes more sense for Shopify-first brands. Northbeam tends to fit larger teams dealing with more complex media mixes.
When two tools seem to fit the same job, the tie-breaker is usually your warehouse setup and who owns the metrics. Put simply:
- Querio: governed, warehouse-native self-serve with inspectable SQL and Python
- ThoughtSpot: conversational analytics for governed warehouse data
- Hex: analyst-led custom SQL/Python investigation
- Looker + Gemini: governed reporting for teams already standardized on LookML
If your team needs to check every answer for itself, lean toward tools that show inspectable SQL instead of tools that only give you a summary.
FAQs
::: faq
Which tool is best if our data already lives in Snowflake or BigQuery?
If your marketing data already lives in Snowflake or BigQuery, Mitzu is the best fit. It runs diagnostic investigations right in your warehouse, so there’s no data copying and no long dbt modeling sprint to slow things down.
It also scans your schema, including GA4 and custom event data, to build a semantic layer. That means non-technical teams can work with warehouse-native data using natural language, instead of waiting on SQL help for every question. :::
::: faq
How should you choose between attribution and warehouse-based analysis?
It comes down to what you need: tactical ad optimization or business-level analysis.
Use attribution-first platforms when the goal is to scale paid media spend and tie ad spend plus conversion paths to revenue in real time. They’re built for day-to-day media decisions, where speed matters and teams need to see what’s driving sales right now.
Use warehouse-based analysis when you need a governed, single source of truth for metrics like contribution margin, LTV, or P&L across advertising, CRM, support, and accounting. That setup makes more sense when the job is less about tuning campaigns in the moment and more about getting clean numbers the business can trust. :::
::: faq
What setup work is required before these tools are reliable?
Reliable marketing analytics takes more than pulling in raw data. You need clean, connected data from Shopify, Meta, and your other systems. And you should have at least six to twelve months of historical order data in place.
You also need a governed semantic layer so metrics like CAC, blended ROAS, and contribution margin mean the same thing every time someone looks at them. That data should be prepared in your warehouse, such as Snowflake, BigQuery, or Redshift, and mapped to agreed business definitions before setup. :::