Business Intelligence
How to answer investor data requests in minutes instead of days
Turn investor data requests from days to minutes by centralizing live data, standardizing metrics, and automating queries.
Investor data requests often take days due to scattered data, manual processes, and inconsistent metrics. This creates delays, errors, and frustration for teams under pressure to deliver accurate reports quickly. But with the right tools and workflow, you can cut response times to minutes.
Here’s how to do it:
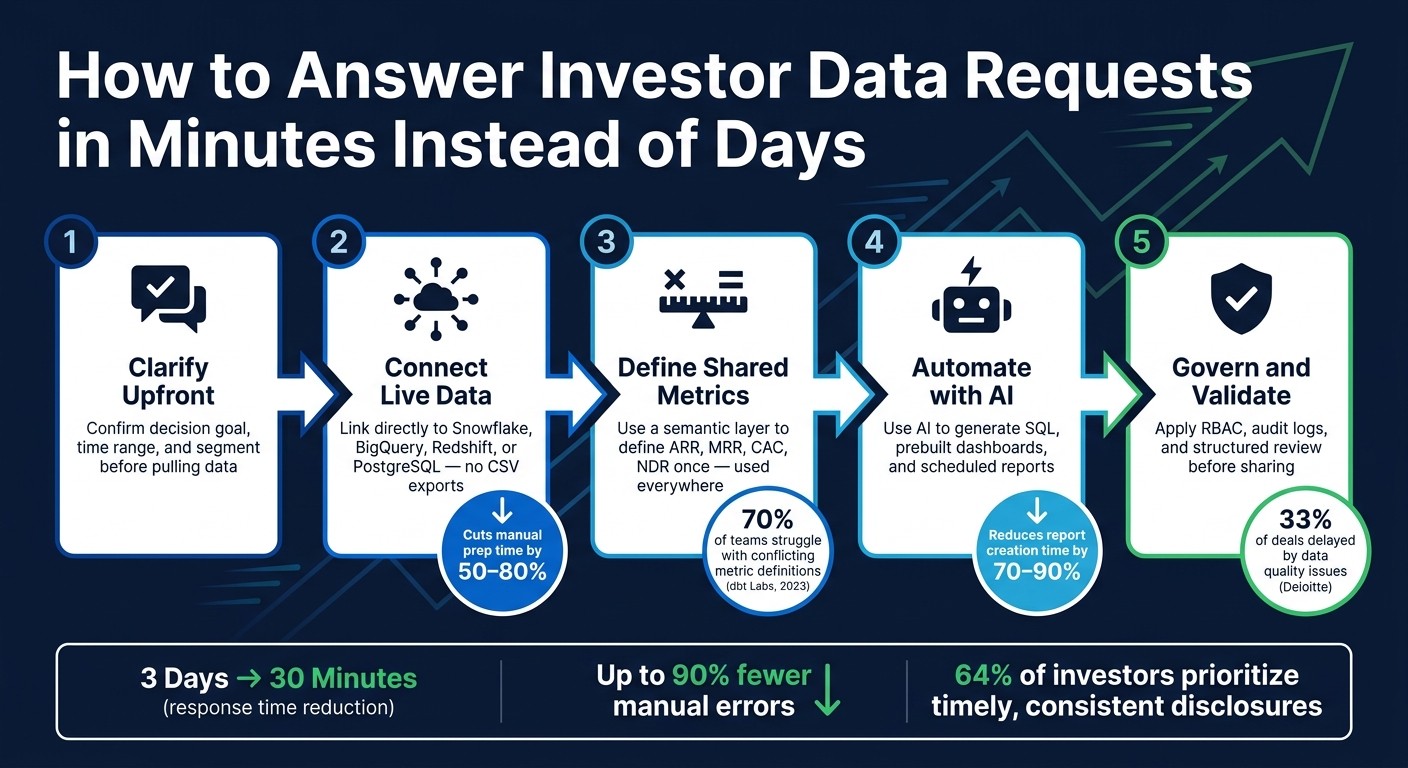
Centralize data: Connect live data warehouses (e.g., Snowflake, BigQuery) to eliminate outdated exports and ensure real-time accuracy.
Standardize metrics: Use a semantic layer to standardize SaaS metrics like ARR and CAC consistently across all reports.
Automate workflows: Leverage AI-powered tools to generate SQL queries, dashboards, and templates for common investor questions.
Clarify requests upfront: Confirm what investors need before pulling data to avoid unnecessary back-and-forth.
Secure and validate data: Use role-based access controls, audit logs, and structured reviews to maintain accuracy and protect sensitive information.
These steps not only save time but also build trust with investors by delivering precise, reliable data when it matters most.
How to Answer Investor Data Requests in Minutes
Automating Investor Communication with AI Agents | Investor Relations Agent
How to Handle Investor Data Requests More Efficiently
Using AI-powered business intelligence to streamline investor data requests sounds great in theory, but putting it into practice requires a well-thought-out process. Here's how to create a workflow that works every time.
Clarify What the Investor Actually Needs Before Pulling Data
Vague requests are a recipe for wasted time. When an investor asks for "growth metrics", they might mean revenue growth, user acquisition trends, or expansion MRR. To avoid confusion, make sure you clarify three things before diving into your data:
What decision are they trying to make?
What time range do they care about?
Do they need details for a specific segment? (e.g., enterprise vs. SMB, or U.S. vs. international)
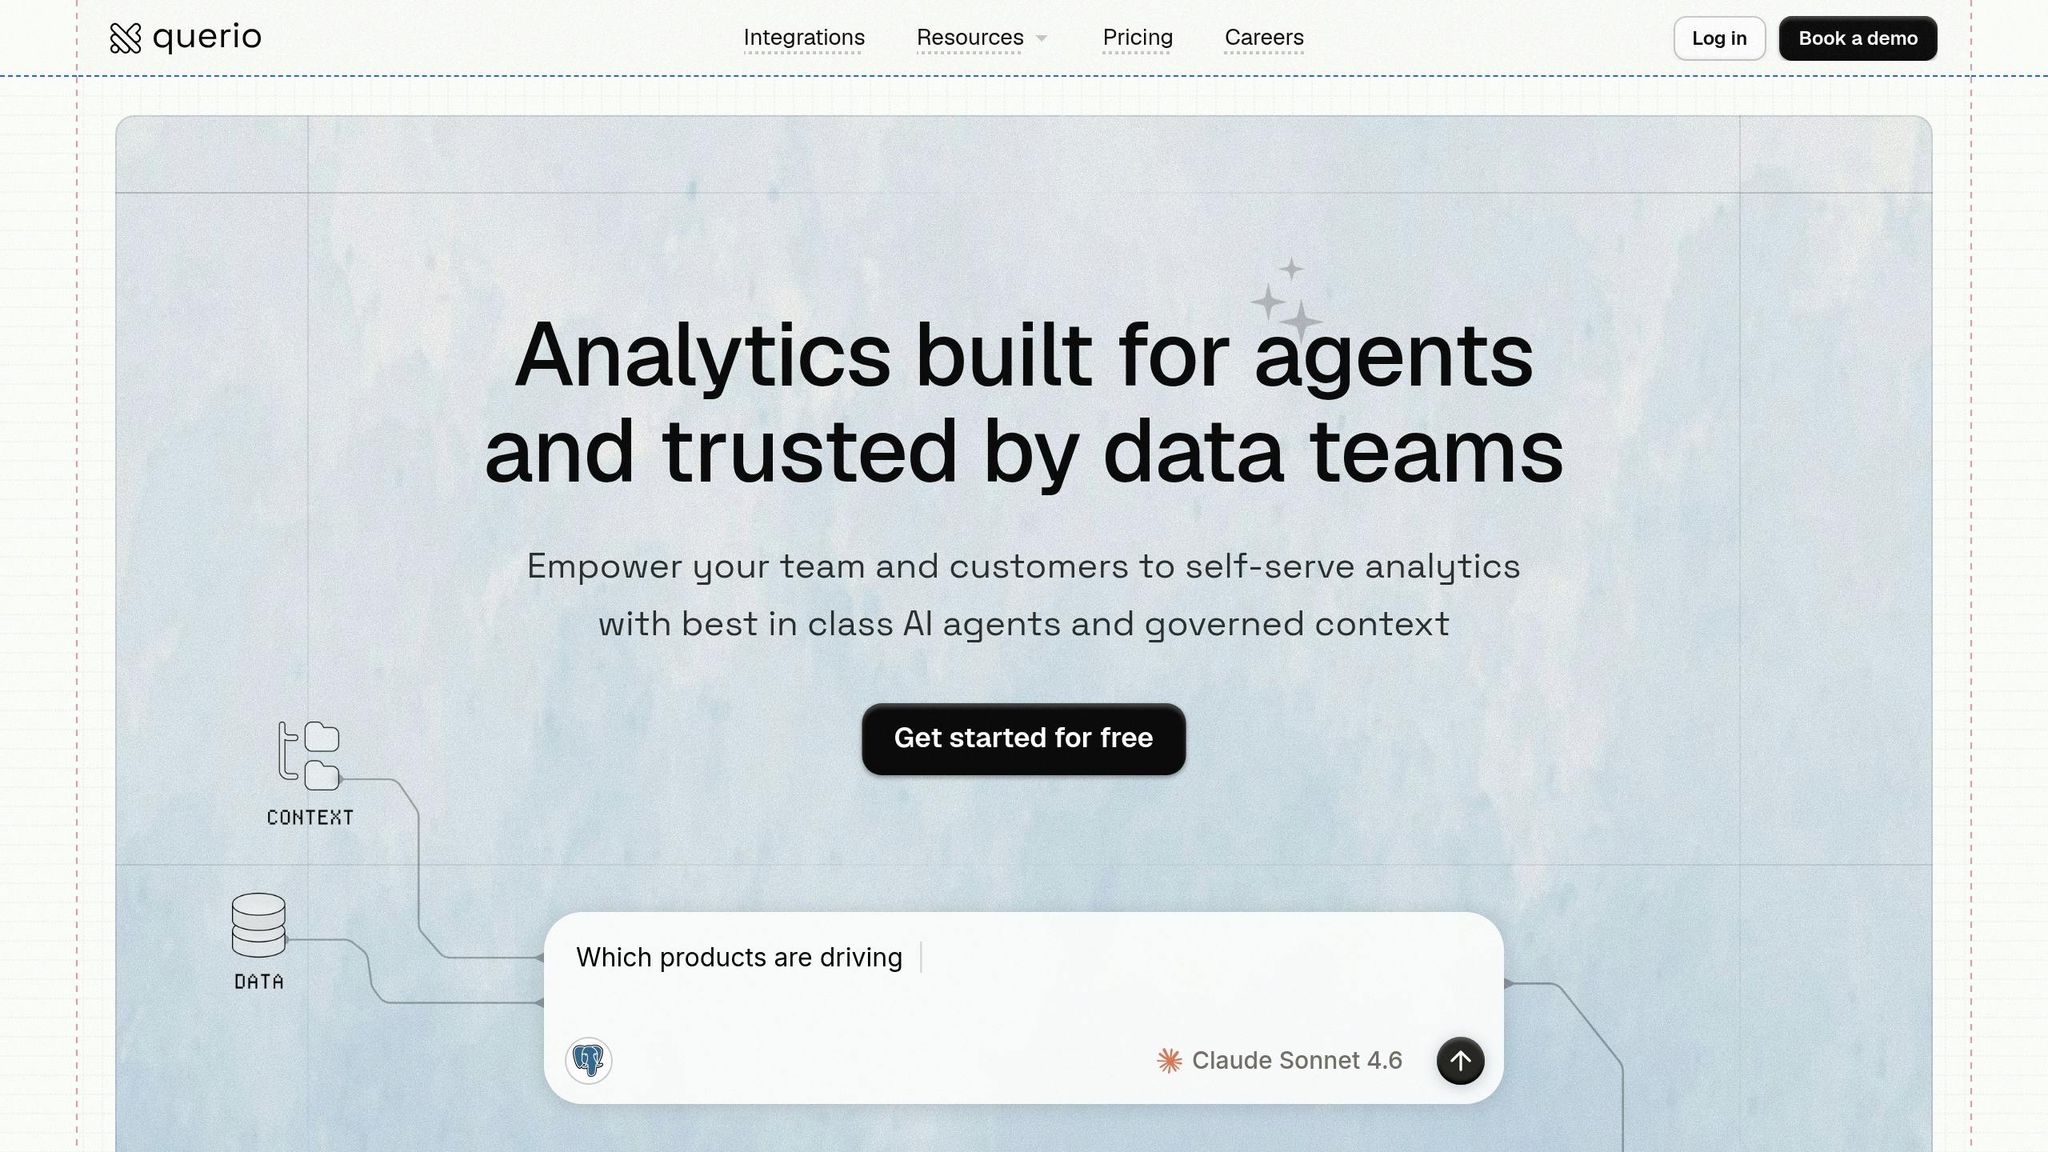
A quick message via Slack or email to confirm these points can save hours of back-and-forth. Once you have a clear understanding, tools like Querio make it easy to generate the right data. You can simply type your question in plain English, and the AI translates it into SQL. This clarity also makes it easier to standardize your responses.
Build a Reusable Investor Response Template
Instead of starting from scratch every time, create a template for investor responses. A well-structured template should include these key areas:
Size: ARR/MRR
Growth: Month-over-month rates
Efficiency: Burn multiple and CAC payback
Retention: Net dollar retention
Unit Economics: Gross margin
Each section should link directly to specific data fields in your warehouse. For example, Querio's semantic layer can define metrics in plain English, such as "MRR is the sum of successful, non-refunded Stripe charges in a given month." This setup not only reduces manual errors by up to 90%, but also shortens reporting cycles by 40–60% [2].
As your company grows, your focus metrics will evolve. Here's a quick reference for what to prioritize at different stages:
Metric | Seed | Series A | Series B+ |
|---|---|---|---|
MRR / ARR | Required | Required | Required |
MoM Growth | Required | Required | Required |
Burn Rate / Runway | Required | Required | Required |
CAC Payback / NDR | Optional | Required | Required |
Burn Multiple | Optional | Required | Required |
Segment Economics | N/A | Optional | Required |
Before sharing, double-check all automated numbers against your source systems to ensure accuracy.
Set Up a Centralized Data Room
A data room shouldn't just be a static folder filled with PDFs. Instead, make it a dynamic, live environment where investors can access up-to-date information whenever they need it.
With tools like Querio, you can connect dashboards directly to your data warehouse, schedule automatic updates, and organize key metrics - such as ARR, churn, pipeline, and burn - into one secure, access-controlled workspace. This setup means investors always see the latest data, not last week's snapshot. It also eliminates the endless back-and-forth for updates and builds trust during due diligence.
Building a Solid BI Foundation with Querio
Having a strong BI foundation is the key to turning investor data requests into quick, accurate responses. While a centralized data room and polished response template are helpful, the real game-changer lies in how your data is connected, defined, and queried. This is where Querio steps in, offering tools designed to bridge the gap.
Connect Directly to Your Live Data Warehouse
Exporting CSV files for analysis slows everything down. Every follow-up question means starting the process from scratch, wasting valuable time.
Querio eliminates that delay by connecting directly to your live data warehouse - whether it’s Snowflake, BigQuery, Amazon Redshift, ClickHouse, or PostgreSQL. Using encrypted, read-only credentials, Querio ensures your data is secure and always up-to-date, giving investors confidence in the accuracy of your reports. Setup is quick, often taking less than 15 minutes. For Snowflake, it’s recommended to create a dedicated role with read-only access to your analytics schemas (like ANALYTICS.PROD). For BigQuery, you can assign a service account with roles/bigquery.dataViewer permissions through IAM.
Once connected, every query taps into live data. Snowflake notes that companies leveraging live BI connections directly on their warehouse often cut manual data preparation time by 50–80%.
With live data access sorted, the next step is ensuring your metrics are consistent and reliable for reporting.
Define Shared Metrics for Consistent Reporting
One of the biggest hurdles during investor due diligence isn’t data gaps - it’s conflicting numbers. For example, an ARR figure in your board deck might not match what’s in your data room, or CAC may be calculated differently across models. These inconsistencies can quickly undermine trust.
According to a 2023 dbt Labs survey, 70% of data practitioners reported dealing with "multiple, conflicting definitions of key metrics" on a regular basis.
Querio addresses this issue by building a semantic layer that understands your business, allowing teams to define metrics like MRR, ARR, CAC, and net revenue retention just once. These definitions are then applied consistently across dashboards, AI-generated responses, and investor exports.
To get started, focus on 3–5 key metrics that often cause confusion (MRR and CAC are common culprits). Run a short workshop with teams like Finance, RevOps, and Product to agree on exact definitions. Then, encode these metrics in Querio, including the formula, base table, filters (e.g., plan_type = 'subscription'), and a plain-English description. A 2022 IDC study found that companies with a governed semantic layer are 2.3x more likely to have decision-makers who trust their BI metrics [2].
Use AI to Answer Questions in Plain English
Even with a solid data connection and well-defined metrics, investor questions often come as ad hoc requests - like in the middle of a board meeting or via a late-night email. That’s where Querio’s AI comes in.
You simply type a question in plain English - something like, "What was our net dollar retention for U.S. enterprise customers over the last four quarters?" - and Querio does the heavy lifting. It translates your question into accurate metrics, applies the correct filters, and generates SQL against your curated views. The best part? Every query is fully inspectable. Analysts can review, tweak, and approve the SQL before it’s shared in any investor-facing output. This ensures transparency while keeping your team in control.
This level of clarity is crucial during due diligence. If an investor questions a number, Querio lets you show exactly how it was calculated - from the query and source tables to the metric definition - all within the platform. What could have been a moment of doubt becomes an opportunity to build trust.
Automating Investor Workflows to Cut Response Times
Once your data is securely connected and metrics are standardized, automation can take things to the next level by speeding up investor response times. By removing the need for manual data gathering, automation shifts your approach from reacting to requests to anticipating them.
Build Prebuilt Dashboards for Common Investor Questions
Investor questions often follow predictable patterns. Topics like revenue growth, churn rates, CAC payback periods, and net revenue retention are regular fixtures. With Querio, you can create dashboards for these recurring questions, so your team doesn’t waste time pulling the same data repeatedly.
These dashboards are powered by your semantic layer, ensuring that the numbers match those in your board deck and data room. You can even include parameters like date ranges or customer segments, with flexible filters to adapt to specific needs. This creates a self-service tool capable of handling the majority of repetitive requests - up to 80% - automatically.
Investor Topic | Key Metrics to Include | Querio Feature to Use |
|---|---|---|
Revenue Growth | MRR, ARR, month-over-month growth | Live dashboard with date parameters |
Customer Health | Churn rate, net revenue retention, expansion MRR | Semantic layer + scheduled refresh |
Unit Economics | CAC, LTV, CAC payback period | Prebuilt dashboard with segment filters |
Engagement | DAU/MAU, feature adoption, retention cohorts | Reactive notebook with live data |
Use Reactive Notebooks for Complex Analysis
Not every investor query can be answered with a simple dashboard. Questions like why churn spiked in Q3 or the assumptions behind a cohort analysis often require more detailed explanations. That’s where Querio’s reactive notebooks shine.
Reactive notebooks combine SQL and Python in a single environment, automatically updating results when data or logic changes. They allow you to craft a complete narrative - complete with queries, charts, and written insights - that can be reused quarter after quarter without starting from scratch. If an investor follows up with a new question, you can adjust a parameter, and the entire analysis refreshes instantly. This makes handling one-off, complex requests much more manageable.
Schedule Reports and Keep Dashboards Up to Date
Querio’s scheduling tools eliminate the need for manual report delivery. Reports can be sent directly to stakeholders’ inboxes on a daily, weekly, or monthly basis, ensuring investors always have the latest data.
"The real game-changer is freeing your team from repetitive tasks. Instead of compiling data, they can focus on high-value work like variance analysis, forecasting, and strategic planning." - Querio Blog [2]
Additionally, you can embed live Querio dashboards into your investor data room using an iframe or API. This gives investors 24/7 access to real-time metrics without requiring them to log into your internal tools. AI reporting tools have been shown to reduce report creation times by 70–90% on average [1], while automated reporting minimizes errors in complex calculations by up to 90% [2]. Combining these automation strategies with a solid BI foundation ensures you can consistently deliver accurate, real-time data to your investors.
Maintaining Data Governance and Accuracy
Speed matters, but accuracy and security are just as important. Sending incorrect data - or accidentally exposing sensitive information - can erode trust at the worst possible time. According to a Deloitte survey, 33% of deals faced delays or value adjustments due to data quality or access issues discovered late in the process [3]. That's a risk you can't afford to overlook.
Protect Sensitive Data During Due Diligence
Investors need enough data to assess your business, but they don’t need unrestricted access to sensitive details like customer records, payroll information, or personally identifiable information (PII). Querio addresses this with role-based access control (RBAC) and field-level security, allowing you to create an investor-specific role that shares only pre-approved, aggregated insights. For example, investors can see summaries like "Active customers by segment over the last 12 months" without accessing individual customer records.
For fields that are partially sensitive, dynamic data masking can hide usernames while keeping domains visible. This approach maintains the analytical value of the data without compromising individual identities. On top of this, Querio's audit logs document every query and dashboard access, providing a clear trail of who accessed what and when. This level of traceability aligns with U.S. privacy standards like CCPA and industry-specific regulations such as HIPAA and GLBA. It also reflects the SOC 2 controls that seasoned investors increasingly expect from scaling companies.
Once sensitive data is secured, the next priority is ensuring the accuracy of the information shared with investors.
Set Up a Validation and Review Process
Before sharing data, it’s essential to run it through a structured review process. Start with an analyst pulling metrics from the live data warehouse. A finance lead should then cross-check these numbers against internal dashboards. Finally, leadership can review the narrative to ensure it aligns with the data. To avoid confusion, establish naming conventions - like prefixing dashboards with APPROVED_ - to clearly distinguish finalized versions from drafts.
Reactive notebooks can simplify this process by allowing reviewers to comment on both the figures and the accompanying narrative in one place, reducing the need to juggle multiple files or spreadsheets. Once the data is validated, document any updates to metric definitions to maintain consistency moving forward.
Version and Document Key Metric Definitions
Querio’s shared context layer ensures that each key metric is defined once, with clear documentation on its formula, data sources, ownership, and any exclusions. For instance, you might note that "Logo churn excludes customers below $500 MRR". If a metric definition changes, record what was updated, why the change was made, who approved it, and the date it takes effect. By linking each fundraising round to a specific version snapshot - like Series_B_Definitions_2026Q1 - you can always provide investors with the exact logic behind the numbers. This transparency minimizes misunderstandings and builds trust.
Governance Practice | How Querio Supports It | Why It Matters |
|---|---|---|
Field-level access control | RBAC + data masking per investor role | Prevents exposure of PII and sensitive data |
Audit logging | Tracks every query and dashboard access | Facilitates compliance and incident response |
Metric validation | Centralized semantic layer for cross-checking | Resolves inconsistencies across reports |
Versioned definitions | Shared context with changelogs and timestamps | Keeps investors aligned across funding rounds |
Conclusion: Responding to Investors Faster and with More Confidence
Handling investor data requests doesn't have to be a time-consuming ordeal. By clarifying requests upfront, organizing your data effectively, and prioritizing analysis over data collection, you can turn what used to be a 3-day scramble into a 30-minute task.
Key Takeaways
The strategies outlined here work seamlessly as a system:
Clarify upfront: Understanding the exact request before diving into the data prevents unnecessary rework.
Use templates: Standardized templates save time by allowing you to refresh existing work instead of starting from scratch.
Leverage live connections: A direct connection to your data warehouse ensures investors always see up-to-date numbers, not outdated exports.
Governed semantic layer: This ensures that metrics remain consistent and accurate across all decks, dashboards, and emails.
Governance plays a bigger role than just meeting compliance requirements. In fact, 64% of institutional investors consider the timeliness and consistency of management disclosures crucial for their investment decisions. Delivering accurate, well-documented data quickly demonstrates operational efficiency and builds trust.
These strategies are not just theoretical - they offer a clear path to immediate improvements with Querio.
Next Steps with Querio
Ready to streamline your investor responses? Here's how to get started with Querio:
Identify your most frequent investor request - whether it's monthly revenue, retention figures, or unit economics.
Build that request once in Querio, connecting it directly to your live data warehouse.
Work with your finance team to validate the output, finalize metric definitions, and replace static exports with a governed dashboard link.
Once this workflow is in place, expanding your investor data room becomes a breeze. With Querio's AI handling tasks like querying, charting, and drafting, your team can focus on reviewing and presenting. This collaboration transforms investor responses from a multi-day process into a matter of minutes.
FAQs
What’s the fastest way to standardize metrics like ARR and CAC?
The quickest way to align metrics like ARR (Annual Recurring Revenue) and CAC (Customer Acquisition Cost) is by leveraging an AI-driven business intelligence platform that automates calculations straight from your data sources. With Querio, you can simply ask questions in plain English, such as "What is our ARR?" or "What is our CAC?" The platform provides accurate, real-time metrics instantly, cutting out manual errors, ensuring consistency, and dramatically speeding up the entire process.
How do I share real-time investor dashboards without exposing sensitive data?
Querio simplifies secure sharing of real-time investor dashboards by bringing all insights into a single, unified workspace. Instead of juggling multiple dashboards, team members can simply ask questions in plain English and receive instant, live answers. With role-based access controls and integrations with platforms like Snowflake and BigQuery, Querio ensures sensitive data stays protected while sharing only the most relevant, up-to-date information with investors.
What review steps should we use before sending investor-facing numbers?
To ensure numbers presented to investors are accurate and dependable, here’s what you should do:
Validate Data Accuracy: Employ automated tools to identify errors and maintain data quality. This reduces the risk of human mistakes slipping through.
Ensure Real-Time Updates: Keep your data current by integrating live sources, ensuring investors always see the most up-to-date information.
Standardize Metrics: Use a centralized system to ensure consistency across all reports and presentations, eliminating discrepancies.
Check Governance: Confirm that access controls are in place and compliance standards are met to protect sensitive data.
Automate Final Checks: Rely on AI-driven tools to handle routine validations before sharing data, saving time and ensuring precision.
Related Blog Posts