Business Intelligence
10 AI-Powered BI Tools: A Fact-Based Comparison Matrix (2026)
A factual comparison of 10 AI-powered BI platforms covering features, AI capabilities, integrations, usability, and pricing to help choose the right tool.
AI-powered BI tools are transforming how businesses analyze data in 2026. These platforms now empower users to ask questions in plain English, generate SQL queries, and deliver actionable insights instantly - no coding required. This article evaluates 10 top BI tools based on features, usability, integration, cost, and AI-driven functionalities.
Key Takeaways:
Querio: Best for modern data warehouses with transparent AI outputs and flat-fee pricing.
Microsoft Power BI: Affordable, integrated with Microsoft tools, but requires DAX expertise for advanced use.
Tableau: Advanced visualizations and AI tools but has a steep learning curve and high costs.
Qlik Sense: Dynamic data exploration and predictive modeling, though pricing can be complex.
ThoughtSpot: Intuitive search-based analytics but demands upfront data preparation and is expensive.
Looker: Strong governance and Google Cloud integration; requires LookML expertise.
Domo: All-in-one BI with mobile-first design; costs rise with user count.
Sisense: Developer-friendly with custom analytics; setup and pricing may deter smaller teams.
Tinybird: Real-time data processing for developers; limited traditional BI features.
Superset: Open-source, SQL-focused, ideal for technical teams but lacks advanced AI tools.
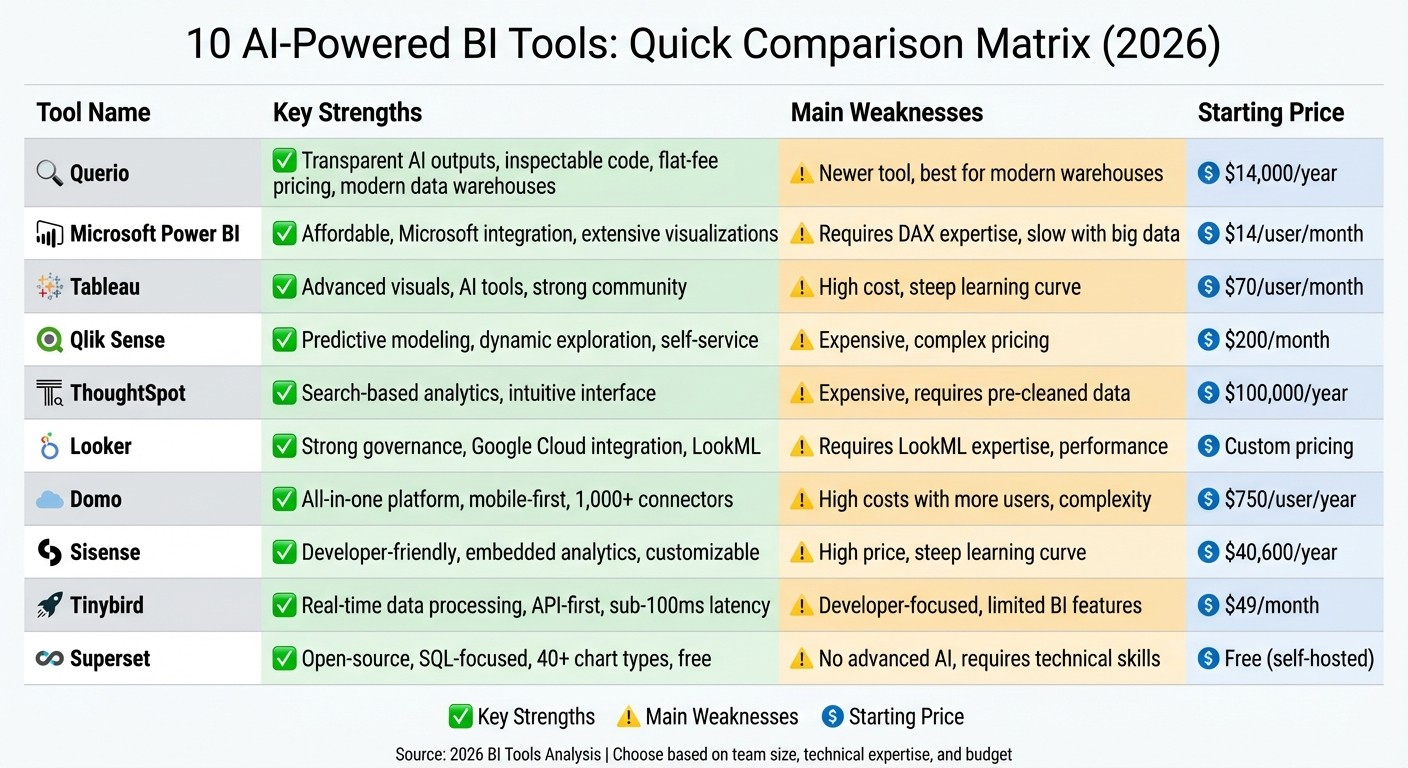
Quick Comparison:
Tool | Strengths | Weaknesses | Starting Cost |
|---|---|---|---|
Querio | Transparent AI, inspectable code, flat fee | Newer tool, best for modern data warehouses | $14,000/year |
Power BI | Affordable, Microsoft integration | Requires DAX expertise, slow with big data | $14/user/month |
Tableau | Advanced visuals, AI tools | High cost, steep learning curve | $70/user/month |
Qlik Sense | Predictive modeling, self-service analytics | Expensive, complex pricing | $200/month |
ThoughtSpot | Search-based, intuitive | Expensive, requires pre-cleaned data | $100,000/year |
Looker | Strong governance, Google integration | Requires LookML expertise, performance issues | Custom pricing |
Domo | All-in-one, mobile-first | High costs with more users | $750/user/year |
Sisense | Developer-friendly, embedded analytics | High price, steep learning curve | $40,600/year |
Tinybird | Real-time data, API-first | Developer-focused, limited BI features | $49/month |
Superset | Open-source, SQL-focused | No advanced AI, requires technical skills | Free (self-hosted) |
Conclusion: Querio stands out for its AI-first approach with transparent outputs and predictable pricing, making it a strong choice for modern organizations. Each tool has unique strengths and limitations, so the best option depends on your team's needs, technical expertise, and budget.
10 AI-Powered BI Tools Comparison: Features, Pricing, and Strengths (2026)
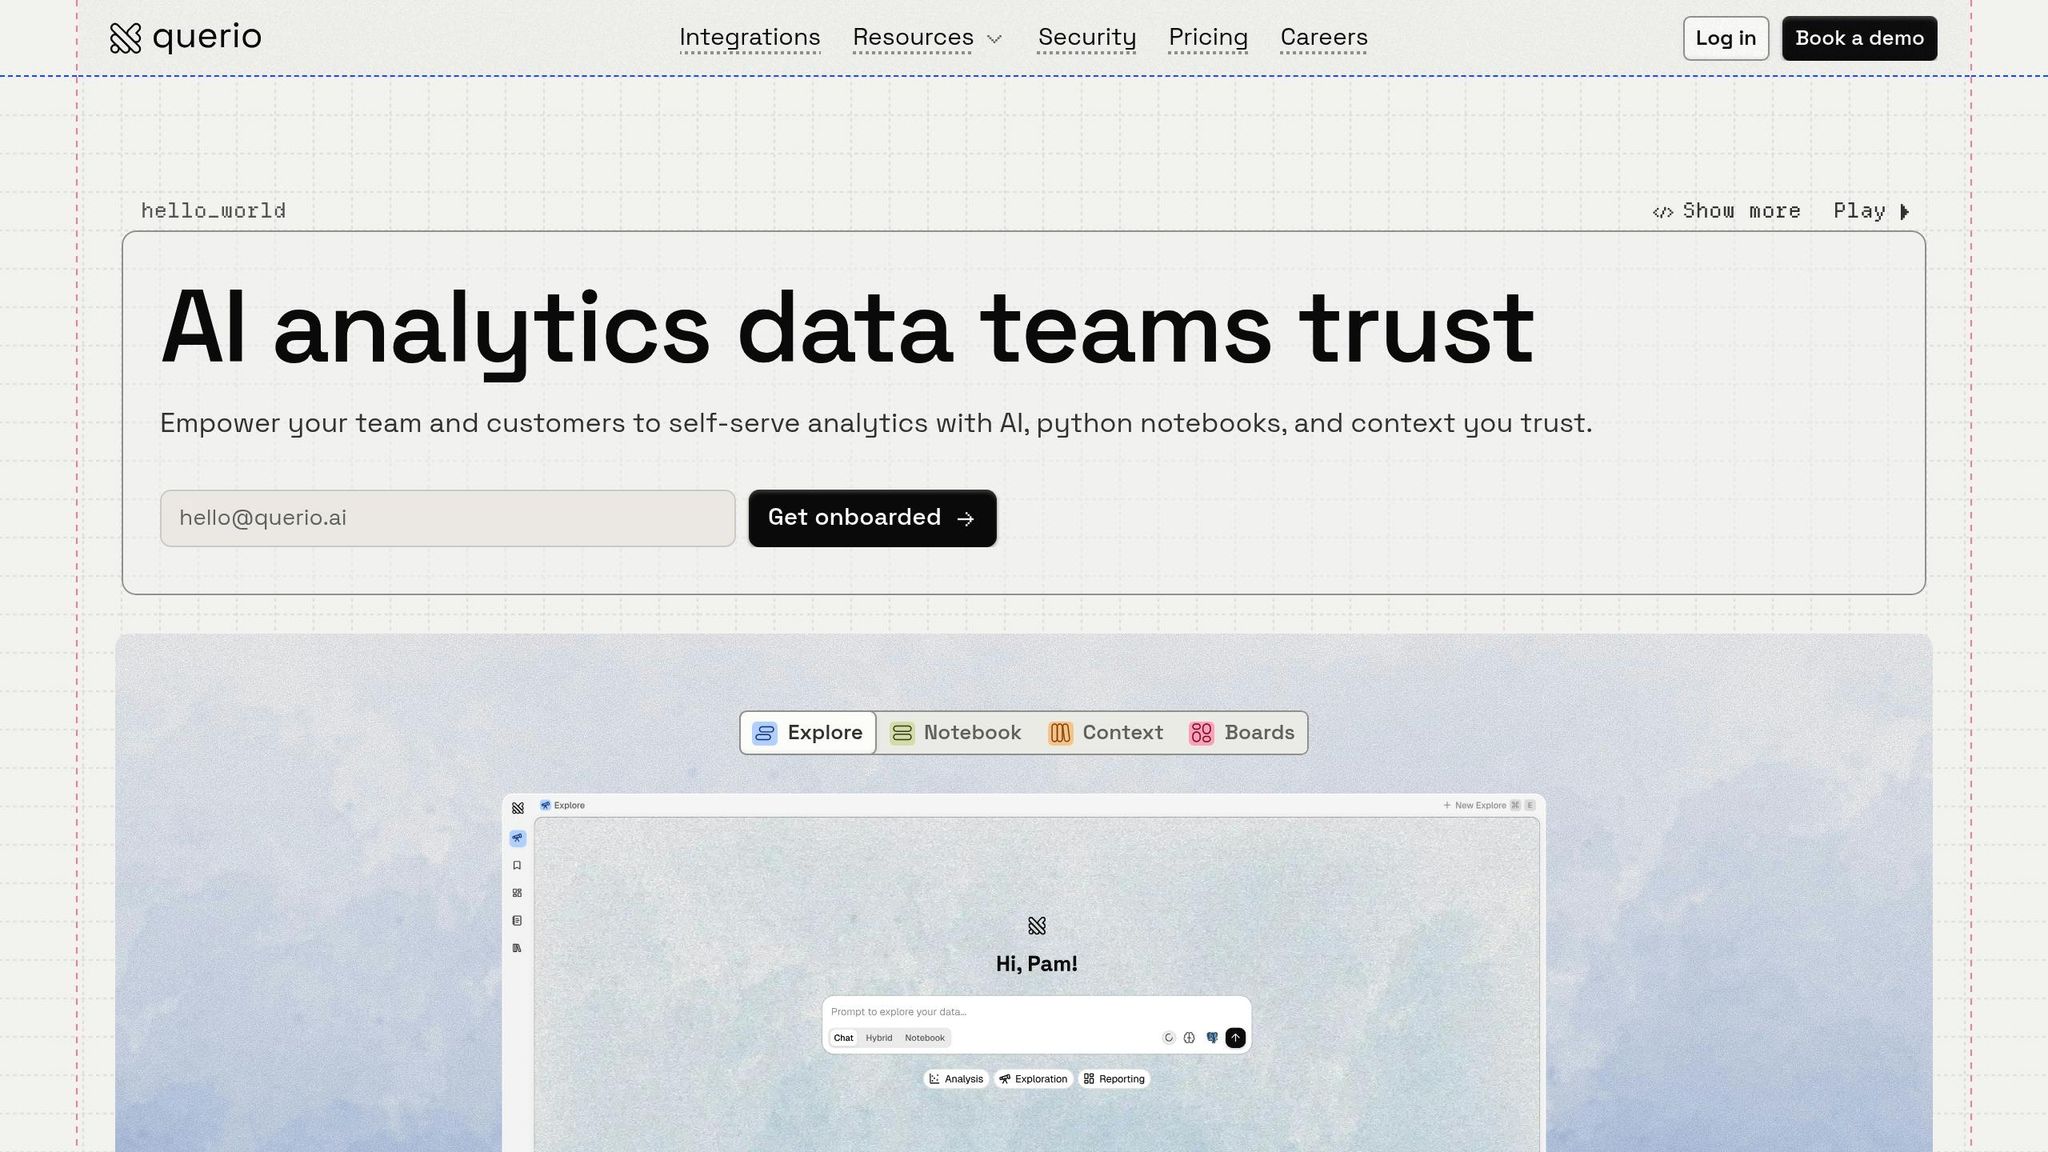
1. Querio
Features
Querio connects directly to your data warehouse - whether you use Snowflake, BigQuery, Postgres, or others - through live, read-only connections. This approach avoids duplicating data and ensures real-time insights. The platform translates natural language questions into SQL and Python code that you can inspect, modify, and audit. Each response comes with transparent, editable code, giving you full control. Additionally, Querio includes a shared semantic layer, where teams can define metrics, joins, and business terms once, ensuring consistent definitions across dashboards, analyses, and embedded applications. This setup simplifies workflows and strengthens data governance.
Usability
Querio offers a reactive notebook environment that is user-friendly for both analysts and business teams. Analysts can type plain English questions and instantly receive SQL- or Python-generated answers, while data teams can review the code for deeper insights. The notebook format encourages collaboration and iteration, automatically refreshing results when logic changes. This makes it easy for business users to explore data independently while maintaining the rigor data professionals require.
Integration Capabilities
Querio works seamlessly with leading data warehouses like Google BigQuery, Snowflake, Amazon Redshift, and ClickHouse, as well as relational databases such as PostgreSQL, MySQL, MariaDB, and Microsoft SQL Server. It also supports embedded analytics via APIs and iframes, allowing teams to reuse governed logic in customer-facing applications. With standard SSO integrations and SOC 2 Type II compliance, Querio delivers enterprise-grade security and simplifies access management.
Cost
Querio uses a flat-fee pricing model that includes unlimited viewer users, ensuring predictable costs as your analytics needs grow. The core platform starts at $14,000 per year, covering one database connection, 4,000 monthly prompts, and unlimited viewers. Optional add-ons include dashboards for $6,000, additional database connections for $4,000, and data pipelines for $10,000 (up to three pipelines). For organizations needing on-premise deployment, a self-hosted option is available starting at $60,000+, with a 50% premium.
AI-Driven Functionalities
Querio leverages AI Python agents to handle complex analyses through conversational queries, going beyond basic SQL generation. Its context layer ensures that AI-generated metrics are consistent and governed across the organization, functioning as a "single source of truth." Every AI output is fully audit-ready, with visible and editable code, enabling data teams to verify and refine results. This combination of advanced automation and human oversight makes Querio ideal for environments where precision and accountability are critical.
2. Microsoft Power BI
Features
Microsoft Power BI has transformed from a simple dashboard tool into a platform for "enterprise decision intelligence." It integrates analytics directly into workflows across Dynamics 365, Microsoft 365, and Azure AI, making it a seamless part of business operations [12]. The platform connects to virtually any data source - whether on-premises or cloud-based - and supports both hybrid and cloud deployments through Power BI Report Server and Microsoft's global data centers [11]. It also features AI-powered visuals like Key Influencers, Decomposition Trees, and anomaly detection, which use machine learning to uncover data insights without requiring users to write code [6]. Additionally, its built-in AutoML allows users to build and train models for tasks like predicting churn or detecting fraud directly within dataflows [6].
Usability
Power BI offers a layered Copilot experience tailored to different user needs. This includes a full-screen agent for broad analysis, a report-pane for quick insights, and an app-specific version for curated executive overviews [6][8]. Copilot can create entire report pages, explain complex DAX measures, and even draft narrative summaries for executive presentations [6][8]. As of December 2026, Power BI Q&A will be phased out, with Copilot fully replacing it [7][9]. Developers are encouraged to use clear, business-friendly naming conventions for data tables and columns and enable the "Approved for Copilot" setting to optimize usability [6][7][8].
Integration Capabilities
Power BI stands out for its seamless integration across Microsoft's ecosystem. It works effortlessly with Teams, SharePoint, and PowerPoint, allowing users to access insights without leaving their workflows [11][12]. Its deep connection with Dynamics 365 ensures analytics are always aligned with real-time operational data, while integration with Microsoft Purview and Defender for Cloud Apps strengthens data governance and security [11]. A commissioned Forrester study highlighted a 379% ROI for organizations using Microsoft Fabric, which Power BI supports [11]. The platform also enforces security measures like Row-Level Security, Column-Level Security, and dataset-level access rules during AI interactions. However, it currently lacks a feature to share ad-hoc DAX queries as reusable components in a semantic layer [13]. These integrations make Power BI a highly scalable and efficient option for modern businesses.
Cost
Power BI offers both per-user and capacity-based pricing models to suit different needs. The per-user options include Free, Pro at $14/month, and Premium Per User at $24/month. Capacity-based pricing starts with Fabric F SKUs at $262/month and Premium P SKUs at $4,995/month [14][15][16]. Microsoft is steering organizations toward Fabric Capacity for new deployments, citing its lower entry costs and scalability [14]. For example, in January 2026, a mid-sized organization reduced its monthly costs by 69% by combining 50 Pro licenses with Fabric F8 capacity compared to an all-Pro setup [14]. AI features like Copilot require at least Fabric F2 or Power BI Premium P1 capacity and are billed based on token usage [8]. Organizations with Microsoft 365 E5 licenses can access Power BI Pro at no additional cost [14][15].
AI-Driven Functionalities
Power BI's AI capabilities take analytics to the next level. Copilot uses natural language commands to handle tasks like filtering, aggregating, time comparisons, and ranking [13]. It can generate full report pages, complete with summaries and visualizations, based on conversational prompts [13]. The platform also provides Verified Answers to standardize responses to frequent business queries, ensuring consistency [6][8]. Additionally, it suggests synonyms and identifies linguistic relationships to better interpret industry-specific terms [9][10]. Accessing AI tools like Copilot requires a minimum of Fabric F2 or Premium P1 capacity, with charges based on token consumption [8][13]. To maintain focus during analysis, users are advised to clear chat history when switching topics [8].
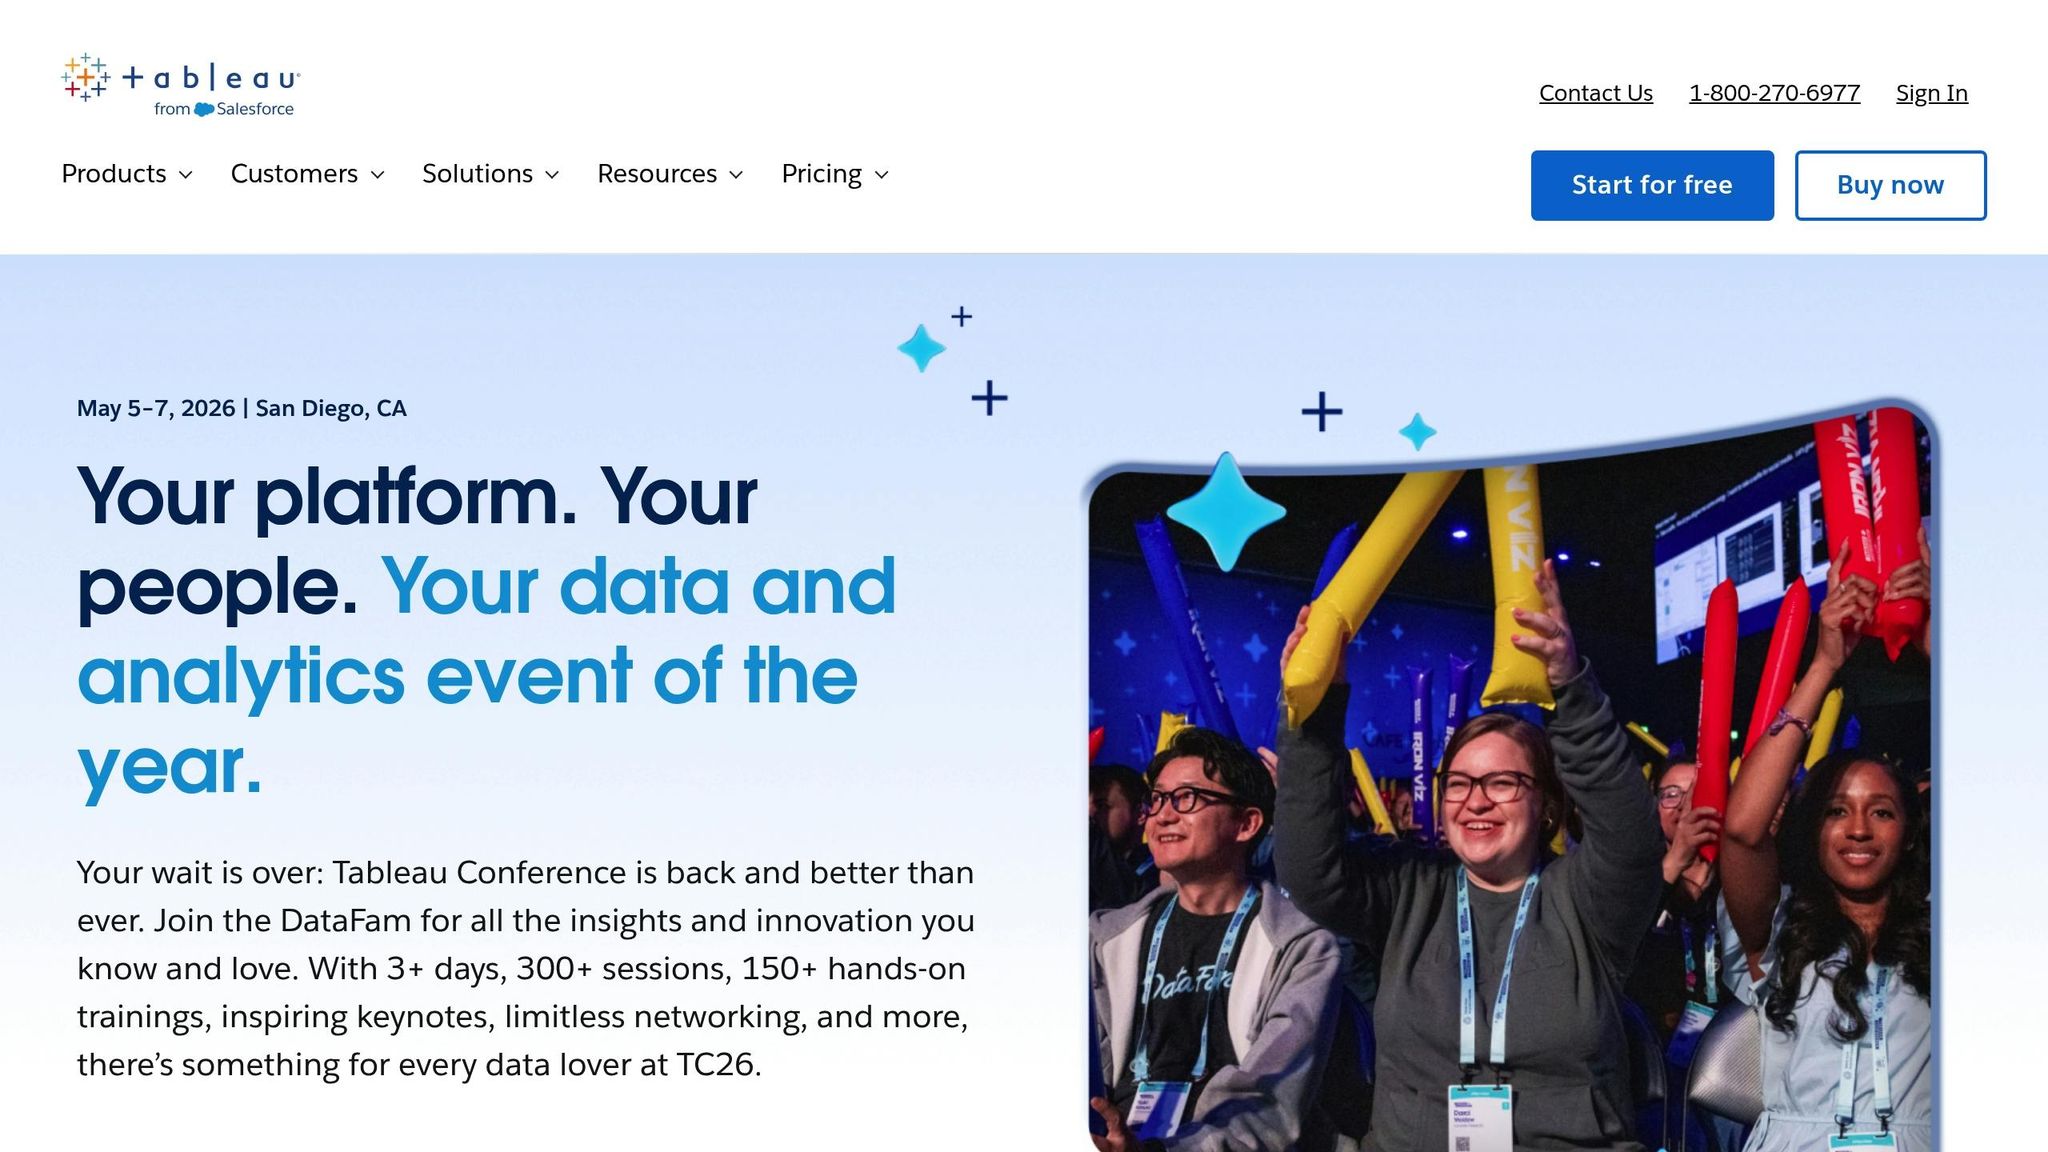
3. Tableau
Features
Tableau goes beyond traditional dashboards with its AI-powered analytics platform. One of its key highlights is Einstein Copilot, an embedded assistant that guides users by suggesting analysis steps, recommending visualization types, and offering clear explanations of insights. Meanwhile, Tableau Pulse uses generative AI to deliver personalized insights and automated summaries directly into tools like Slack and Microsoft Teams [17][18][19]. Another standout is Agentic Analytics, enabled through Salesforce's Agentforce integration, which automates tasks like data preparation, visualization, and semantic modeling [18][5]. Additionally, Tableau Prep helps users clean data by suggesting transformations, flagging quality issues, and recommending fixes [17][19]. Security is a top priority with the Einstein Trust Layer, ensuring data privacy and governance while using AI-driven features [19][5]. Beyond these technical capabilities, Tableau emphasizes user-friendly design for smoother interactions.
Usability
Tableau's AI tools significantly speed up dashboard creation - reportedly by 2–3 times [17]. This is especially valuable since about 70% of employees currently avoid using data tools for decision-making [22]. Users can simply describe the dashboard they need in text, and the AI generates a draft with multiple views and filters, which can then be manually refined [17][20]. Despite these advancements, Tableau retains a steep learning curve for mastering its advanced features, earning it a 7/10 ease-of-use rating [17]. For executives and non-technical users, Tableau Pulse offers an easier starting point by delivering key metrics without requiring navigation through complex dashboards [17][18]. To improve accuracy, companies are encouraged to utilize Tableau's Data Index, which helps the AI understand business context through detailed field captions and descriptions [20].
Integration Capabilities
Tableau excels in integrating with a wide range of data sources, making it a versatile choice for businesses. It seamlessly connects with the Salesforce ecosystem, offering unified insights across sales and marketing workflows. Native connectors are available for everything from spreadsheets to warehouse-native data analysis tools like Snowflake and BigQuery, as well as legacy on-premises systems. Its data blending feature allows users to merge multiple data sources into a single interactive dashboard without requiring complex backend engineering. Tableau's strong presence in enterprise environments is reflected in its estimated 30–36% share of the global BI market by 2026 [5]. Integration with Salesforce Data Cloud and Agentforce ensures consistent security policies across Salesforce tools [17][5].
Cost
Tableau's AI features are included in the Tableau+ subscription, which starts at $70 per user per month for Creator licenses [17]. For more advanced capabilities, the Enterprise Creator tier (Tableau Next) is available at around $115 per user per month but often requires additional credits for Agentforce or Data Cloud [5][21]. Standard licenses range from $15 to $75 per user per month, depending on the role - Viewer, Explorer, or Creator - though these typically lack advanced AI functionalities [21]. To unlock the full range of AI-driven features, organizations must opt for the Tableau+ subscription [17][5]. A 14-day free trial is available for those who want to explore the platform before committing [17].
AI-Driven Functionalities
Tableau's AI capabilities are designed to make analytics more intuitive and actionable. Einstein Copilot provides clear explanations for metric changes, while Tableau Pulse monitors activity and sends alerts, such as notifying users that "Website traffic dropped 40%" and offering potential root causes [17][22]. The platform also includes task-specific AI agents like Concierge for root cause analysis, Inspector for monitoring, Data Pro for data preparation, and Tableau Pulse for summarizing insights [18][5]. According to Gartner, the integration of task-specific AI agents in enterprise applications is expected to grow from less than 5% in 2025 to 40% by the end of 2026 [5]. By default, these AI features are turned off and must be activated by a site administrator in Tableau Cloud or Server settings [19]. As of February 2026 (version 2025.1), Tableau AI supports additional languages beyond English (US) [19].
4. Qlik Sense
Features
Qlik Sense stands out with its associative engine, which allows users to explore data in a non-linear way, uncovering patterns that might otherwise remain hidden. The platform’s Insight Advisor uses natural language processing (NLP) to create visualizations from simple text-based queries. It also incorporates Qlik AutoML for predictive modeling, Qlik Answers to extract insights from unstructured data, and a Discovery Agent that actively scans datasets to identify risks and opportunities. These tools combine to create a user-friendly and powerful analytics experience.
Usability
Qlik Sense is designed for ease of use, making data exploration straightforward even for those without a technical background. The platform simplifies the process by automatically suggesting visualizations based on user inputs. Many companies start with its SaaS deployment to quickly access features like Qlik Answers and then expand to more complex setups as needed. This approach ensures that even advanced AI tools are accessible to all users, regardless of their technical expertise.
Integration Capabilities
Qlik Sense supports seamless integration with a variety of enterprise systems and data sources. Its compatibility spans modern cloud-based data warehouses and older, on-premises databases, ensuring flexibility for diverse IT environments. Additionally, its embedded analytics capabilities allow businesses to integrate Qlik’s visualizations directly into their own applications, enhancing usability and functionality.
Cost
Qlik Sense offers a tiered pricing structure for its cloud solutions:
Starter Plan: $200 per month, covering basic visualization tools.
Standard Plan: $825 per month, which includes the Insight Advisor and support for up to five data sources.
Premium Plan: $2,750 per month, offering advanced analytics and unlimited data sources.
Enterprise Plan: Custom pricing tailored for organizations needing embedded analytics and service-level agreements (SLAs).
For large-scale deployments, capacity-based pricing options are also available, providing flexibility for enterprise needs [23].
AI-Driven Functionalities
Feature | Functionality | Business Benefit |
|---|---|---|
Insight Advisor | NLP/NLG-based visual generation | Simplifies analytics for non-technical users |
Qlik AutoML | Predictive and scenario modeling | Empowers strategic planning and forecasting |
Qlik Answers | AI for unstructured data analysis | Extracts insights from PDFs, emails, and more |
Associative Engine | Enables non-linear data exploration | Reveals patterns missed by traditional queries |
Discovery Agent | Proactively scans datasets | Detects risks and opportunities automatically |
Qlik Sense’s AI-driven tools make data analytics more approachable and proactive. Features like the Discovery Agent provide continuous monitoring to surface insights without manual input, while Qlik Answers extends AI capabilities to unstructured data, such as documents and emails. These functionalities ensure businesses can make informed decisions faster and with greater confidence.
5. ThoughtSpot
Features
ThoughtSpot is reshaping how businesses interact with data through its search-first analytics approach. Instead of requiring users to navigate complex dashboards or learn query languages, the platform allows them to type questions in plain English - just like using a search engine. Powered by Spotter AI (formerly Sage), ThoughtSpot interprets these queries by understanding table relationships and applying filters. It connects directly to cloud data warehouses like Snowflake, BigQuery, and Redshift, enabling live querying without needing data extracts or pre-aggregations. For industries that demand transparency, the Answer Explainer feature breaks down how calculations are performed and which data fields are used. Additionally, SpotIQ continuously analyzes data, identifying trends or anomalies and sending alerts like, "Customer acquisition cost increased 40% last month."
Usability
ThoughtSpot scores an impressive 9/10 for ease of use[24]. It’s designed so users without SQL knowledge or specialized training can still extract meaningful insights. The introduction of Spotter 3 in 2026 added the ability to handle multi-step analyses and even pull data from external platforms like Slack or Confluence during ongoing conversations. Meanwhile, the Spotter Coach feature allows users to refine AI-generated answers, improving accuracy over time with human feedback. However, the platform does require some upfront effort - data teams need to prepare curated worksheets, synonyms, and metadata descriptions to ensure accuracy. This preparation phase might make it less appealing for smaller organizations with limited resources, but for larger teams, the user-friendly design and robust functionality are worth the investment.
Integration Capabilities
ThoughtSpot excels at integrating with a variety of tools and systems. A single search can span multiple data sources, including CRM, ERP, and marketing platforms like Google Analytics. Its Smart Apps feature goes a step further by automating actions directly from insights - think updating Salesforce records or sending Slack notifications straight from the analytics interface. For SaaS companies, ThoughtSpot Embedded provides a low-code way to incorporate search-driven analytics into their own products, saving significant development time compared to building custom solutions from scratch.
Cost
ThoughtSpot’s pricing is aimed at large enterprises, with annual commitments starting at over $100,000[24]. This pricing model makes it a better fit for organizations with 500+ employees managing extensive data sets. While it may be too steep for smaller teams, the cost reflects the platform's advanced AI capabilities and automation features.
AI-Driven Functionalities
Feature | Functionality | Business Benefit |
|---|---|---|
Spotter AI | Interprets raw data context and relationships | Simplifies querying across billions of rows |
SpotIQ | Automated insight detection and alerts | Uncovers trends and anomalies proactively |
Answer Explainer | Provides full data lineage and calculation transparency | Meets audit standards in regulated industries |
Spotter Coach | Human-in-the-loop refinement | Enhances AI accuracy through user feedback |
Smart Apps | Automates actions from insights | Triggers workflows in platforms like Salesforce |
With a perfect 10/10 rating for features[24], ThoughtSpot represents a shift toward more dynamic, self-service analytics. Its AI-driven tools not only suggest relevant questions based on data context but also explain anomalies before users even think to ask. This proactive approach reduces reliance on static dashboards, lightens the load on data teams, and empowers enterprises to turn insights into action more efficiently.
6. Looker
Features
Looker stands out with its API-first design, which prioritizes data governance and smooth integration into custom applications. A key component of Looker is LookML, a semantic layer that centralizes metrics, calculations, and data models, ensuring consistency across integrations. Through Looker Studio, the platform connects to over 1,000 data sources and offers Looker Blocks - pre-built schemas for applications like Gmail, Drive, and Meet - making implementation faster. For Google Cloud users, Looker integrates effortlessly with tools like BigQuery and Vertex AI, allowing users to create custom AI workflows directly within the analytics environment.
Usability
Looker’s governance model ensures data consistency and accuracy, but its reliance on LookML demands ongoing code maintenance. This can slow down self-service options for less technical users. To bridge this gap, Looker incorporates conversational AI analytics tools like Gemini, enabling users to interact with data through natural language queries. Additionally, Visualization and Formula Assistants simplify the creation of custom charts and calculated fields using plain text descriptions. Despite these features, 38% of G2 reviewers in 2025 noted challenges with performance, including slow dashboard load times and instability when working with large datasets [26].
Integration Capabilities
Looker’s semantic layer ensures data remains consistent across platforms, while its multicloud support and dedicated Marketplace make cross-environment setups easier. This multicloud compatibility allows enterprises to efficiently manage costs across hybrid or multicloud infrastructures. In recognition of its capabilities, Gartner named Google (Looker) a Leader in the 2025 Magic Quadrant for Analytics and Business Intelligence Platforms [25].
Cost
Looker’s pricing is based on an annual commitment model, with three main editions:
Standard Edition: Designed for smaller teams (under 50 users), offering one production instance, 10 standard users, and 2 developer users.
Enterprise Edition: Adds advanced security features and supports up to 100,000 query-based API calls per month.
Embed Edition: Geared toward external analytics and custom applications, allowing up to 500,000 query-based API calls monthly.
Licenses are role-based, divided into Developer, Standard, and Viewer tiers. Exact pricing details are available through sales, and the platform primarily targets mid- to large-sized enterprises.
AI-Driven Functionalities
With the help of Google’s Gemini models, Looker integrates AI-powered tools throughout its platform. One standout feature is the experimental Code Interpreter, which converts natural language into Python for advanced tasks like forecasting and anomaly detection. Notably, these AI features are exclusive to core or enterprise licenses and are not included in the free Looker Studio version. Peter Bailis, VP of Engineering at Google Cloud, highlighted:
"Looker's unique foundation is its semantic layer, which ensures everyone works from a single source of truth" [27].
These AI-driven tools underscore Looker’s focus on delivering precise and transparent analytics tailored to enterprise needs.
We Tested 5 Business Intelligence Tools So You Don't Have To - Here's What Actually Works in 2025
7. Domo
Domo takes a comprehensive approach to business intelligence by combining multiple tools into a single, cloud-based platform.
Features
Domo is a fully cloud-native solution that integrates ETL, data visualization, and custom app creation into one package. This eliminates the hassle of juggling multiple tools [29]. With over 150 native chart types, including Gantt charts and maps, it offers diverse options for presenting data [29]. One of its standout features is Personalized Data Permissions (PDP), which ensures users only see data relevant to their roles by controlling access at the row level [28].
Usability
Domo's mobile-first design makes it a favorite for executives who need real-time access to dashboards on their phones [29]. Its drag-and-drop "Analyzer" interface is user-friendly, allowing non-technical users to create dashboards and "cards" with ease [29][32]. By integrating ETL, dashboard creation, and app-building tools, Domo reduces the need to rely on separate systems [32].
Integration Capabilities
Domo supports over 1,000 connectors, making it easy to integrate with third-party SaaS tools [28][29]. It also allows organizations to "Bring Your Own Model" (BYOK), connecting external AI providers like OpenAI or Anthropic securely into data workflows [28][30]. However, one limitation is the lack of a centralized, code-based semantic modeling layer. This means metrics often need to be defined individually within specific cards or dataflows, unlike platforms like Looker [32].
Cost
Domo’s pricing is based on a consumption model combined with a base fee of $750 per user annually [29]. Small businesses generally spend around $30,000 per year, while enterprise costs can range from $50,000 to over $200,000 annually [29][31]. Many users find the pricing both high and somewhat unclear, which remains a frequent concern [32].
AI-Driven Functionalities
Domo leans heavily into AI with features like AI Agents and AI Chat for conversational data exploration [28][29]. The AI Chat Agent enables users to interact with complex datasets conversationally, offering instant visualizations, alerts, and actionable suggestions. Tools like AI SQL and Beast Mode Assistants simplify the creation of SQL queries and calculated fields from natural language inputs. The DomoGPT suite provides private models within the Domo Cloud for secure data interactions, including chat, query, and summarization capabilities. It also includes FileSets, which transform unstructured data - like images and documents - into actionable insights for AI-driven analysis.
8. Sisense
Sisense is an API-first platform designed for developers, enabling analytics to be embedded directly into applications. Using powerful SDKs for React, Angular, and Vue, developers can build analytics as code with ease [33]. This review dives into its features, usability, integration options, pricing, and AI functionalities.
Features
Sisense stands out with its technical capabilities and adaptability. Its ElastiCube Engine ensures fast and concurrent data processing [34]. The platform includes granular governance controls, such as row-level and column-level security, multi-tenant isolation, and comprehensive audit logging [33]. The white-labeling options allow seamless integration through CSS/JS hooks and customizable components [33]. Additionally, Sisense is cloud-agnostic, supporting connections to both cloud-based and on-premise data sources via built-in ELT and a semantic layer [33].
Usability
Sisense caters to both developers and business users by offering code-based tools alongside no-code options [34]. For non-technical users, the drag-and-drop interface includes features like grid snapping, a template gallery, and interactive design previews [33]. According to user feedback, this flexibility simplifies dashboard creation and enables real-time publishing without compromising on security.
Integration Capabilities
Sisense integrates smoothly with existing systems, thanks to its robust APIs and SDKs (JS, Python, REST). It supports over 150 native chart types and offers a marketplace for third-party plugins [33][34]. Integration options include iFrames, a REST API, and the Compose SDK for modern web frameworks [34]. However, limitations exist: the AI Assistant cannot manage calculated fields or retain query history, and white-labeling features are restricted in lower-tier plans [34].
Cost
Sisense operates on a custom pricing model based on factors like user count, data size, hosting type, and usage [34]. Estimated yearly costs are as follows:
Essential Plan: $40,600–$60,000
Advanced Plan: $69,600–$138,000
Pro Plan: $109,000–$327,000 [34].
While its pricing might be steep for smaller organizations, the platform offers robust capabilities for those who can invest [34].
AI-Driven Functionalities
Sisense Intelligence provides an AI assistant for natural-language queries, automated narratives, and integration of custom machine learning models [33][34]. The platform supports "Bring Your Own Model" (BYO-model) functionality, allowing businesses to integrate their own data science workflows [33]. Tanya du Plessis, Chief Data Strategist at Bioforum, shared:
"With Sisense's AI capabilities, we are able to easily translate complex data, streamline interpretation (identifying gaps and trends in the data), and identify key impacts with speed that is changing the way we can react... during clinical trials" [33].
9. Tinybird
Tinybird transforms the way businesses approach real-time analytics by acting as a dedicated serving layer for high-speed query processing. It works seamlessly with popular visualization tools like Tableau and Power BI, allowing users to keep their preferred dashboards while benefiting from faster data insights.
Features
Tinybird’s headless architecture separates metrics from visualization, so you only need to define metrics once for use across dashboards, APIs, and apps. It supports real-time data streaming from sources like Kafka, Amazon S3, Google Cloud Storage, webhooks, and HTTP. This eliminates the need to wait for batch updates, ensuring data is always up-to-date.
One standout feature is its Instant SQL APIs, which turn SQL queries into production-ready HTTP endpoints. These endpoints come with built-in authentication, rate limiting, and documentation. Tinybird also uses a Metrics as Code approach - transformations are created using SQL-based "Pipes" and managed with Git for version control and CI/CD workflows. Powered by ClickHouse, it delivers lightning-fast query responses, even with massive datasets containing billions of rows, achieving sub-100ms latency [2].
Usability
Tinybird is built with developers in mind. It offers CLI-first workflows, a TypeScript SDK with full type inference, and zero-copy branching, making it easy to test changes using production data. These tools allow teams to deploy production-ready APIs in less than an hour [2].
Malu Soares, Software Engineer at Framer, praised the platform:
"My quality of life building with Tinybird was great. It was just so easy to develop." [37]
The platform handles impressive volumes of data, processing about 14.4TB daily and managing 1.81 million requests per day, with a p90 query latency of just 112ms [37]. This developer-friendly design extends to its seamless integrations.
Integration Capabilities
Tinybird supports major BI tools like Tableau, Microsoft Power BI, Metabase, and Apache Superset. Its native Git integration simplifies version control, while schema migrations occur with zero downtime - ensuring smooth operations. Unlike traditional BI systems, where 73% fail to deliver ROI within the first year, Tinybird’s architecture addresses common bottlenecks like high query latency and limited warehouse concurrency [35].
Cost
Tinybird offers a free tier for testing, no credit card required [36]. The Developer Plan starts at $49 per month (as of January 2026) [36]. For larger organizations, Enterprise Plans provide custom pricing with guaranteed performance and predictable monthly rates to avoid surprise costs [36]. Additionally, Tinybird’s AI tools add even more value by enabling actionable insights.
AI-Driven Functionalities
Tinybird enhances its developer-first approach with powerful AI-driven tools. Its Explorations feature provides a conversational UI, allowing users to ask questions in plain language and receive structured data analysis and visualizations [38]. AI Agent Skills optimize project setup by enabling coding agents like Cursor, Claude Code, and GitHub Copilot to autonomously build, test, and deploy real-time analytics projects [37].
The platform also includes the MCP (Model Context Protocol) Server, which lets large language models directly interact with the data layer for AI-native applications. With features like optimized SQL for AI agents, automated migrations, and isolated branching, Tinybird ensures rapid delivery of new features [37].
10. Superset
Apache Superset is an open-source business intelligence (BI) platform designed for technical teams that rely on SQL rather than AI-driven assistants. While many BI tools in 2026 focus on natural language queries, Superset stands out for its emphasis on SQL Lab - a dedicated editor where analysts and engineers can write and visualize queries in real-time [3].
Features
Superset provides access to 40+ chart types, ranging from basic bar graphs to sophisticated geospatial visualizations [3]. Its architecture is built to handle large-scale data, enabling high-performance queries on massive datasets. The platform includes a lightweight semantic layer to define custom dimensions and metrics, as well as a configurable caching layer to ease database strain during intensive querying. Security is a priority, with features like OAuth, LDAP, SSO, and role-based access control ensuring enterprise-grade protection [3]. These tools make it a great fit for teams that want complete control over their analytics.
Usability
Superset is tailored for technical users with strong SQL and data modeling skills [3]. Building dashboards requires manual effort, as users must create custom SQL queries [40]. For example, in 2025–2026, a fintech startup leveraged Superset to track millions of daily transactions. By creating custom dashboards to detect fraud patterns, the company achieved a 40% boost in transaction security within six months, significantly reducing quarterly losses [3].
Integration Capabilities
Superset offers broad integration options, connecting to any SQL-compatible database using a Python DB-API driver and SQLAlchemy dialect. Supported databases include PostgreSQL, MySQL, Snowflake, BigQuery, and Redshift [3]. For deployment, it supports cloud-native tools like Docker, Kubernetes, and Helm Charts, providing flexibility for various setups. Additionally, its robust API allows for programmatic customization, making it ideal for enterprises with specific workflow needs [3].
Cost
The platform is free to download and self-host, though organizations need to budget for cloud infrastructure, deployment, and maintenance expenses [3]. For those seeking an easier setup, third-party managed hosting services are also available [3].
AI-Driven Functionalities
Superset takes a SQL-first approach, offering limited native AI capabilities [1][39][40]. This approach appeals to teams that prefer hands-on control over automated insights [40].
Strengths and Weaknesses
Here's a breakdown of the key strengths and limitations of each platform, based on a detailed review of their features, usability, integration, cost, and AI capabilities:
Tool | Strengths | Weaknesses |
|---|---|---|
Querio | AI-native workspace with natural language queries; generates inspectable code; shared semantic layer for consistent metrics; live warehouse connections; SOC 2 Type II compliant; flexible, no-seat-fee pricing | Relatively new compared to legacy tools; works best for teams using modern data warehouses |
Microsoft Power BI | Affordable at $14/user/month for Pro; tightly integrated with the Microsoft ecosystem; extensive visualization options | Requires expertise in DAX for advanced calculations; slower dashboard performance with large datasets unless optimized; Premium tier licensing can become expensive |
Tableau | Advanced visualization capabilities; strong community support; excellent for complex data storytelling | Steep learning curve for advanced features; high licensing costs, especially for casual users; relies on clean, well-organized data for best results |
Qlik Sense | Associative engine for dynamic data exploration; strong self-service analytics; flexible deployment options | Expensive at scale with a complex pricing model |
ThoughtSpot | Intuitive natural language search; fast in-memory analytics; AI-driven insights | Requires pre-cleaned data for optimal performance; premium pricing; significant data preparation needed upfront |
Looker | Centralized data modeling with LookML; strong governance controls; seamless Google Cloud integration | Requires specialized LookML expertise, which can slow deployment; may suffer from performance issues with very large datasets unless optimized |
Domo | Combines data integration, BI, and collaboration in one platform; mobile-friendly design; broad connectivity options | Licensing costs can rise significantly with more users; complexity may overwhelm smaller teams |
Sisense | Strong embedded analytics tools; handles complex data models; customizable options | Initial setup needs dedicated technical resources; higher price point; steeper learning curve |
Tinybird | Real-time data processing at scale; API-first design; excels at handling high-velocity streaming data | Developer-focused and requires SQL skills; limited traditional BI dashboard features; relatively new in the market |
Superset | Free and open-source; offers over 40 chart types; enterprise-grade security with standard integrations (OAuth, LDAP, SSO); full control over analytics | SQL-first approach with limited AI capabilities; requires technical expertise for dashboard creation; organizations must manage cloud infrastructure and maintenance costs |
This comparison highlights the importance of aligning your BI platform choice with your organization's technical resources and data needs. For instance, tools like Looker and Power BI demand specialized expertise - whether it's LookML or DAX - which can extend deployment timelines [4][41]. Similarly, platforms such as Domo and Qlik Sense can become costly as user numbers grow [4][41]. As AI-driven BI tools continue to evolve, selecting a platform that matches your team's technical abilities and data environment is critical.
Conclusion
By 2026, staying ahead means adopting an AI-driven BI platform that redefines how teams work with data. The shift is clear: the industry is moving beyond static dashboards to AI agents that uncover insights autonomously, enabling a more dynamic and predictive approach to analytics rather than sticking to traditional, rigid reporting methods [42]. In this evolving landscape, Querio's AI-first approach outshines older systems, offering real-time data access, transparency, and strong governance.
Querio sets itself apart as the go-to choice for organizations looking for AI-powered analytics without compromising on control or clarity. Its natural language interface generates inspectable SQL and Python code, giving users full visibility into every analysis. The shared semantic layer ensures consistent metrics across the organization, avoiding confusion caused by conflicting definitions. With SOC 2 Type II compliance, live connections to data warehouses, and pricing that avoids per-seat fees, Querio offers enterprise-grade tools without the complexity, steep learning curves, or hidden costs often found in legacy systems. Unlike platforms that lock users into proprietary languages or expensive licensing models, Querio empowers both technical and non-technical teams to explore data on their own while upholding strict governance.
The future belongs to organizations that remove barriers to data access and let teams craft their own narratives. Querio delivers on this promise by blending AI-driven automation with human oversight, ensuring insights are actionable and audit-ready. It’s the platform that aligns seamlessly with your cloud infrastructure, accommodates diverse skill sets, and leads the charge toward transparent, AI-powered analytics.
FAQs
How do I pick the right BI tool for my team?
To select the best BI tool for your team, begin by pinpointing your specific needs. Consider factors like the type of analytics required, how well the tool scales with your operations, its integration capabilities, and any AI-powered features it offers. Next, evaluate tools based on deployment options, pricing structures, and how well they fit your team’s size and skill set. Focus on platforms that offer clear benefits aligned with your objectives. Lastly, check user reviews and documentation to confirm the tool can effectively support your data-driven decision-making process.
What data prep is needed for AI analytics to be accurate?
Accurate AI analytics depend on meticulous data preparation. This involves several key steps: cleaning, validation, normalization, transformation, and enrichment. These processes help ensure the data is accurate, complete, and consistent. While many AI tools can automate parts of this workflow, taking the time to prepare data thoroughly enhances its quality and boosts the reliability of the models built on it.
How can I keep AI insights auditable and governed?
To keep AI insights accountable and well-regulated, it's crucial to implement ongoing AI governance practices. Prioritize high-quality data, clear model transparency, effective bias mitigation, and strong privacy protections. By embedding oversight into every stage of AI system development and deployment, you can ensure both accountability and adherence to compliance standards.
Related Blog Posts


