Business Intelligence
How to Build Fast-Loading Dashboards with Recharts
Speed up Recharts dashboards with aggregation, memoization, lazy loading, and virtualization to cut rendering time and reduce main-thread blocking.
When your dashboard takes more than three seconds to load, it can disrupt workflows and delay decisions. To fix this, focus on optimizing performance, especially when working with large datasets. Here’s how Recharts, a React-based charting library, can help you create fast and responsive dashboards:
Recharts Strengths: Uses SVG elements, integrates with React, and simplifies chart creation with declarative syntax.
Querio for Live Data: Handles SQL queries, caching, and backend data modeling, ensuring real-time data updates.
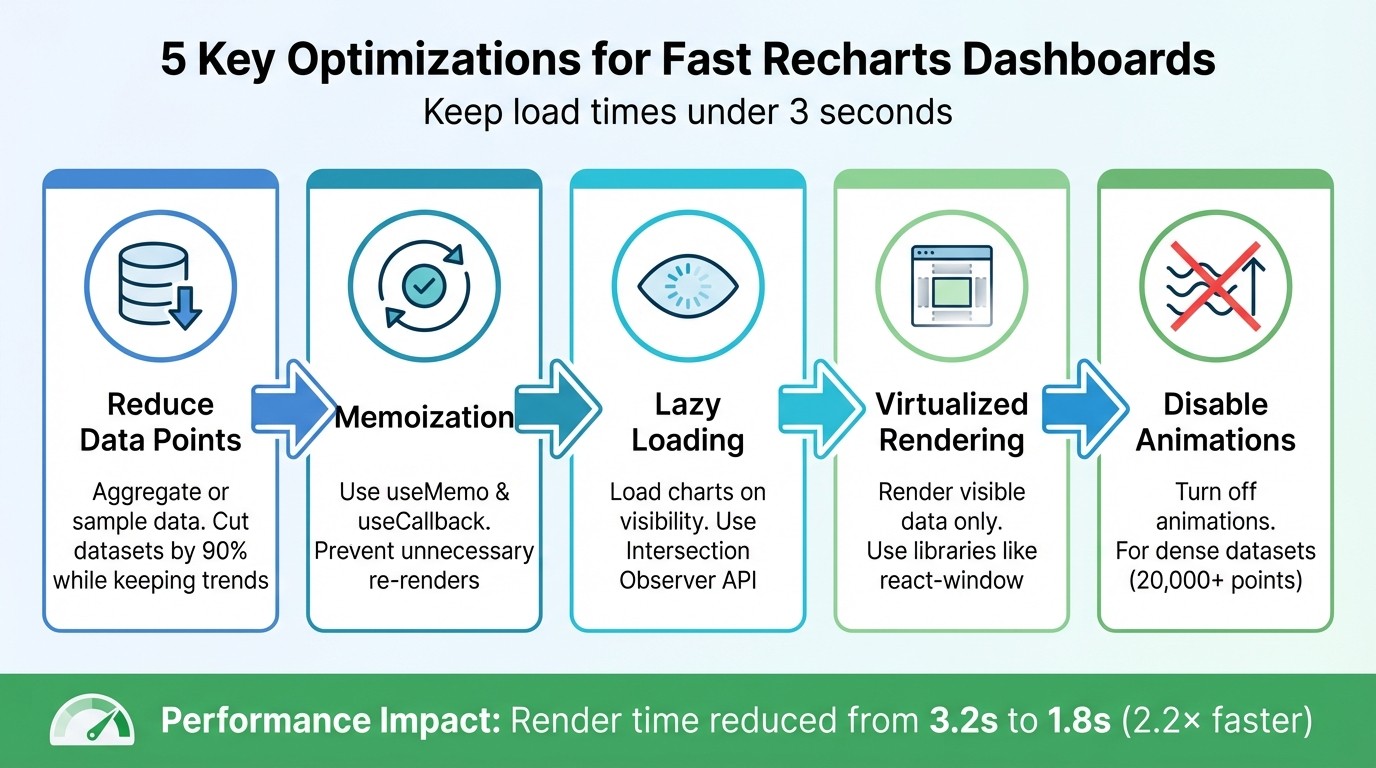
Key Optimizations:
Reduce Data Points: Aggregate or sample data to minimize rendering load.
Memoization: Use
useMemoanduseCallbackto prevent unnecessary re-renders.Lazy Loading: Load charts only when they’re visible using the Intersection Observer API.
Virtualized Rendering: Render only the visible data points with libraries like
react-window.Turn Off Animations: Disable animations for dense datasets to improve speed.
Use tools like Chrome DevTools and React Profiler to identify bottlenecks, such as excessive DOM operations or main thread blocking. By addressing these issues and implementing strategies like lazy loading and data aggregation, you can ensure your dashboards remain fast and responsive, even with heavy data loads.
5 Key Optimization Techniques for Fast-Loading Recharts Dashboards
Setting Up Recharts with Querio
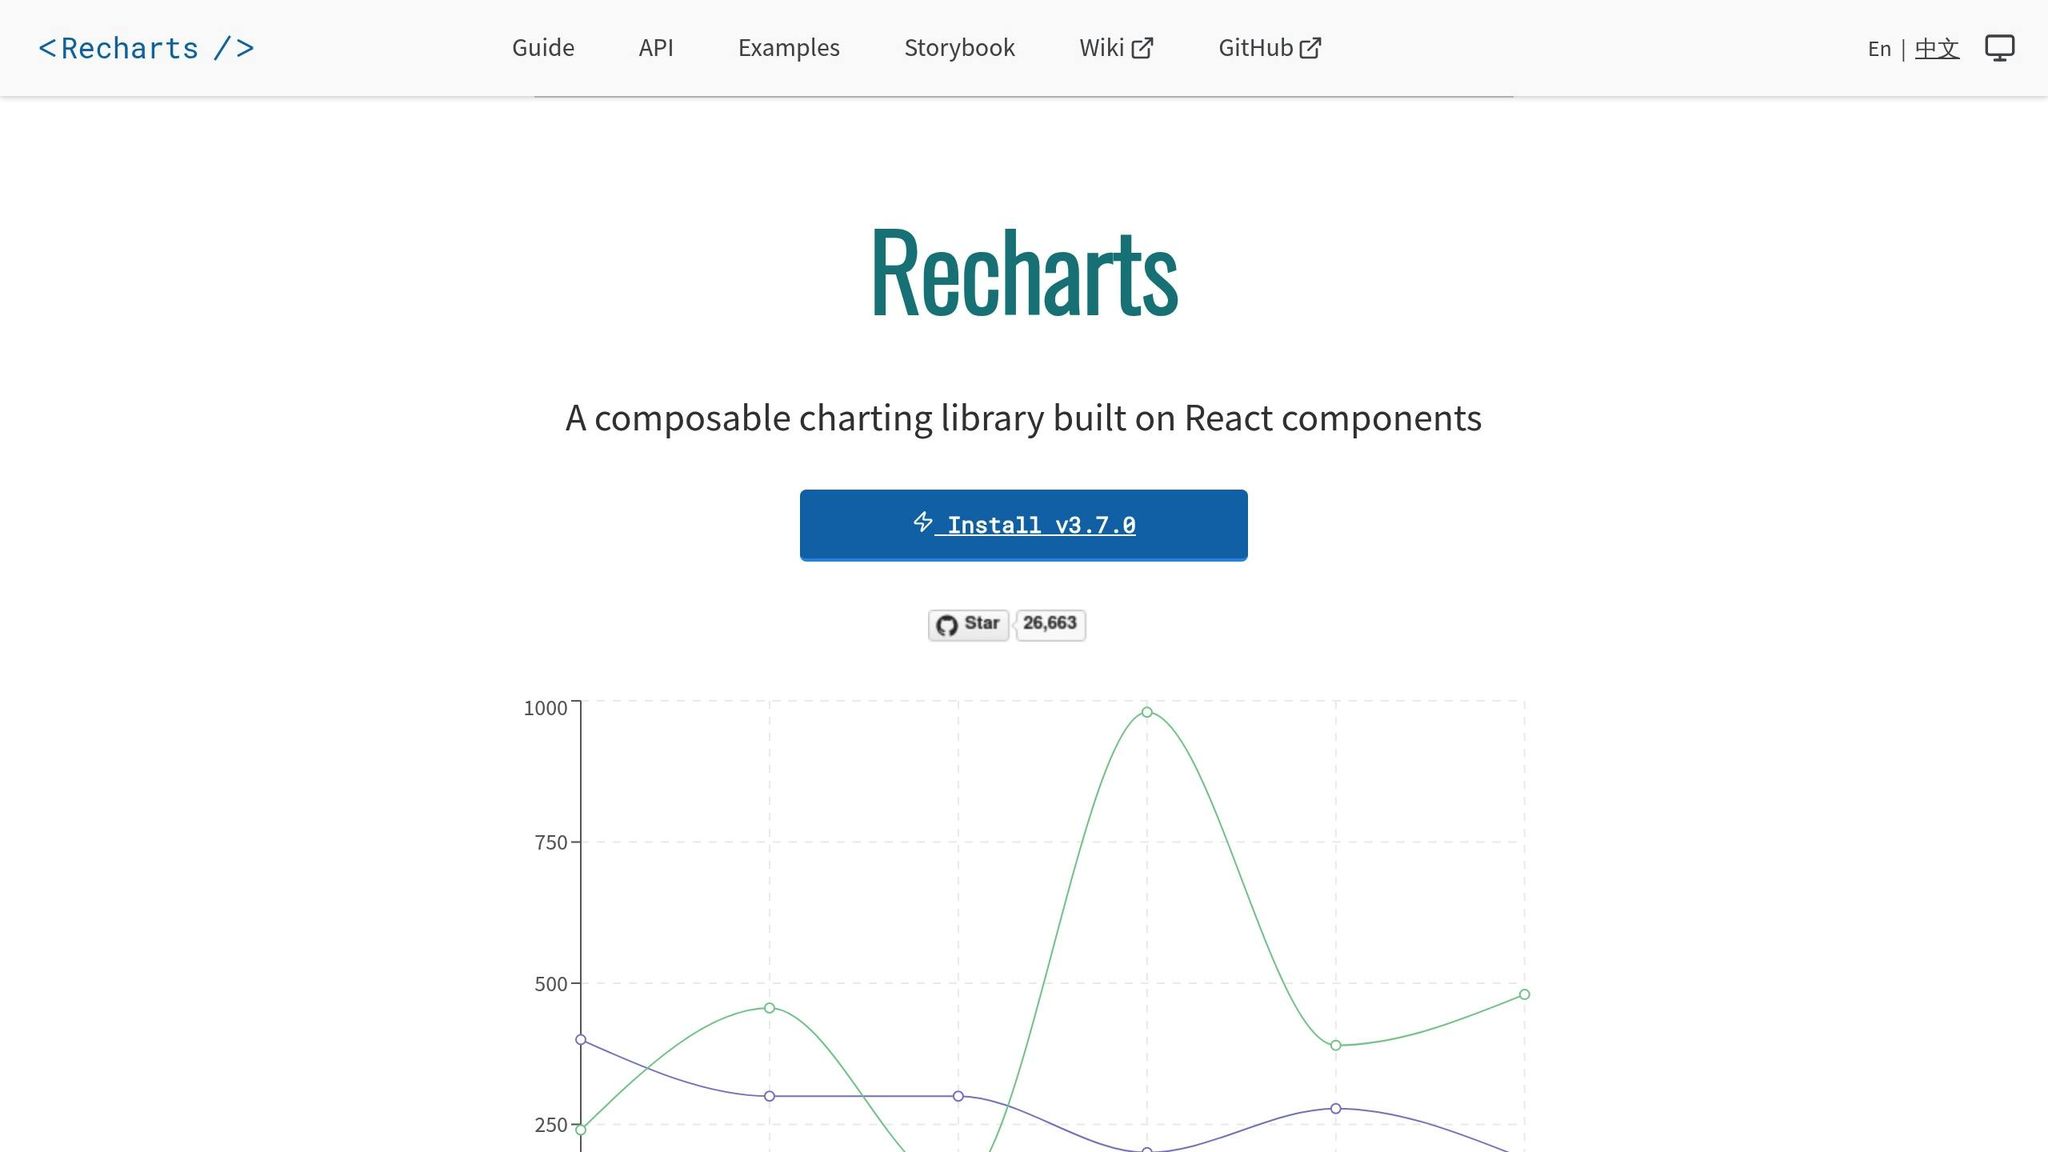
Installing Recharts and Required Dependencies
To get started, run npm install recharts in your project directory if you're working on a single-page application. Recharts is built using React components and relies on SVG elements, with a minimal dependency on D3 submodules. This means you won’t need to install a bulky stack of additional libraries.
For debugging during development, you can also install @recharts/devtools. By importing <RechartsDevtools />, you'll gain access to a hook inspector, making it easier to understand the inner workings of your chart components.
When setting up your charts, make sure to define their dimensions. You can use fixed values, percentages, or the responsive prop (or ResponsiveContainer in earlier versions). To handle layout adjustments for different screen sizes, leverage CSS properties like aspectRatio, maxWidth, and maxHeight directly on the chart’s style.
Once Recharts is installed and configured, you're ready to connect it to live warehouse data.
Connecting Recharts to Live Warehouse Data
After installation, linking your charts to live data becomes a straightforward process. Querio simplifies this by pulling aggregated data directly from your data warehouse, eliminating the need for complex frontend transformations. Whether you're using BigQuery, Snowflake, Redshift, or ClickHouse, Querio handles SQL execution, caching, and backend data modeling for you.
On the React side, use a data-fetching hook to bring the results into your component. Recharts works with data formatted as an array of objects, where each object represents a data point with specific properties. For example:
Pass this structured data to the data prop of components like LineChart, BarChart, or AreaChart. To optimize performance, wrap any data transformations in useMemo and handle filtering, sorting, and aggregation upstream. Stick to the sequence: Filter first, Join second, Aggregate last. This approach reduces payload size and CPU usage.
Avoid running SELECT * queries. Instead, request only the necessary columns for your chart. This not only minimizes network traffic but also ensures your client-side processing remains efficient - critical for delivering responsive, real-time dashboards.
Optimizing Data Handling for Faster Rendering
Reducing Data Points Through Aggregation
Rendering every single data point isn’t just unnecessary - it’s inefficient. When working with datasets that include thousands of points, you can simplify the process by using data aggregation techniques like binning. For instance, instead of plotting each individual value, group your data into intervals with a library like d3.bin. This method keeps the overall shape and trends of your dataset intact while cutting down the number of SVG elements the browser has to process.
Another approach is sampling. Let’s say you’re dealing with a year’s worth of hourly data (that’s 8,760 points). By displaying only every tenth point, you can reduce the dataset by 90%. This not only makes rendering faster but also keeps the key trends visible and meaningful.
You can also speed things up by implementing a lazy measurement check. For example, skipping out-of-bound tick size calculations can significantly cut rendering time - from 3.2 seconds down to 1.8 seconds [2]. Combine this with stabilizing component references, and you’ll eliminate unnecessary computations while keeping performance smooth.
Using React.memo and useMemo to Prevent Re-renders

Reducing data isn’t the only way to optimize performance - memoization plays a big role too. In libraries like Recharts, recalculations often happen when props change. If you’re passing data arrays or transformation functions inline, you might unintentionally trigger these recalculations with every render. The fix? Wrap your data transformations in useMemo and functions used for dataKey in useCallback. This ensures stable references between renders.
As the Recharts documentation explains:
"If you are passing objects or functions as props to Recharts components, consider using React's useMemo and/or useCallback hooks to memoize them. This can help prevent unnecessary re-renders of Recharts components when their props haven't actually changed." - Recharts Official Documentation [3]
For cases involving multiple series, like <Line /> or <Area /> components, memoizing the mapping can make a big difference. It avoids the costly process of regenerating JSX elements, which becomes especially important when rendering large datasets - think 20,000+ data points [5]. Addressing this bottleneck directly ensures your application stays responsive, even under heavy data loads.
Configuring Recharts Components for Better Performance
Using ResponsiveContainer for Flexible Chart Sizing
The ResponsiveContainer component is your go-to for ensuring charts adapt seamlessly to their parent element's size. It relies on the ResizeObserver API to track changes in dimensions and adjust accordingly [8].
To make this work correctly, the parent element must have a defined height - think something like 400px or 50vh. Without this, the chart might not render as expected. For smoother performance during window resizing, set the debounce prop to a value such as 100, which reduces unnecessary re-renders. To maintain a consistent look, use the aspect prop (e.g., aspect={1.6}) to lock the chart's proportions. You can also use constraints like minWidth, minHeight, or maxHeight to ensure charts remain clear and legible on various devices. If you're working with more complex layouts, applying position: relative to the wrapper div helps the component calculate dimensions properly.
Once you've set up ResponsiveContainer, you can dive into fine-tuning your chart components for better performance.
Configuring LineChart, BarChart, and AreaChart
If you're working with dense datasets, reducing the number of SVG elements can significantly improve performance. For example, disable dots on Line, Area, or Scatter components by setting dot={false} [6].
To avoid unnecessary recalculations, keep your dataKey references stable. You can achieve this by defining functions outside the component scope or by using useCallback to memoize them [3]. Inline functions might seem convenient, but they can trigger full recalculations, which impacts performance.
For dashboards with frequently updating or large datasets, consider setting isAnimationActive={false} on components like Line, Bar, and Area. This removes the animation overhead, making updates faster. If your charts include interactive tooltips, tweaking the throttleDelay prop can help strike a balance between responsiveness and CPU usage.
Handling Large Datasets Without Slowing Down
Lazy Loading Charts with Intersection Observer
When dashboards are packed with multiple charts, rendering all of them at once can overwhelm the browser, especially with thousands of data points. Lazy loading offers a solution by delaying the rendering of chart components until they’re visible on the screen [4][5]. This approach helps lighten the initial load, making the dashboard feel more responsive.
The Intersection Observer API is a handy tool for this. It tracks when a chart container enters the viewport. To use it, you can create a custom hook (like useIntersectionObserver) to manage the visibility state of each chart. Attach a ref to the chart container and set a threshold, such as 0.1, so the chart starts loading when 10% of it becomes visible [4][9]. Pair this with React.lazy() and Suspense to ensure the chart is only loaded when it’s needed [4].
For datasets with massive volumes - think 20,000+ points - you can combine lazy loading with data chunking. This means loading the data in smaller segments (e.g., 100 points at a time) to avoid freezing the UI during the initial render [4]. Once lazy loading and chunking are in place, you can further optimize by rendering only the visible portion of the dataset.
Implementing Virtualized Rendering for Large Datasets
Lazy loading is great for deferring renders, but virtualized rendering takes it a step further by focusing only on the visible data points. This technique dramatically reduces memory usage and DOM nodes by limiting the number of elements rendered at any given time [10]. For dashboards with numerous charts, libraries like react-window or react-virtuoso can help manage this. You can also set an overscanCount (e.g., 5) to render a few extra charts, ensuring smooth scrolling without blank spaces [10].
To further optimize large datasets, you can preprocess data before passing it to visualization libraries like Recharts. Techniques like binning (using d3.bin) or sampling reduce the number of points that need rendering [3]. For example, rendering a chart with 10,000 items can trigger up to 40,000 internal measurement calls. Thanks to optimizations in Recharts v2.10, these calls were reduced by 2.2×, cutting render times from 3.2 seconds to 1.8 seconds [2]. Adding features like the <Brush /> component allows users to zoom into specific sections, further limiting the visible data points [6].
To ensure smooth performance, keep your dataKey references stable by defining functions outside the component or wrapping them in useCallback. For dynamic elements such as hover effects, isolating them into sub-components can help prevent unnecessary re-renders of the entire chart [3]. These strategies work together to create a seamless experience, even for the most data-heavy dashboards.
React Responsive Admin Dashboard Tutorial with Recharts 🔥
Measuring Dashboard Performance
Once you've implemented lazy loading and virtualized rendering, it's time to measure how these optimizations are affecting your dashboard. Without proper measurement, your dashboard might feel fast on high-end devices but could still struggle on less powerful ones.
Finding Performance Bottlenecks
Start by focusing on Core Web Vitals that are most relevant to dashboards. For example:
Largest Contentful Paint (LCP): This should happen within 2.5 seconds for a good user experience [11][14].
Interaction to Next Paint (INP): This measures how quickly your dashboard reacts to user interactions. Aim for 200ms or less [14]. Even a small delay, like a lag when hovering over a chart tooltip, can indicate a performance issue.
The Chrome DevTools Performance Panel is a powerful tool for uncovering where your dashboard spends its time. Use it to analyze load times and inspect the flame chart. In complex dashboards, particularly those using libraries like Recharts, DOM-related tasks like getBoundingClientRect can take up a significant chunk of rendering time. DevTools flags tasks exceeding 50ms with a red triangle, signaling potential UI lag [11].
Switch to the Bottom-Up tab in the Performance panel to zero in on specific functions consuming the most time. For instance, if functions like getStringSize or style recalculations rank high, consider reducing the number of SVG elements or stabilizing component props. Simulating lower-end devices by throttling the CPU (4x or 6x) can give you a better sense of how stakeholders might experience the dashboard [11][13].
After identifying bottlenecks, the next step is to dig deeper with both browser tools and React profiling to address the issues.
Using Browser DevTools and React Profiler
Once you've spotted bottlenecks, tools like Browser DevTools and the React Profiler can help you address them. The React Profiler is particularly useful for identifying unnecessary re-renders. For example, passing inline functions or creating new objects for props - like dataKey - can force the library to recalculate all data points during every render [3]. The Profiler highlights which components are re-rendering and why, helping you eliminate redundant work.
Enable Paint Flashing in DevTools' Rendering tab to detect unnecessary chart repaints during small interactions. If hovering over a single point causes the entire chart to repaint, consider isolating the hover state into its own sub-component. You can also use the @recharts/devtools package to analyze chart-specific performance directly within your UI [1][7].
For dashboards like Querio that connect to live data warehouses, keep an eye on Main Thread Blocking Time - the time JavaScript processing prevents user interactions [11][12]. If data processing or SVG generation is blocking the main thread, break the work into smaller chunks using requestIdleCallback or offload heavy computations to a Web Worker. Additionally, monitor the number of SVG elements being rendered. For instance, rendering thousands of nodes in a ScatterChart can spike memory usage and slow down the browser [9][12].
Conclusion
This guide covered several strategies to improve data rendering speeds. Building dashboards for speed requires careful handling of rendering processes. Techniques like using stable prop references with useMemo and useCallback, implementing lazy loading with Intersection Observer, aggregating data, and turning off animations for dense datasets tackle common performance issues. While many charts perform well without adjustments, these methods become crucial when dealing with thousands of data points or multiple charts on one dashboard.
Querio streamlines back-end data aggregation by executing SQL and caching results directly within your data warehouse. This approach ensures that only summarized data is sent to the browser, while Recharts optimizes client-side rendering for smooth performance.
Performance auditing is another critical step. Tools like DevTools and React Profiler help identify which charts take the longest to render or block the main thread. By pinpointing these issues, you can apply targeted optimizations. For real-time analytics, debounce interactions and throttle updates to maintain responsiveness under 100 milliseconds [3]. Testing under throttled conditions ensures a seamless experience for all users.
Fast and responsive dashboards do more than save time - they build trust in the data. When charts load quickly and interactions run smoothly, users can focus on analyzing insights rather than waiting for data to catch up. This efficiency leads to quicker and more confident decision-making.
FAQs
How many data points is too many for Recharts?
Recharts doesn't impose a strict limit on the number of data points you can use. However, performance may take a hit when working with very large datasets. To keep things running smoothly, try techniques like isolating components and leveraging memoization. These methods can help streamline rendering and boost performance, making it easier to deliver a seamless experience - even on complex dashboards.
What should I aggregate in SQL vs in React?
To create dashboards that load quickly using Recharts, aim to process and aggregate data in SQL as much as you can. By doing this, you cut down the amount of data sent to React, which reduces the rendering workload and boosts performance. Use SQL for heavy-lifting tasks like summing, averaging, or grouping data. Leave React to focus on presentation and handling smaller interactions. This balance helps streamline data processing and delivers a smoother, more efficient experience for users.
How do I lazy-load charts on scroll?
To optimize performance when using Recharts, you can lazy-load charts with the Intersection Observer API. This approach detects when the chart's container enters the viewport and ensures the chart initializes and renders only at that moment. To prevent repeated loading, you can use a flag, such as a data-loaded attribute, to track whether the chart has already been rendered.
This technique is particularly useful for dashboards packed with multiple visualizations, as it reduces the initial load time by delaying the rendering of charts until they are actually needed.
Related Blog Posts


