Business Intelligence
AI Dashboard Generators Compared: Genie, Copilot, and Warehouse-Native Tools
Choose the AI dashboard path that enforces metric definitions first—compare Genie, Copilot, and warehouse-native tools for trust and auditability.
If you want one short answer: pick the tool that controls metrics before AI builds the chart. That is the line between a dashboard you can check and one that only looks right.
Here’s the short version:
Genie fits teams that work mainly in Databricks
Copilot fits teams already deep in Power BI and Microsoft Fabric
Warehouse-native tools fit teams using Snowflake, BigQuery, Redshift, or Postgres that want live data and editable SQL
The biggest issue is not AI itself. It’s data trust, metric consistency, and how easy it is to inspect the logic
Tools tied to a semantic or metric layer tend to hold up better for ARR, MRR, NRR, executive reporting, and audit checks
The article points to research showing semantic-layer setups can reduce errors in AI-generated natural-language queries by up to two-thirds
If I were choosing fast, I’d use this rule:
Databricks stack: use Genie
Microsoft-first stack: use Copilot
Warehouse + dbt stack: use a warehouse-native tool like Querio
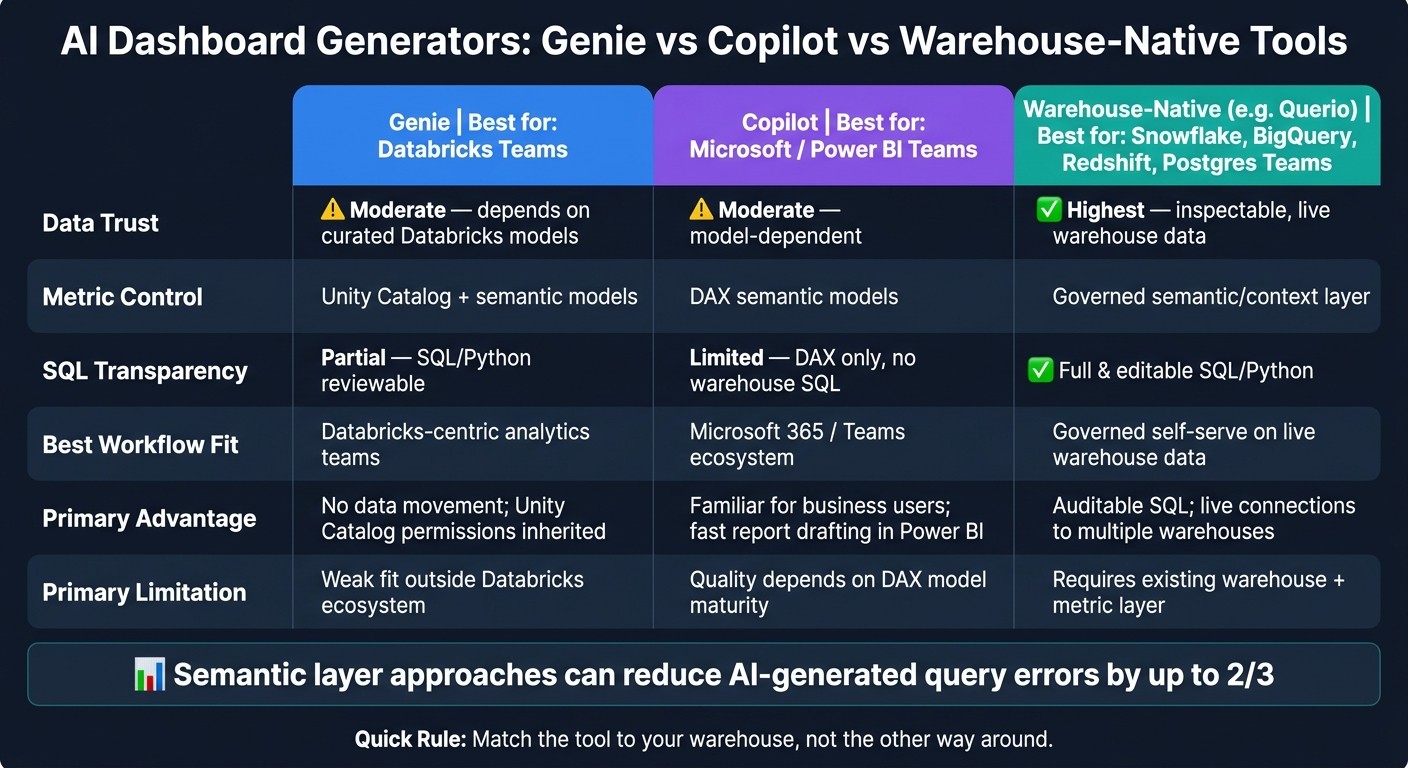
AI Dashboard Tools Compared: Genie vs Copilot vs Warehouse-Native
Quick Comparison
Tool | Best for | Metric control | Logic review | Main trade-off |
|---|---|---|---|---|
Genie | Databricks-heavy teams | Depends on curated models and definitions | SQL/Python can be checked | Output can vary if business terms are not modeled well |
Copilot | Power BI / Fabric teams | Uses DAX measures and semantic model | DAX can be checked | Review usually stops at the Power BI layer, not warehouse SQL |
Warehouse-native tools | Snowflake, BigQuery, Redshift, Postgres teams | Depends on semantic/context layer on top of warehouse data | Full SQL/Python is editable | You still need a clean warehouse model |
My take: if your team cares most about live warehouse data, code review, and keeping KPI definitions lined up across BI and AI, warehouse-native tools usually make the most sense. If your team already lives inside Databricks or Microsoft, Genie and Copilot can be the better fit.
This article compares those paths in plain terms so you can match the tool to your stack, reporting risk, and day-to-day BI workflow.
1. Genie (Databricks AI/BI)
Genie is Databricks’ conversational AI layer that turns plain-English questions into charts and dashboards. It writes the SQL or Python behind each result.
Ask something like, “Show me monthly active users by plan tier,” and Genie will return a dashboard based on the code it generates.
Data trust and metric consistency
Unity Catalog handles access control and lineage. But lineage doesn’t define metrics. That part matters.
Genie works best when it sits on top of curated tables. If there’s no semantic layer, the same business term can lead to different numbers across different tables. That’s why teams with clean dbt models usually get better output than teams working straight from raw data. In plain terms: governed data access is not the same as governed business meaning.
Inspectability
Analysts can inspect the generated SQL or Python before they trust the result. That makes it much easier to check joins, filters, and business definitions before anything gets shared.
A good rule here is simple: treat Genie’s output like a draft. Review the SQL before you publish.
Governed speed-to-insight
Genie speeds up ad hoc analysis most when the data model underneath is already curated.
That tradeoff becomes clearer when you stack Genie up against Microsoft-first and warehouse-native workflows.
2. Copilot (Power BI/Fabric)

Copilot in Power BI and Microsoft Fabric helps Microsoft-first teams draft reports faster. Give it a prompt, and it can turn that into a report page with visuals, layout, and KPIs pulled from the existing semantic model.
That’s the big draw. It speeds up report building inside the Microsoft stack. But there’s a catch: the output is only as good as the semantic model under it. If the model is solid, Copilot can save a lot of time. If the model is messy, Copilot won’t fix that.
Data trust and metric consistency
Copilot uses your DAX measures and Fabric semantic model to define metrics. So metric consistency comes down to how well that model has been set up.
When the underlying measures are clear and well-defined, Copilot carries that logic into the report. In plain English, it follows the rules you’ve already written.
Inspectability
Copilot can show the DAX logic behind a visual. That gives analysts a way to inspect how a chart or KPI was built.
But the view stops there. Analysts can inspect DAX, not the warehouse SQL, so tracing back to source tables still happens outside Copilot.
Governed speed-to-insight
Governance comes from Azure Active Directory, Power BI workspace permissions, and role-based security best practices. That means Copilot-generated reports follow the access rules your team already has in place.
The tradeoff is setup time. Getting a Power BI semantic model into a state where Copilot gives reliable output usually takes more upfront modeling than schema-first, warehouse-native approaches.
Copilot works best when a skilled Power BI developer is already in the mix. It can speed up report creation, suggest DAX, and switch chart types. But self-serve still leans on model maturity. That tension leads to the next question: does your team need warehouse-level traceability, or is staying inside the Power BI model enough?
3. Warehouse-native tools (with Querio as a primary example)

Warehouse-native tools connect straight to Snowflake, BigQuery, Redshift, ClickHouse, MotherDuck, or Postgres and query live data. So every answer reflects what's in the warehouse right now.
They don't copy data into a separate modeling layer. That's the core trade-off: live access is fast, but metric control depends on the layer sitting on top of the warehouse.
Querio is a clear example of this setup. It uses encrypted, read-only connections to your warehouse and generates real SQL and Python for every answer.
Data trust
Because queries run right against the warehouse, answers reflect live warehouse data. That makes warehouse-native tools a strong choice for executive reporting, where stale numbers can eat away at trust fast.
Metric consistency
A semantic or context layer gives data teams one place to define joins, metrics, and business logic, then apply that same logic across analysis, dashboards, and AI-generated answers. Research on semantic layer approaches like Looker's LookML shows they can cut data errors in AI-generated natural-language queries by as much as two-thirds compared with direct text-to-SQL [1].
For teams already using dbt or warehouse views, this is the piece that keeps AI-generated dashboards lined up with the rest of the BI stack.
"Self-serve doesn't just mean 'analysts building dashboards, faster.' It's gaining direct access to trusted data faster." - Brian Waligorski, Lead Data Engineer, The Philadelphia Inquirer [2]
Inspectability
Every answer includes editable SQL or Python. That means the logic behind each answer is much easier to review, check, and trust.
Governed speed-to-insight
Warehouse-native tools inherit the access controls already set up in your warehouse. If someone can't access a table in the warehouse, they won't see it through Querio either.
For business users, Querio's interactive notebooks let non-technical teammates ask follow-up questions in plain English without waiting on the data team. The data team sets the guardrails, and business users explore inside them. In practice, that supports executive reporting, self-serve exploration, and team BI workflows.
Those are the trade-offs that matter day to day: trust, metric control, and how well the tool fits the way BI work actually happens.
Trade-offs by trust, metric control, and workflow fit
The main issue isn't speed. It's whether you can trust the answer when finance asks about ARR.
That’s where the split gets practical: trust, metric control, and workflow fit.
Genie works best with curated Databricks models. Copilot works best when the Power BI semantic model is mature. Warehouse-native tools offer the clearest audit trail because each answer maps back to SQL or Python. That gap matters most for ARR, executive reporting, and auditability.
Metric consistency starts to slip when dashboards and AI chat rely on different definitions. A single semantic layer keeps KPI drift in check across ARR, NRR, and usage reporting [1].
Use the table below to see the trade-off each tool makes:
Criteria | Genie (Databricks AI/BI) | Copilot (Power BI) | Warehouse-Native (Querio) |
|---|---|---|---|
Data Trust | Moderate - depends on curated Databricks models | Moderate - model-dependent | Highest - inspectable code |
Metric Control | Unity Catalog / semantic models | DAX semantic models | Governed semantic/context layer |
SQL Transparency | Partial | Limited | Full & editable |
Best Workflow Fit | Databricks-centric teams | Microsoft 365 / Teams ecosystem | Governed self-serve on live data |
The best choice is the one that fits your current warehouse, semantic layer, and how people already work.
Copilot fits organizations already running Microsoft 365 and Teams.
Genie fits teams whose analytics stack sits in Databricks.
Warehouse-native tools fit teams using a warehouse, dbt, and a mix of technical and non-technical users.
A simple rule of thumb helps here: use AI for ad hoc diagnostics, and keep core executive dashboards in standard BI. Those trade-offs lead straight into the pros and cons.
Pros and cons
Each tool makes a different trade-off. Some are a better match for Databricks. Some fit Microsoft shops. Others give you more control inside the warehouse. The Business Intelligence tools comparison below lines them up against the three things that matter most: trust, metric control, and workflow fit.
Genie (Databricks AI/BI) | Copilot (Power BI/Fabric) | Warehouse-Native (Querio) | |
|---|---|---|---|
Primary advantages | Databricks-native; inherits Unity Catalog permissions; no data movement | Native to Power BI; familiar for business users | Inspectable, editable SQL/Python; governed semantic/context layer keeps core metrics consistent; live warehouse connections to Snowflake, BigQuery, Redshift, Postgres, and more |
Primary limitations | Best suited to Databricks; less aligned with warehouses outside the ecosystem | Answer quality depends on the semantic model, and debugging stays inside DAX rather than warehouse SQL | Requires an existing warehouse and a usable metric layer |
Genie makes the most sense if your team already works in Databricks day to day. It plays nicely with that stack, but the fit gets weaker once your data lives outside the Databricks world.
Copilot helps non-technical users get started with less friction in Power BI-heavy teams. But there’s a catch: answer quality rises or falls with the semantic model. If definitions are weak, metric drift can creep in fast.
Warehouse-native tools give up some ease of use in exchange for auditability. Every answer ties back to SQL or Python, which makes review and debugging much more direct. If your team already runs dbt on Snowflake, BigQuery, or Redshift, this path usually feels smoother than it does for teams starting with less mature models.
That’s the heart of the choice: pick the tool that fits your warehouse, metric layer, and reporting risk. The decision guide turns those trade-offs into a stack-by-stack choice.
Decision guide: which tool fits your stack
Pick based on where your data lives, how you compare SQL and AI-driven data exploration for metric accuracy, and how much audit visibility your team needs. If two options seem neck and neck, use your warehouse and semantic model as the tie-breaker.
Choose Genie if your team already runs on Databricks and Unity Catalog.
Choose Copilot if your stack is Microsoft 365, Azure AD, and Power BI. Just know this: metric quality still comes down to how well your DAX model is set up.
Choose a warehouse-native tool like Querio if your data sits in Snowflake, BigQuery, Redshift, or Postgres and your team wants inspectable answers pulled from live warehouse data.
The matrix below makes the choice a lot faster.
Primary Stack | Governance | Metric Control | Ideal Use Case | Recommended Tool |
|---|---|---|---|---|
Microsoft Fabric / Azure | High (Azure AD / Power BI permissions) | High (DAX-based) | Teams living in Excel and Teams | Copilot |
Databricks | High (Unity Catalog) | High | Governed self-serve in Databricks | Genie |
Snowflake / BigQuery | Flexible | Medium | Fast self-serve with auditable SQL | Querio |
Postgres / Redshift | Low to Medium | Medium | Lean B2B SaaS teams with SQL-first analysts | Querio |
FAQs
Do I need a semantic layer before using an AI dashboard generator?
You don’t need a semantic layer to get started with an AI dashboard generator. But if you care about long-term reliability and consistency, it matters.
Schema-first tools can give you fast results. The catch is that they lean hard on your current naming conventions and metadata. If those are messy, unclear, or uneven across teams, your outputs can drift.
A governed semantic layer gives you one place to manage business logic, join relationships, and metric definitions. That way, terms like MRR or churn return the same verified results across your organization.
When is warehouse-native a better fit than Databricks or Power BI?
A warehouse-native platform makes more sense when your team cares most about live data access, clear logic, and steady governance through a shared semantic layer.
Power BI is a strong choice for enterprise reporting and tight Microsoft integration. But it can depend on data extracts, which adds distance between the dashboard and the source. It can also feel like a black box at times.
Warehouse-native tools like Querio take a different path. They connect straight to the warehouse, keep metrics in sync across teams, and let people inspect the underlying SQL or Python when they need to see how the numbers were built.
Can business users trust AI-generated dashboards without analyst review?
Usually not - at least not right away. Most teams build trust in steps: first they verify the output, then they spot-check it, and only after that do they hand more work over to the system once it has shown it can be trusted.
To keep that trust in place, teams need transparent SQL for auditing, a governed semantic layer so metrics stay consistent, and strong row-level security to control who can see which data.
Related Blog Posts


