Business Intelligence
AI That Generates Dashboards Automatically
Create governed, real-time dashboards from live warehouse data using plain-English queries—instant visual insights without SQL or manual ETL.
Tired of waiting weeks for dashboards? AI tools now create them in minutes.
AI-generated dashboards use natural language processing and machine learning to instantly turn raw data into visual insights. By simply asking a question in plain English, these tools generate tailored dashboards - no technical skills required.
Key Points:
Time Savings: Traditional dashboards take 40+ hours; AI tools like Querio deliver results in seconds.
Ease of Use: Users ask questions in plain English; no SQL or coding needed.
Direct Data Connections: Querio links to live data sources like Snowflake and BigQuery, ensuring real-time accuracy.
Governed Insights: A semantic layer ensures consistent metrics and definitions across teams.
Cost Efficiency: Flat fees and unlimited viewer access eliminate per-user licensing costs.
Querio simplifies data analysis, empowering teams to make faster decisions while reducing dependency on analysts. Businesses like TechCorp and Midwest Precision Manufacturing have saved thousands annually by adopting this approach.
Want to speed up decision-making and reduce manual work? Start with an AI-powered dashboard tool like Querio today.
Create Dashboards in Seconds With AI (It's Mind-Blowing 🤩)
Key Features of Querio's AI Dashboard Generation
Querio's AI-powered dashboard generation tackles common challenges like slow turnaround times, technical hurdles, data inconsistencies, and security risks tied to data duplication. Here's how it stands out:
Natural Language Querying for Instant Insights
Querio allows users to ask questions in plain English and receive accurate, visual answers on the spot - no need for SQL or coding skills. Instead of waiting for someone to run manual queries, users can type their questions directly. For example, asking about the top-selling products instantly generates a clear and precise visualization. This approach removes technical barriers and ensures that insights are readily accessible to the people who need them most.
Drag-and-Drop Dashboard Building
Querio also offers a drag-and-drop interface that simplifies creating custom dashboards. Users can easily arrange charts, tables, and KPI cards by dragging and dropping components into place. This design makes it simple to produce executive summaries, departmental reports, or customer-facing analytics without writing a single line of code. The process is quick and user-friendly - entire dashboards can be built in just minutes. Together, these tools make data analysis more approachable and efficient.
Semantic Layer for Data Governance
To ensure consistency across teams, Querio includes a configurable semantic layer. This layer defines table joins, business metrics, and glossary terms, creating a shared foundation for all users. Whether the finance team queries "revenue" or the product team does the same, both receive consistent and accurate results. This eliminates confusion caused by varying formulas or data sources across departments. While business users gain independence, data teams retain control over accuracy and governance.
Live Warehouse Connections Without Data Copies
Querio connects directly to data warehouses like Snowflake, BigQuery, and Postgres using Direct Query protocols. This means dashboards are always up-to-date with real-time data, without the need for copying or moving it.
As Databricks points out, this method ensures that "AI/BI Dashboards make it fast and simple to build analytical dashboards without moving data or paying for BI licenses."
This direct connection eliminates data silos and maintains a single source of truth. Security is preserved through encrypted, read-only connections, and dashboards automatically refresh as warehouse data updates - no manual intervention required.
How Querio Automates Dashboard Creation
Manual vs AI-Generated Dashboards: Time, Cost, and Efficiency Comparison
Querio simplifies the journey from raw data to shareable dashboards through four key steps: secure connection, natural language dashboard generation, context layering, and seamless embedding.
Connecting Data Sources with Querio
Querio integrates directly with your data warehouse - whether it's Snowflake, BigQuery, or Postgres - using encrypted, read-only credentials. This setup ensures your data stays secure, as Querio connects to live data without duplicating it. Users gain instant access to up-to-date information while maintaining a strong security posture.
Generating Dashboards Using Plain English
Once connected, users can start asking questions in everyday language. For example, typing "What were our top-selling products last quarter?" generates a visualization in seconds. Querio's AI deciphers the query, creates the necessary SQL in the background, and presents the results instantly. With just one click, you can pin any chart to a dashboard.
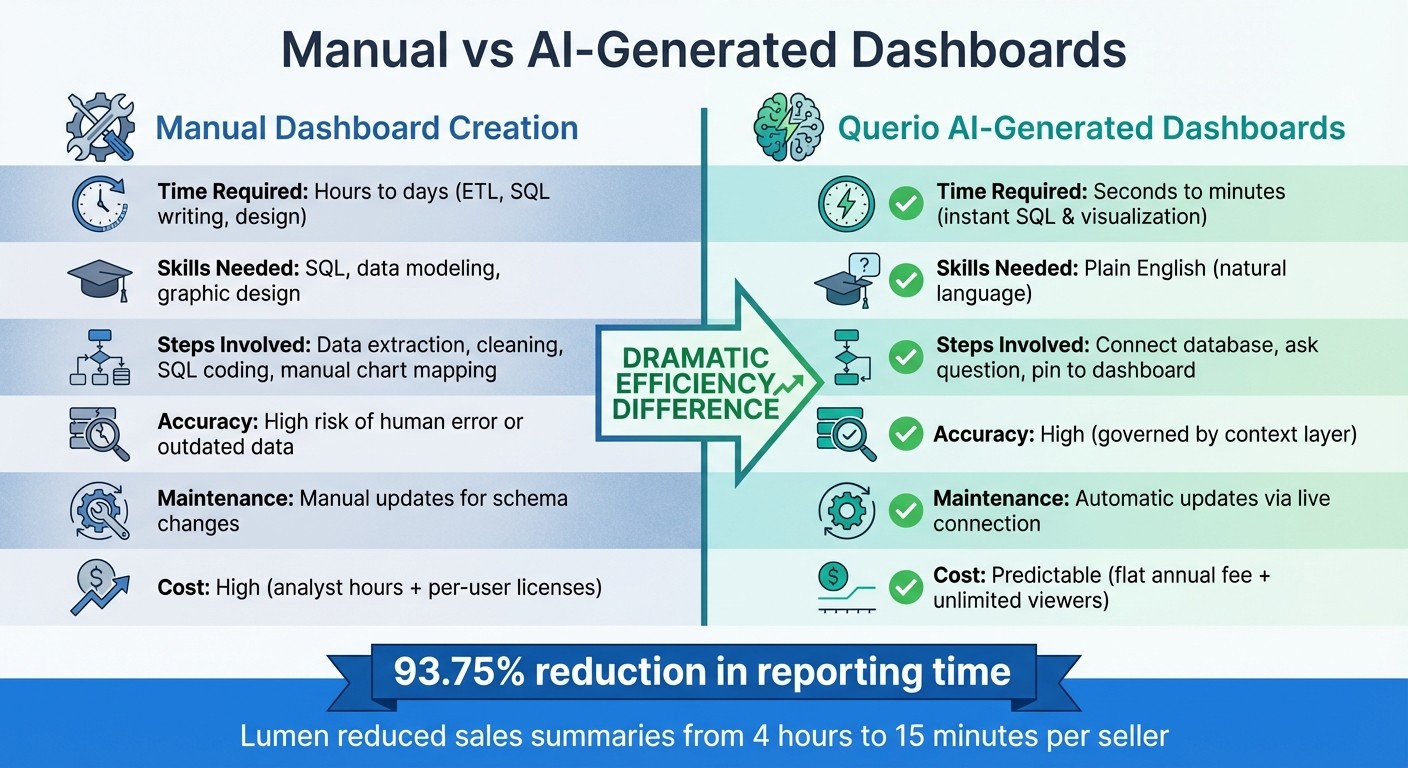
Here's a real-world success story: In 2024, Lumen reduced the time spent on sales summaries from 4 hours to just 15 minutes per seller - a massive 93.75% improvement in efficiency.
To ensure accuracy and consistency, Querio also allows users to refine visualizations with its context layers.
Adding Context Layers to Dashboards
After generating initial visualizations, data teams can fine-tune the results using Querio's context layer. This feature standardizes joins, metrics, and creates a shared glossary of terms. For example, when someone queries "revenue", the context layer ensures the results align with the company’s official definition rather than an improvised calculation. Once configured, this governance applies automatically to all future queries, empowering business users while maintaining data integrity.
Once dashboards are refined, they’re ready to be shared both internally and externally.
Embedding and Sharing Dashboards
Querio makes sharing dashboards effortless. Internally, dashboards can be distributed to unlimited viewers at no extra cost, breaking down data silos across departments. Externally, Querio offers Headlines APIs and theme tokens, enabling businesses to embed dashboards into their platforms while maintaining a consistent design.
As Jennifer Leidich, Co-Founder & CEO of Mercury, explained: "What used to be a week-long process now takes minutes."
Embedded dashboards stay connected to live data, ensuring viewers always see the most current information without manual updates.
Manual vs AI-Generated Dashboards
The advantages of Querio's AI-powered approach are clear when compared to traditional dashboard creation:
Feature | Manual Dashboard Creation | Querio AI-Generated Dashboards |
|---|---|---|
Time Required | Hours to days (ETL, SQL writing, design) | Seconds to minutes (instant SQL & visualization) |
Skills Needed | SQL, data modeling, graphic design | Plain English (natural language) |
Steps Involved | Data extraction, cleaning, SQL coding, manual chart mapping | Connect database, ask question, pin to dashboard |
Accuracy | High risk of human error or outdated data | High (governed by context layer) |
Maintenance | Manual updates for schema changes | Automatic updates via live connection |
Cost | High (analyst hours + per-user licenses) | Predictable (flat annual fee + unlimited viewers) |
Benefits of Querio's AI-Generated Dashboards for Businesses
Cutting Down Manual Work and Reducing Analyst Dependency
Imagine Marketing, Sales, and Finance teams generating insights in plain English - no waiting, no bottlenecks. With Querio, the days of relying heavily on data analysts for routine tasks are over. Business users can get answers in seconds, allowing data teams to pivot their focus toward more strategic initiatives.
Take Midwest Precision Manufacturing as an example. In 2025, they implemented Querio to monitor their manufacturing systems in real time. This move eliminated the need for manual analysis of equipment downtime, saving them $45,000 annually. Previously, a single analyst spent 15–20 hours each month creating standard reports. Querio's automation reclaimed all that time, transforming how they worked.
Speeding Up Decisions with Automated Reports
Querio doesn’t just save time - it speeds up the entire decision-making process. With essential BI tool features like scheduled reports and mobile push notifications, insights are delivered right when they’re needed, no manual effort required. Executives can get daily revenue updates, operations teams can monitor production metrics on a set schedule, and alerts trigger whenever thresholds are crossed. This turns dashboards into dynamic tools for action, rather than static displays of data.
Saving Costs and Scaling Without Extra Hires
Automation with Querio doesn’t just save time - it drives cost efficiency. By cutting manual reporting time by 80%, businesses can scale their output without increasing headcount. Querio’s flat fee and unlimited viewer access eliminate costly per-seat pricing, delivering real value. On average, mid-sized companies report savings of $45,000 annually - proof that automation pays off.
Prioritizing Security and Governance
Querio ensures that businesses operate securely and efficiently. With SOC 2 Type II compliance and a 99.9% uptime SLA, it meets the highest enterprise-grade standards. Its centralized Context Layer enforces consistent business definitions across all queries, avoiding the inconsistencies that plague traditional BI tools. This is made possible by a robust AI query layer that bridges the gap between users and databases. Plus, Querio’s AI achieves about 90% accuracy for structured data queries, ensuring reliable and precise insights. These features make Querio a dependable partner for delivering real-time, actionable data while keeping security and governance front and center.
Querio's Advanced Capabilities for Governed Insights
In-House Python Notebooks for Advanced Analytics
Querio’s Python notebook combines SQL and Python directly within the BI tool, so data teams no longer need to jump between different platforms. Everything - exploration, analysis, and visualization - is handled in one place. Plus, the built-in AI co-pilot streamlines SQL and Python workflows, cutting report creation time by half.
This setup allows for deep data analysis without bogging down analysts with repetitive tasks. Metadata and data models can be documented in a single, centralized location, keeping processes clear and efficient. Non-technical users can even handle straightforward queries themselves using smart SQL and Python tools, which eases the burden on core data teams. In fact, this feature has been shown to reduce data request backlogs by 80%. Querio’s all-in-one approach ensures accurate and governed insights are accessible across the organization.
Unlimited Viewers and Embedded Analytics
Querio doesn’t just stop at analytics - it makes data accessible across the board. With unlimited viewer access, businesses can share insights with their entire organization without worrying about per-user licensing fees. Whether your team includes 50 people or 5,000, the pricing remains straightforward and predictable.
For even more flexibility, Querio’s embedded analytics lets you integrate dashboards into external platforms and applications. This means external stakeholders or partners can securely view insights without needing direct access to your internal systems. By embedding data into existing workflows, users can stay focused and productive without constant context switching.
Premium Features with No Hidden Costs
Querio pairs its powerful analytics tools with a premium offering that’s clear and upfront about pricing - no hidden fees. Features like comprehensive audit logs give you full visibility into user activity, making it easier to monitor usage and spot trends.
Conclusion
Key Takeaways
Querio transforms raw warehouse data into clear, actionable dashboards with minimal effort. Thanks to its natural language querying, anyone can ask questions in plain English and receive accurate visualizations in seconds - no SQL knowledge required. With direct integrations to platforms like Snowflake, BigQuery, and Postgres, the insights are always real-time and governed.
The platform's single-set semantic layer ensures consistent data governance throughout the organization. Features like unlimited viewer access, embedded analytics tools, and straightforward pricing eliminate the headaches of hidden fees or per-user licensing. Querio makes enterprise-level business intelligence accessible for teams of all sizes, empowering you to take informed, data-driven actions.
Next Steps
To get started, connect Querio to one of your data sources and test its AI-powered dashboard generation with a pilot dataset. Let the platform suggest visualizations based on your data, and tweak them using plain English commands. Set up the semantic layer to define key business terms and relationships, ensuring your team works from a unified, governed data foundation - no more manual reporting delays.
Once you're comfortable with the basics, dive deeper using the Python notebook for advanced analysis or schedule automated reports for stakeholders. Querio's intuitive setup and money-back guarantee make it easy to see results quickly - whether you're looking to reduce reliance on analysts, speed up decision-making, or scale insights across your organization.
FAQs
How does Querio maintain data accuracy and consistency for teams?
Querio guarantees precise and consistent data by linking every dashboard directly to live data sources, steering clear of outdated static snapshots. When a team member poses a question in natural language, Querio taps into up-to-the-minute information from databases like Snowflake or BigQuery, creating real-time visuals. This approach removes the risk of manual errors and ensures everyone is working with the most current numbers.
To maintain data integrity, Querio implements role-based access controls, encrypts data during transit and storage, and maintains detailed audit logs to track who accessed what and when. These safeguards prevent unauthorized modifications and provide a transparent record for accountability.
On top of that, Querio's collaboration tools let users share dashboards and visualizations while keeping data definitions consistent. By ensuring all teams rely on the same governed data model, Querio enables organizations to align on trustworthy insights and make confident, informed decisions.
How does Querio ensure the security of my data?
Querio places a strong emphasis on keeping your data safe by blending strict governance policies with a secure infrastructure. It connects directly to your databases using live, authenticated connections, ensuring that access is tightly controlled. With clear data-governance rules in place, only authorized users can view or interact with specific datasets, giving you peace of mind about who can access your information.
On top of that, Querio's system architecture is designed to protect your data at every stage. Whether it's in transit or stored, your information is safeguarded to maintain privacy and security. At the same time, Querio ensures that your team can access the data they need without interruptions, combining safety with efficiency.
Can I customize AI-generated dashboards in Querio to fit my business needs?
Querio’s AI-generated dashboards offer a high level of customization to match your business needs. You can tweak chart types, adjust colors, and rearrange layouts effortlessly. With intuitive drag-and-drop tools, you can design dashboards that align perfectly with your objectives. This adaptability ensures your data is displayed in a clear and actionable format, making it easier to make decisions quickly and effectively.
Related Blog Posts