Business Intelligence
What Is AI/BI? How AI Is Reshaping Business Intelligence Dashboards
AI-enhanced BI dashboards let teams ask plain-English questions, get live warehouse answers, governed metrics, alerts, and inspectable logic.
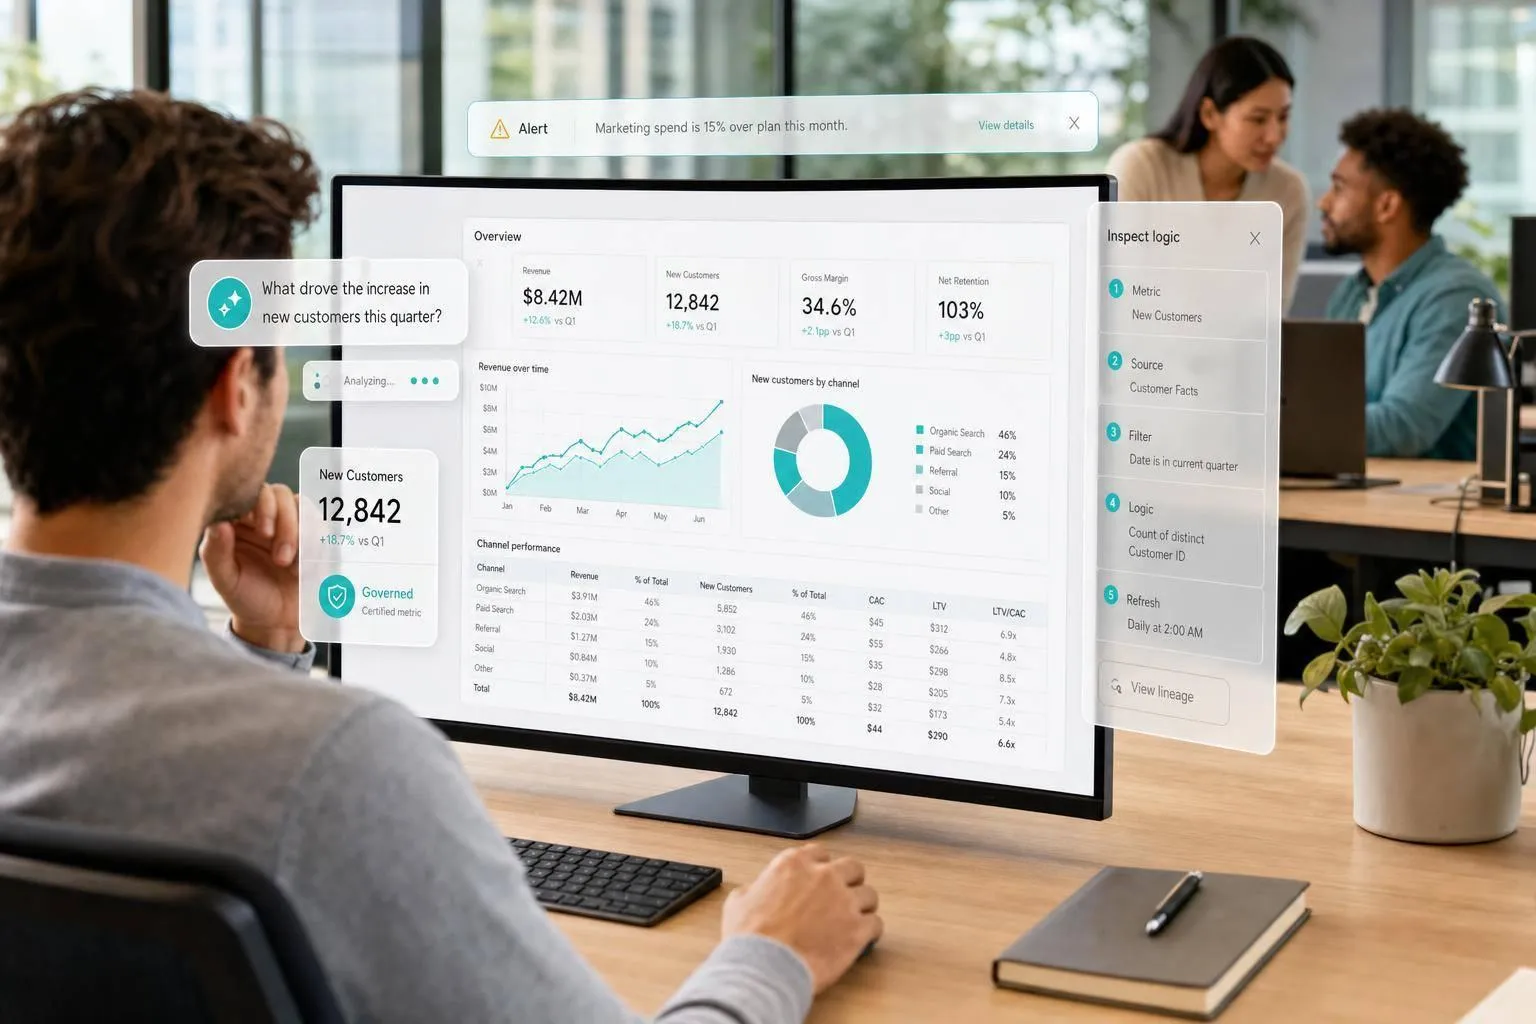
AI/BI means BI tools with chat, governed metrics, live warehouse access, and built-in explanations. For many SaaS teams, that can cut answer time from hours or days to seconds and trim a big share of analyst back-and-forth.
Here’s the short version: static dashboards only answer the questions they were built for. AI/BI lets me ask plain-English questions, get answers from warehouse data, inspect the SQL or Python, and keep metric rules in one place. That matters when teams track things like MRR, ARR, churn, activation rate, pipeline coverage, and support volume.
What changed:
- I can ask follow-up questions instead of opening new tickets
- Teams can get alerts when a metric moves out of range
- Each role can see the metrics that matter to them first
- Analysts can check the logic behind each answer
- Data teams still need metric rules, permissions, and modeled warehouse data
A simple way to think about it:
| Area | Static dashboards | AI/BI dashboards |
|---|---|---|
| How I use it | Click filters and charts | Ask questions in plain English |
| Time to answer | Often hours to days | Often seconds |
| Follow-up questions | Usually need an analyst | Can happen in the same thread |
| Metric trust | Can drift across dashboards | Tied to one metric layer |
| Monitoring | Manual checks | Alerts and auto-written notes |
| Access | More suited to analysts | Easier for non-technical teams |
Bottom line: AI/BI does not fix bad data. If metric definitions, joins, or permissions are off, it just returns wrong answers faster. But when the warehouse, semantic layer, and access rules are set up well, dashboards stop being static reports and start acting more like a working analysis tool.
Getting the most out of AI/BI Dashboards with Databricks One and UC Metrics
::: @iframe https://www.youtube.com/embed/eELSgcwbpIw :::
sbb-itb-284a532
The Core AI/BI Features Reshaping Dashboards
AI/BI turns dashboards into actual decision tools. Instead of acting like static reports, they help people ask questions, spot changes, and figure out what to do next. That matters because it cuts down analyst bottlenecks and makes self-serve analytics far more usable for non-technical teams.
Natural Language Questions and Conversational Analysis
A business user can ask a plain-English question and get an answer backed by the warehouse, without waiting in a ticket queue for an analyst.
But there’s a catch: this only works if the system maps terms to governed metric definitions. If it doesn’t, NLQ can sound confident while giving the wrong answer. And that’s a fast way to lose trust.
The better systems don’t guess relationships from column names alone. They resolve relationships across modeled warehouse schemas, which makes follow-up questions easier and keeps answers tied to the data you actually have. In plain terms, people get faster access to governed answers, with less back-and-forth in between.
Once those queries are governed, the next step is spotting changes before anyone even asks.
Automated Insights, Anomaly Detection, and Metric Explanations
Anomaly detection flags when a metric moves outside its expected range, like a sudden drop in activation or a spike in failed payments. That gives teams a chance to catch a problem earlier, instead of finding it days later during a dashboard review.
Flagging a change is helpful. Explaining it is where the time savings show up.
The most useful AI/BI platforms connect metric explanations to inspectable logic and traceable context, so analysts can see how the system reached a conclusion. A churn alert without traceable reasoning is only half an insight. Teams need to know whether an explanation comes from defined logic or model inference. [2]
Once a system can explain what changed, it can also decide which changes matter most for each person.
Dashboard Personalization and Proactive Alerts
A product manager, finance leader, and support lead don’t look for the same numbers. So when everyone shares one dashboard, people often end up filtering it by hand just to find what matters to them.
AI/BI platforms can set role-specific defaults, so each person sees the metrics they actually use. That makes dashboards less cluttered and more useful day to day.
Just as important, proactive alerts change the workflow itself. Instead of opening the dashboard every morning and hoping something stands out, people get notified when something worth their attention happens. For small data teams, that cuts a lot of repeated status checking.
Traditional BI Dashboards vs. AI/BI Dashboards
::: @figure 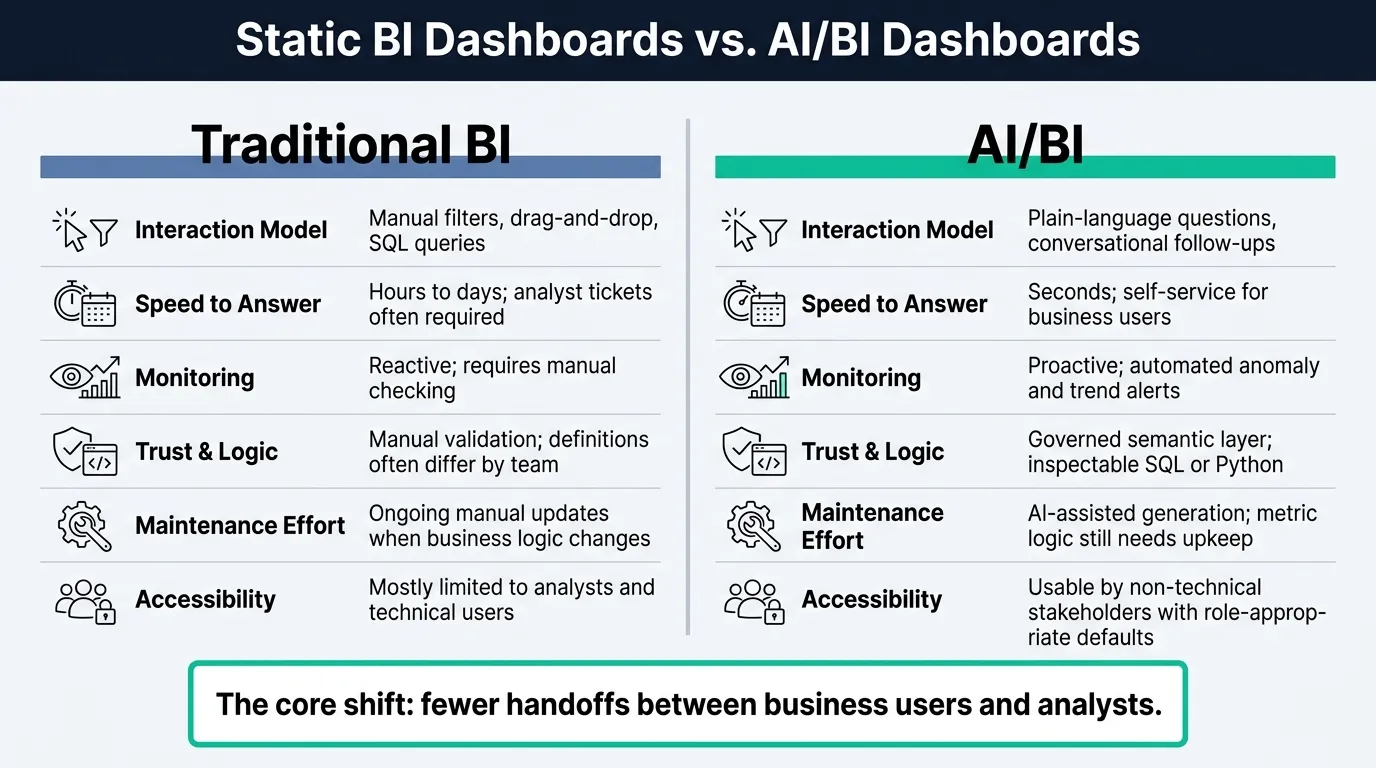 {Static BI Dashboards vs. AI/BI Dashboards: Key Differences}
:::
{Static BI Dashboards vs. AI/BI Dashboards: Key Differences}
:::
The big difference comes down to workflow. Traditional dashboards answer questions you already planned for. AI/BI lets people ask follow-up questions in plain English and get answers much faster.
For a 100–500-person SaaS team, that change shows up fast in RevOps, finance, product, and support.
| Dimension | Traditional BI Dashboards | AI/BI Dashboards |
|---|---|---|
| Interaction Model | Manual filters, drag-and-drop, SQL | Plain-language questions, conversational follow-ups |
| Speed to Answer | Hours to days; analyst tickets often required | Seconds; self-service for business users |
| Monitoring | Reactive; requires manual checking | Proactive; automated anomaly or trend alerts |
| Trust & Logic | Manual validation; definitions often differ by team | Governed semantic layer; inspectable SQL or Python |
| Maintenance Effort | Ongoing manual updates when business logic changes | AI-assisted generation, but metric logic still needs upkeep |
| Accessibility | Mostly limited to analysts and technical users | Usable by non-technical stakeholders with role-appropriate defaults |
The core shift isn't prettier charts. It's fewer handoffs between business users and analysts.
Where AI/BI Improves Speed and Accessibility
In a standard setup, a revenue operations manager who wants to know which accounts are at risk of churn has to hunt for the right dashboard, add filters across several views, and sometimes ask an analyst for a custom report. That can drag on for hours or even days.
AI/BI shrinks that process. The same manager can type the question, get an answer from the warehouse, and move on. That means fewer analyst tickets and faster decisions. Warehouse-native BI tools are starting to add chat-style interfaces so non-technical users can ask questions without writing SQL.
But here's the catch: this only works if the data layer and metric definitions stay governed.
Where Governance Still Matters Most
Speed is nice. A right answer is better.
This is where many AI/BI setups get messy. If the system sits on top of conflicting KPI definitions, it may return answers fast, but those answers won't hold up. When logic changes from team to team, speed just creates more rework.
The semantic layer, certified metrics, and row-level permissions are the base layer here. Tools like dbt encode transformation logic and KPI definitions in version-controlled pipelines, providing a single source of truth across teams. [4][5] Row-level and role-based permissions ensure that a regional sales manager only sees their territory's data, not the whole company's. [3][4] That's what makes AI/BI usable day to day.
That leads straight to the next layer: the warehouse, metric, and permission setup underneath the dashboard.
What Data Teams Need in Place for AI/BI to Work
Once the dashboard layer starts doing its job, the next issue is what needs to be solid underneath it. AI/BI is only as good as the warehouse beneath it. If the data is messy or permissions are loose, you just get wrong answers faster.
Modeled Warehouse Data and Governed Metric Definitions
The starting point is a central cloud data warehouse - Snowflake, BigQuery, Redshift, or Postgres - that brings product, billing, and customer data into one governed warehouse.[10] But the raw warehouse layer isn't enough on its own. Teams still need modeled tables and shared metric definitions.
That’s where a transformation layer like dbt comes in. It turns raw tables into tested, documented models that map to business entities people actually use, like customers, subscriptions, invoices, and events.[8]
For non-technical users, plain-English questions need to resolve against the same modeled data analysts already trust. In practice, that means defining ARR, MRR, churn, and active users once in a semantic layer such as dbt Semantic Layer or LookML, so every dashboard and AI query uses the same logic.[6] Change one definition, and the connected dashboards and AI queries pick up that same update.[10]
A smart place to begin is with the top 20 leadership metrics by dashboard view count. Define each one with its dimensions, filters, and refresh cadence.[7]
Inspectable Logic, Permissions, and Auditability
Speed and access mean very little if people can't trust the answer. Inspectable logic is required for executive and board reporting.
When an AI/BI system gives an answer, analysts and stakeholders should be able to inspect the exact SQL or Python behind it, not just the final output. Otherwise, errors are harder to spot, results are harder to explain, and metric changes become much harder to trace.
The same access rules should hold whether someone clicks through a dashboard or asks a question in chat. Use the same permissions and certified metrics for both dashboards and conversational queries.[9][11] Version control, lineage, and tests help teams trace metric changes over time.[6]
With that base in place, AI/BI can stay fast, self-serve, and auditable. That base is what makes live, governed AI/BI possible.
How Querio Applies AI/BI in a Governed, Warehouse-Native Workflow
Live Warehouse Answers with Governed Context
With governed metrics in place, Querio can answer questions straight from the live warehouse. It connects through read-only connections to Snowflake, BigQuery, Redshift, ClickHouse, MotherDuck, and PostgreSQL.
But Querio does more than run live queries. The data team sets joins, metrics, and business terms once, and Querio uses that same context across questions and dashboards. That keeps answers consistent instead of letting every report drift in its own direction.
If a team wants to check an answer or build on it, they can inspect the generated logic directly. No black box. No guessing what happened behind the scenes.
Inspectable SQL, Python, and Reactive Notebooks
Every answer comes with editable SQL or Python. Analysts can review the logic, test it, and reuse it in their own work.
And when one dashboard answer leads to the next question - which is usually how analysis goes - Querio’s reactive notebooks let analysts keep digging without switching tools. As logic changes, the notebook stays editable, and the work remains reusable and shared across the team.
What AI/BI Changes for Growing SaaS Teams
In day-to-day work, this cuts down the wait for ad hoc analysis and gives teams more time to act on what they find. For SaaS data teams, that means faster self-serve analysis without giving up control of metric definitions.
Put simply, AI/BI helps small data teams serve both analysts and business users with faster answers that still follow the rules set by the team.[1][2]
FAQs
::: faq
What makes AI/BI different from BI dashboards?
AI/BI shifts business intelligence from static reporting to interactive, AI-driven decision support.
Instead of relying on BI dashboards filled with prebuilt reports, users can ask questions in plain English, dig into data on the fly, surface automated insights, and spot likely trends before they hit.
A governed semantic layer helps keep metrics consistent and reliable across teams. That means people spend less time arguing over numbers and more time making faster, more forward-looking decisions. :::
::: faq
What needs to be in place before AI/BI will work well?
Start with clean, well-structured data, clear naming rules, and schemas that leave less room for confusion. That makes day-to-day analysis a lot less messy.
You also need a governed semantic layer, often tied to dbt, to turn raw warehouse data into shared business definitions for metrics like revenue or churn. Without that layer, two people can look at the same data and still come away with different answers.
Last, check for data quality issues and use secure, read-only live connections to Snowflake, BigQuery, Redshift, or Postgres. That way, your warehouse remains the single source of truth. :::
::: faq
Can non-technical teams trust AI/BI answers?
Yes - if the platform uses a governed semantic layer and logic that teams can inspect.
Modern platforms like Querio standardize metric definitions, so people get consistent answers instead of conflicting numbers. And because natural-language questions are turned into readable SQL or Python that runs against the live warehouse, data teams can audit, verify, and refine the logic at any time. :::