Guide
SQL for Product Managers: Practical Queries for 2026
Learn SQL for product managers with hands-on queries for retention, funnels, and experiments. Work smarter with data teams and avoid common pitfalls.

At 9:00 on Monday, a PM opens Slack to find three versions of the same question. Growth wants active users, marketing wants activation, and the chief product officer wants to know whether a recently released feature is retaining customers. The dashboard answers none of them cleanly because each team uses a different event definition, date range, or user grain. An analyst could resolve the disagreement, but the request queue is already full.
SQL for product managers becomes practical when you turn recurring product questions into reproducible queries. You don't need to become a database engineer. You need to understand what each query counts, and spot the logical errors that make plausible numbers wrong. The working set is smaller than most tutorials suggest: SELECT, WHERE, GROUP BY, a date filter, and one carefully written JOIN answer a large share of weekly product asks.
Table of Contents
- Why Product Managers Need SQL in 2026
- The Core SQL Building Blocks Every PM Should Know
- Querying Growth Metrics DAU WAU MAU and Retention Cohorts
- Funnels and Experiments in SQL
- Filter Placement in LEFT JOINs and Other Pitfalls
- Access Security and Working With Your Data Team
- Your SQL Starter Library and 30 60 90 Day Plan
Why Product Managers Need SQL in 2026
A PM who can query a read-only analytics replica can move from “Can someone pull this?” to “Here is the definition, query, and result we can review.” That shift matters most when the question is specific to a launch, customer segment, onboarding path, or experiment that no existing dashboard anticipated.
SQL has been the interface for relational data because it lets people ask structured questions across connected tables. Its roots trace back to 1970, when Edgar F. Codd published the relational model that SQL would later operationalize. IBM engineers developed SEQUEL, Oracle introduced the first commercially available implementation in 1979, and the first formal ANSI SQL standard arrived in 1986. The documented history of SQL helps explain why the language still feels universal inside modern warehouses.
The product advantage: SQL doesn't replace judgment. It reduces the distance between a product hypothesis and a checkable answer.
SQL remains a mainstream data skill rather than a niche technical specialty. One industry summary reported that 62% of developers used SQL regularly in 2023, 51% used it daily, and approximately 45 million SQL developers existed globally that year. The same summary cited SQL in 65% of applications worldwide and 72% of web applications. Separate 2025 survey reporting placed SQL as the third most popular programming language at 59% usage, with 72% of developers using it regularly. These figures appear in the Oracle SQL history reference.
The requirement varies by environment. At an early-stage startup, a PM may need SQL because there isn't an analyst available for every follow-up. At a larger company, dashboards and an analytics team may handle standard reporting, while SQL becomes essential for investigating edge cases, validating metric definitions, and preparing a focused product readout. In both settings, fluency helps PMs ask better questions of engineering and data teams.
By the end of this guide, you should be able to query core growth metrics, build a basic funnel, compare experiment variants, preserve the meaning of a LEFT JOIN, and establish a safe starter library. The point isn't to memorize syntax. The point is to make recurring product questions repeatable.
The Core SQL Building Blocks Every PM Should Know
Most PM queries become easier once you can predict the role of five clauses. Use a familiar example, an events table containing product activity and a users table containing account attributes.
SELECT
    DATE_TRUNC('day', event_timestamp) AS event_day,
    COUNT(DISTINCT user_id) AS active_users
FROM events
WHERE event_name = 'session_started'
  AND event_timestamp >= CURRENT_DATE - INTERVAL '30 days'
GROUP BY 1
ORDER BY 1;
SELECT defines the output. Here, it asks for a calendar day and a distinct count of users. FROM identifies the source table. WHERE limits the activity to session starts inside a recent date window. GROUP BY turns individual event rows into one result per day.
A JOIN adds context from another table. For example, you might connect activity to a user's plan:
SELECT
    u.plan_type,
    COUNT(DISTINCT e.user_id) AS active_users
FROM users u
JOIN events e
  ON u.user_id = e.user_id
WHERE e.event_name = 'session_started'
GROUP BY u.plan_type;
The JOIN condition says how rows relate. The WHERE clause says which joined rows qualify. That distinction becomes critical with outer joins, covered later.
Before exploring an unfamiliar table, use a small result limit. The practical SQL patterns for product managers recommend LIMIT 100 as a disciplined exploration habit, alongside the core patterns of SELECT, WHERE, GROUP BY, date filtering, and a single JOIN. A limit protects you from dumping an entire event stream into a notebook while you learn the schema.
Read the event grain before reading the metric
An events table usually contains fields such as:
user_id, the person or account associated with the action.event_name, the action type, such assession_started,project_created, orcheckout_completed.event_timestamp, the moment the event occurred.event_properties, optional context such as device, plan, or feature metadata.- Identifiers, such as
event_id, which distinguish one event row from another.
The same user can generate many rows. That means COUNT(*) measures events, while COUNT(DISTINCT user_id) measures users. Predicting that difference before execution is one of the most useful habits in SQL for product managers.
If your company's tables, naming conventions, and relationships are unfamiliar, review these key database design principles before building a metric library. Good query work starts with knowing whether a table represents users, events, subscriptions, or another grain.
A short video walkthrough can reinforce the mechanics visually:
Querying Growth Metrics DAU WAU MAU and Retention Cohorts
DAU, WAU, and MAU are variations on the same operation. Start with a defined active event, select a time bucket, and count distinct users inside that bucket.
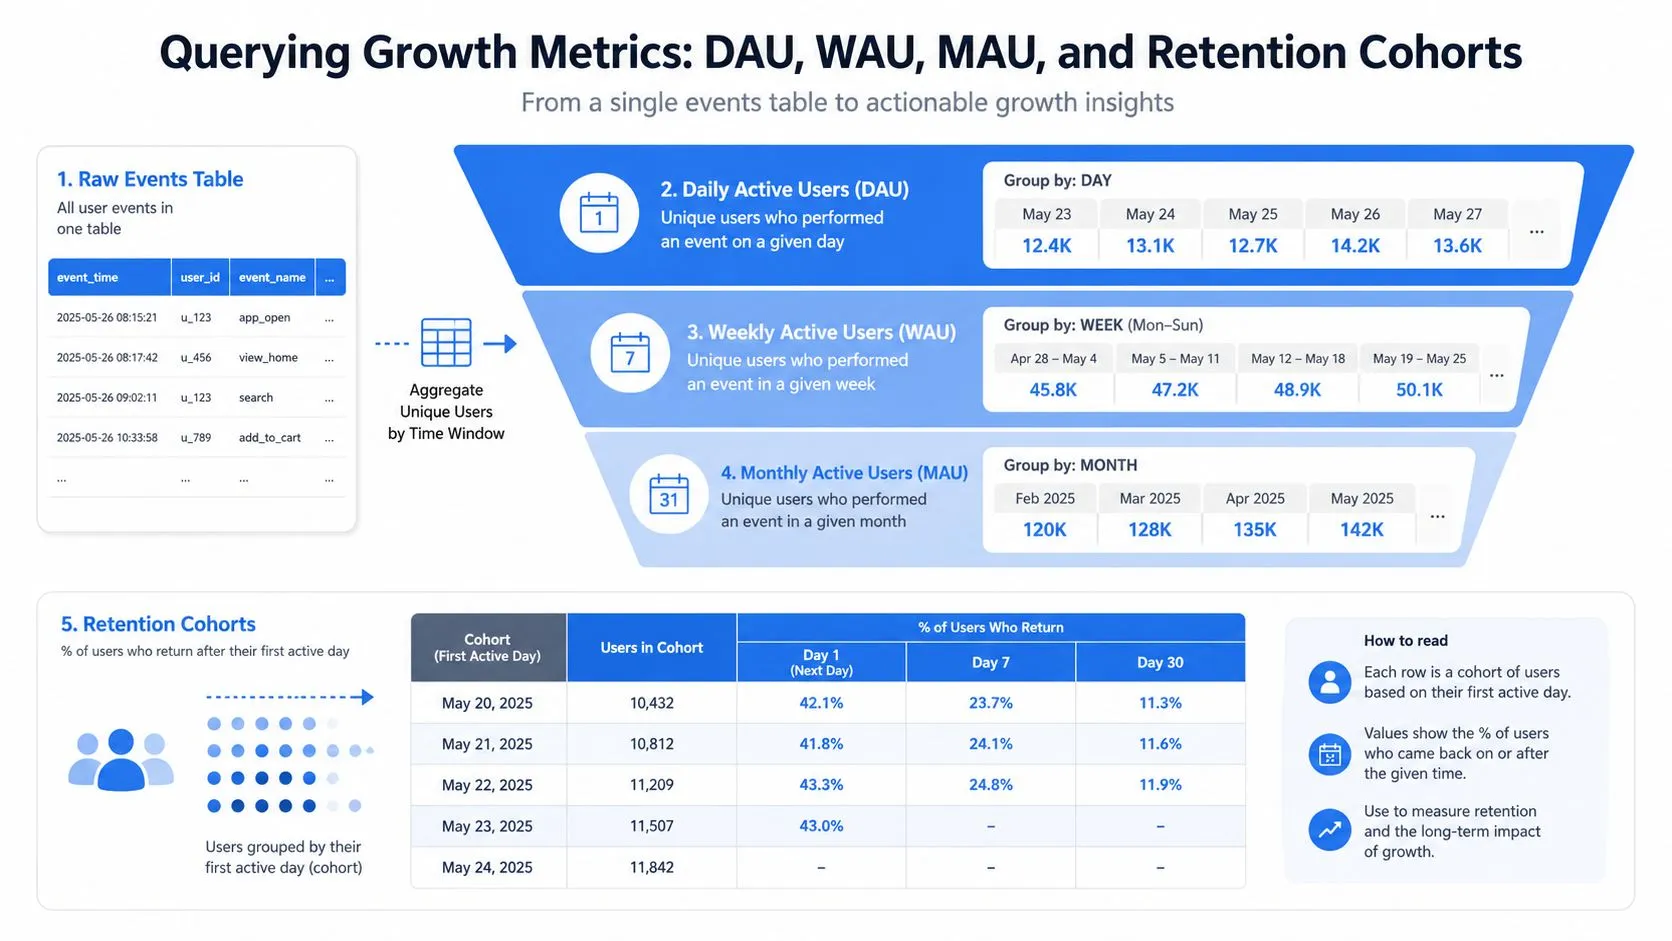
For daily active users:
SELECT
    DATE_TRUNC('day', event_timestamp) AS period,
    COUNT(DISTINCT user_id) AS active_users
FROM events
WHERE event_name IN ('session_started', 'core_action')
GROUP BY 1
ORDER BY 1;
Change the truncation to week for WAU or month for MAU. The syntax is simple, but the product definition isn't. Decide whether “active” means any login, a meaningful workflow, or a specific core action. Keep that definition consistent in the saved query and metric documentation.
Retention requires a second relationship: when the user joined and whether that user returned. A cohort query first assigns each user a signup period, then finds later activity periods.
WITH cohorts AS (
    SELECT
        user_id,
        DATE_TRUNC('week', signup_timestamp) AS signup_week
    FROM users
),
activity AS (
    SELECT DISTINCT
        user_id,
        DATE_TRUNC('week', event_timestamp) AS activity_week
    FROM events
    WHERE event_name = 'core_action'
)
SELECT
    c.signup_week,
    a.activity_week,
    COUNT(DISTINCT c.user_id) AS retained_users
FROM cohorts c
JOIN activity a
  ON c.user_id = a.user_id
GROUP BY 1, 2
ORDER BY 1, 2;
The cohort table must be ordered by signup period because retention compares users who started in the same period. A naïve day-N calculation can undercount users who join midway through a reporting window, especially when the product team hasn't agreed on whether the measurement is based on exact elapsed time or calendar periods.
Choose the retention definition before writing the query
A rolling definition counts a user as retained if they return at any point during the target period. A constant definition checks activity in a specific period or exact interval. Both can be reasonable, but they answer different questions. Document the choice alongside the query so a dashboard and a launch readout don't use different denominators.
For a deeper explanation of cohort structures and interpretation, use this guide to what cohort analysis means. SQL can produce the grid, but product judgment determines whether the grid represents a useful customer behavior.
Funnels and Experiments in SQL
A funnel query should count users who completed each step, not merely the number of rows generated by each event. If one person opens a checkout screen repeatedly, event counts inflate the apparent audience. For most product decisions, COUNT(DISTINCT user_id) is the safer grain.
WITH funnel AS (
    SELECT
        user_id,
        MAX(CASE WHEN event_name = 'signup_completed' THEN 1 ELSE 0 END) AS signed_up,
        MAX(CASE WHEN event_name = 'project_created' THEN 1 ELSE 0 END) AS created_project,
        MAX(CASE WHEN event_name = 'invite_sent' THEN 1 ELSE 0 END) AS sent_invite,
        MAX(CASE WHEN event_name = 'checkout_completed' THEN 1 ELSE 0 END) AS checked_out
    FROM events
    WHERE event_timestamp >= :start_date
      AND event_timestamp < :end_date
    GROUP BY user_id
)
SELECT
    COUNT(*) AS users_in_scope,
    SUM(signed_up) AS signup_users,
    SUM(created_project) AS project_users,
    SUM(sent_invite) AS invite_users,
    SUM(checked_out) AS checkout_users
FROM funnel;
This is a user-level funnel. It asks whether each user completed a step during the selected window. An event-level funnel instead counts every occurrence, which can help diagnose repeated attempts but usually isn't the right basis for conversion decisions.
Order matters too. The query above records whether steps happened, not whether they happened in sequence. If the product question is sequential conversion, capture each user's first timestamp for every step and compare those timestamps. Otherwise, a user who completed checkout before creating a project could appear to have followed the intended path.
The same discipline applies to experiments. Suppose the users table stores variant, and events contain the outcome action:
SELECT
    u.variant,
    COUNT(DISTINCT u.user_id) AS assigned_users,
    COUNT(DISTINCT CASE
        WHEN e.event_name = 'checkout_completed' THEN u.user_id
    END) AS converted_users
FROM users u
LEFT JOIN events e
  ON u.user_id = e.user_id
WHERE u.experiment_name = 'new_checkout'
GROUP BY u.variant;
The LEFT JOIN keeps assigned users who haven't converted. Calculate conversion rates outside this aggregation using the assigned-user count as the denominator. Before publishing a result, check that assignment counts align with the experiment design and ask a statistician or experienced analyst to review inference, exposure rules, eligibility, and sample-ratio concerns.
For a complementary framework, see this guide to conversion funnel analysis. It reinforces the central distinction: the query needs to match the user behavior and decision being measured.
Filter Placement in LEFT JOINs and Other Pitfalls
The most dangerous PM queries often run successfully. Their output looks reasonable, but a misplaced filter changes the population.
Compare these two versions:
SELECT
    u.user_id,
    e.event_name
FROM users u
LEFT JOIN events e
  ON u.user_id = e.user_id
 AND e.event_name = 'checkout_completed';
This preserves every user, including users with no checkout event. The condition belongs in the ON clause because it restricts which event rows may match while retaining unmatched users.
SELECT
    u.user_id,
    e.event_name
FROM users u
LEFT JOIN events e
  ON u.user_id = e.user_id
WHERE e.event_name = 'checkout_completed';
The second query removes rows where e.event_name is null. In practice, the WHERE condition turns the outer join into inner-join behavior for that filter. If the product question is “which users converted, including those who didn't,” the result is logically wrong even though the SQL is valid.
Practical rule: Put right-table filters in
ONwhen you need to preserve unmatched left-table rows. Put them inWHEREonly when removing unmatched rows is intentional.
Four quiet ways to damage a result
-
SELECT *on wide tables. The query fetches columns you don't need, which can increase work and make review harder. Fix: select only the fields required for the question. -
No date filter on event data. The warehouse may scan an unnecessarily broad history when the decision concerns a recent release. Fix: add explicit start and end boundaries before exploring or aggregating.
-
Duplicate users after a join. One user can have multiple event or payment rows, multiplying counts. Fix: aggregate the many-side table first or use
COUNT(DISTINCT user_id)at the final grain. -
Confusing
COUNT(*)with user counts.COUNT(*)counts rows, not people. Fix: chooseCOUNT(DISTINCT user_id)when the metric is about users.
The technical guidance on SQL for product managers from scratch also highlights date filters, avoiding wide scans, and keeping right-side LEFT JOIN conditions in the ON clause. Treat these as review checks, not optional optimization.
Access Security and Working With Your Data Team
A good query run against the wrong data access pattern is still a problem. Start with a read-only account connected to an analytics replica or approved warehouse environment, not a production system where an exploratory statement could affect operational workloads. Agree on the permitted schemas, expected query behavior, and a practical cost or resource boundary before you begin.
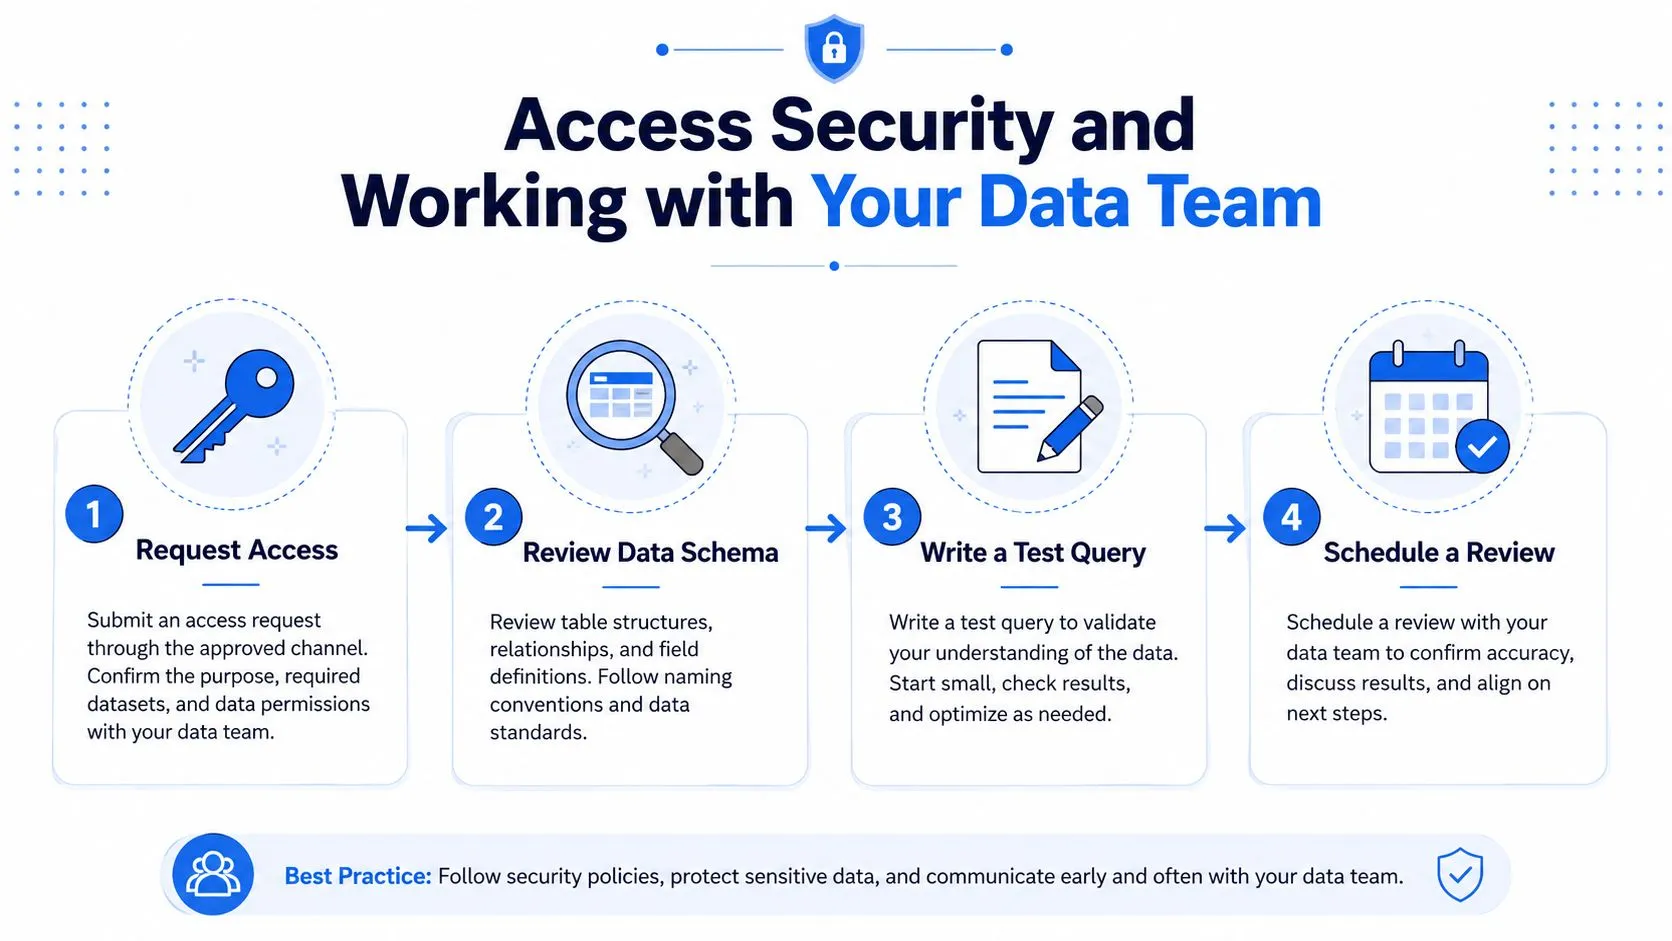
Use this four-part checklist with your data platform partner:
- Request access deliberately. Confirm that credentials are read-only, identify the approved connection, and ask which schemas support product analysis.
- Review the schema. Find the canonical users, events, payments or subscriptions, and support ticket tables. Check primary keys, timestamps, and the grain of each table.
- Test narrowly. Begin with selected columns, a recent date range, and
LIMIT 100. Validate row meanings before building an aggregate. - Schedule review. Share a short query and its intended metric definition in the team's designated review channel. Ask for feedback on joins, permissions, and canonical sources.
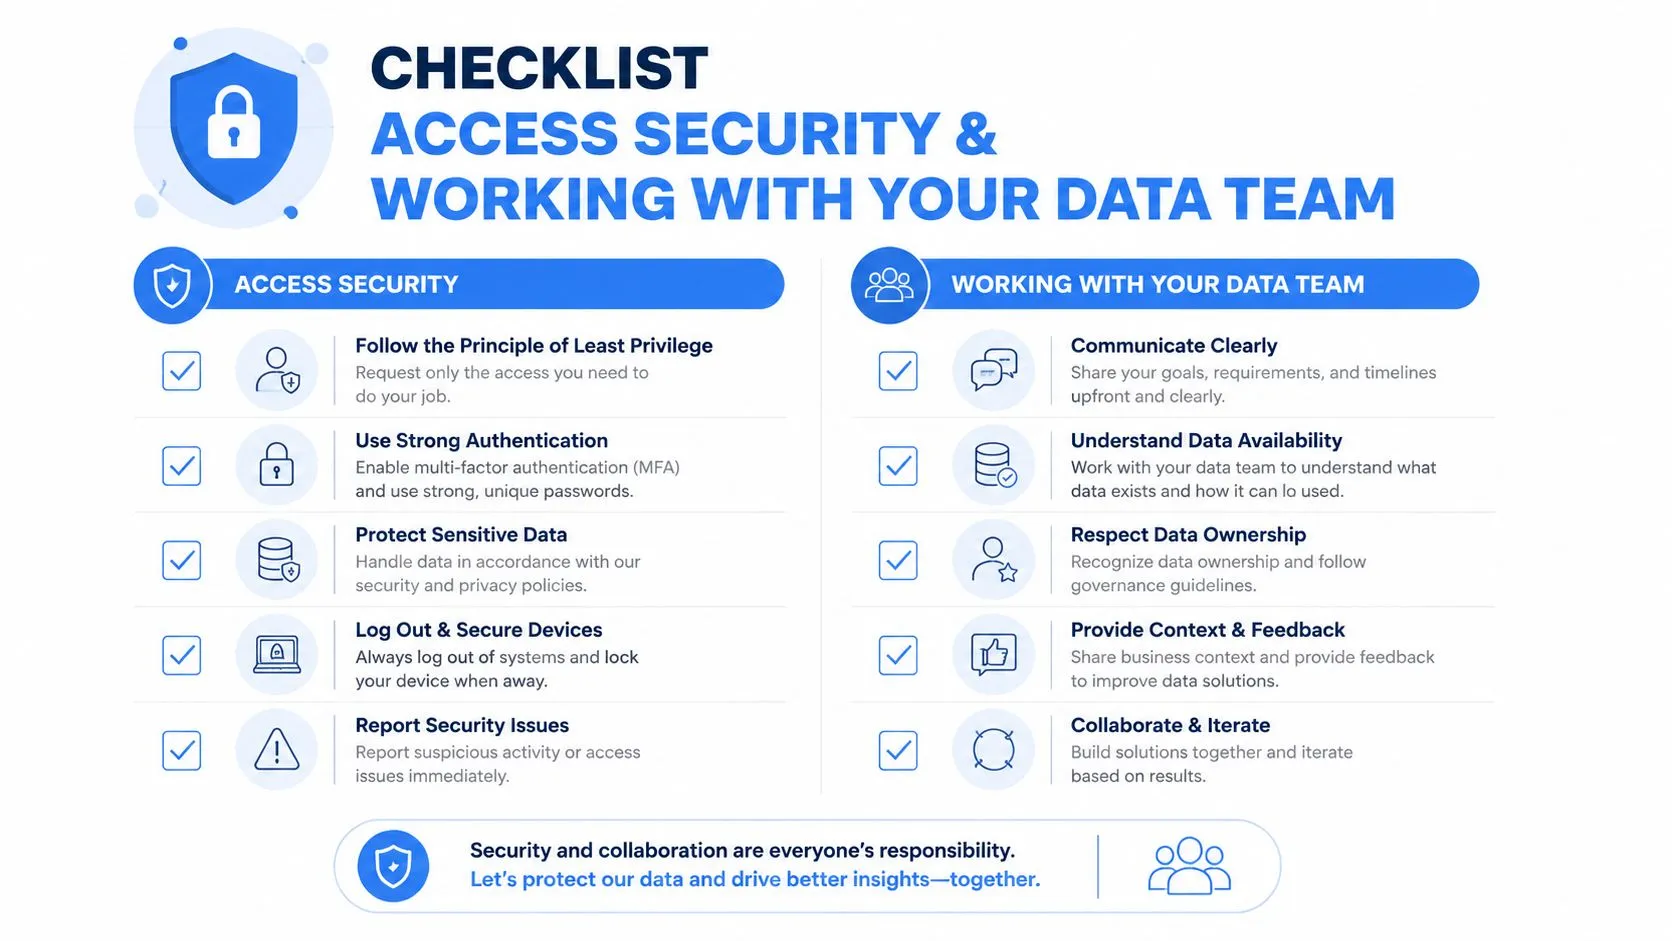
PII needs explicit handling. Learn which columns contain email addresses, names, precise locations, or other sensitive attributes, and avoid copying them into shared notebooks unless the use case requires it. Prefer stable internal identifiers, masked fields, and aggregated outputs. Row-level security can limit what a PM sees, while cached results can reduce repeated warehouse work when the underlying data doesn't need to refresh for every exploratory question.
A shared notebook is often safer than emailing a CSV because permissions, query history, and access can remain attached to the workspace. It also gives the data team a reviewable artifact instead of an unexplained result. The broader database security best practices guide provides useful governance context, but your own platform team should define the controls that apply to your warehouse.
Ask data partners precise questions: “Which event represents a completed activation?” is better than “Can you check activation?” Include the population, time window, expected grain, and decision the result will support. Save approved queries as named files, rather than pasting evolving SQL into chat.
Your SQL Starter Library and 30 60 90 Day Plan
Build a small library around recurring decisions, not an encyclopedic collection of syntax. Start with saved queries for:
- Growth: DAU, WAU, MAU, and retention cohorts.
- Activation: time-to-value, completion of onboarding steps, and first core action.
- Conversion: funnel progression by user and segment.
- Revenue: ARPU, subscription movement, and payment status.
- Retention: churn signals and returning-user behavior.
- Learning: experiment exposure, variant outcomes, and segmentation.
- Customer experience: support trends linked to plan, feature, or account type.
The practical collection of top SQL queries for analytics can help fill gaps in a first notebook. Name files after the question, record the metric definition at the top, and include the expected grain and date parameters.
A realistic adoption path looks like this:
- First 30 days: use approved read-only access, inspect schemas, run existing queries, and verify results against trusted dashboards.
- By 60 days: write feature funnels, segmentation cuts, and experiment readouts with review from an analyst or data engineer.
- By 90 days: agree on shared definitions, canonical tables, naming conventions, and a maintained library that other PMs can use.
Start your notebook with a plain-language prompt: “Which users completed the core action after signup, grouped by signup week and plan, using the canonical event definition?” Then translate that question into SQL, check the grain, and document every assumption. Tools such as Querio can also convert plain-English business questions into SQL and visual reports, giving teams another route to self-serve analysis while preserving the underlying query for review.
Querio helps product teams turn plain-English questions into SQL and visual reports against company data, while giving data teams a reviewable path beyond one-off ticket requests. Visit Querio to explore a more self-serve workflow for recurring product metrics, funnels, and retention analysis.