Guide
SaaS Analytics Platform: A 2026 Guide for Startups
Explore how a SaaS analytics platform empowers startups with AI-driven self-service, migration checklists, and architectural best practices.
You're three tabs deep in a dashboard review, and the numbers still don't line up. Product is asking about activation, finance wants churn by segment, and customer success needs a renewal view before the next call. A data analyst can answer all three, but only after stitching together billing, product, CRM, and support data, then rechecking metric definitions so nobody argues about the result later.
That's the pressure behind a SaaS analytics platform. In a recurring-revenue business, the work doesn't stop at reporting, because the business itself keeps changing every day. Global SaaS revenue reached $467 billion in 2026 (colorlib's SaaS statistics overview), which is why teams keep turning to systems that can track MRR, ARR, churn, CAC, and LTV without forcing every question through a human bottleneck. For a practical companion to the product side of SaaS building, Up North Media's SaaS application guide is worth reading alongside this analysis, and the move from ad hoc reporting toward self-serve analytics is also central to Querio's self-serve BI perspective.
Table of Contents
- Introduction to SaaS Analytics Platforms
- Key Concepts of SaaS Analytics Architecture
- Core Capabilities of Modern SaaS Analytics Platforms
- Business Benefits and Use Cases for SaaS Analytics
- Evaluation Criteria for Startups and Mid-Market Companies
- Checklist for Implementation and Migration
- Comparing Querio with Hex Looker and ThoughtSpot
- Conclusion and Next Steps
Introduction to SaaS Analytics Platforms
A startup founder usually meets analytics at the worst possible time. Churn ticks up, a feature launch misses expectations, support tickets pile up, and the dashboard that was supposed to clarify everything just creates another round of questions. The team has data, but it does not have shared answers.
A SaaS analytics platform gives product, finance, revenue, and customer success teams a common place to work from, instead of forcing each group to rebuild the truth in a separate spreadsheet or BI view. Recurring-revenue companies cannot wait days for a metric that affects pricing, retention, or expansion.
The problem is not just reporting volume. SaaS businesses run on continuous measurement, so the platform has to keep pace with the customer lifecycle, from activation to renewal. Teams that treat analytics like a static reporting layer usually end up with stale dashboards and too many manual requests, which is the exact friction a modern platform is supposed to remove.
A useful way to define the category is simple, the platform should make repeat questions faster to answer, and new questions cheaper to explore. That is the gap between “we have charts” and “we can operate the company from the data.” The operational challenge is maintaining self-serve analytics infrastructure as usage grows, which is why warehouse-native AI agents are attracting attention as a flexible path for teams that need governed exploration without constant dashboard rebuilds. For a closer look at the self-serve model, see this overview of self-serve business intelligence. The same pressure shows up in product teams that follow the Up North Media SaaS guide, where application design and data workflows have to support ongoing decision-making rather than occasional reporting.
Key Concepts of SaaS Analytics Architecture
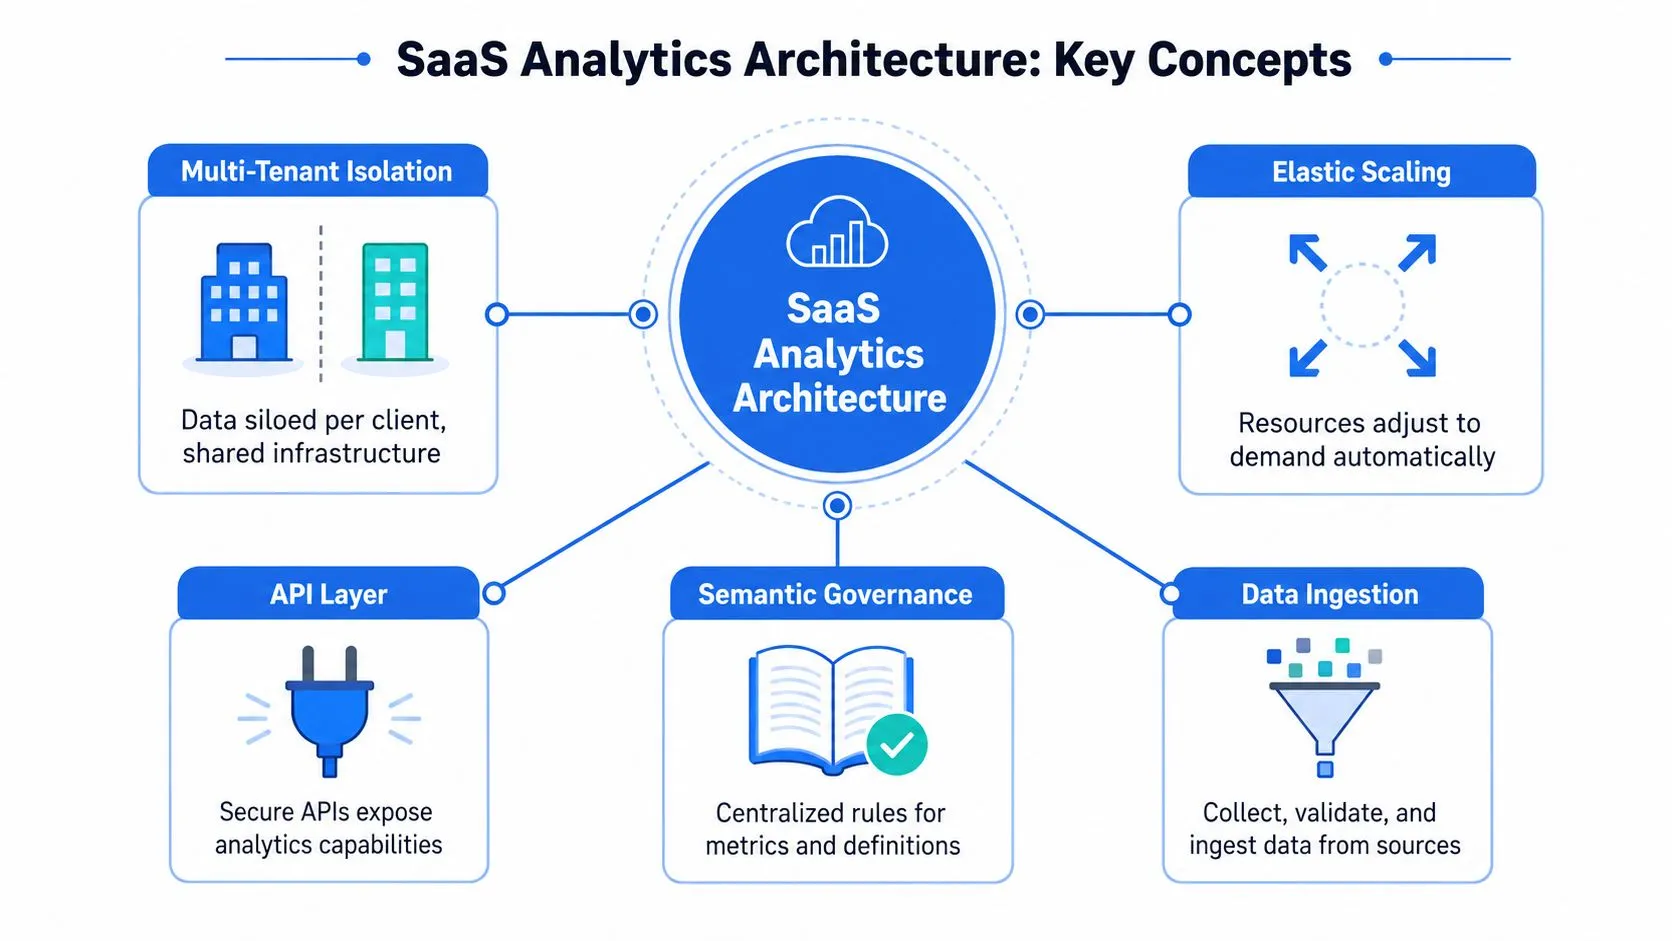
A strong SaaS analytics platform starts with architecture, not visuals. If the underlying system cannot isolate tenants, manage load, and keep definitions consistent, the cleanest dashboard still produces late or noisy answers. Those failures show up later as lower trust, slower queries, and heavier support load.
Multi-tenant isolation and elastic scaling
A SaaS analytics system works like an apartment building. Each tenant needs private space, but they still share common utilities, and one resident should not be able to break water pressure for everyone else. In analytics terms, that means multi-tenant isolation for customer data and permissions, plus elastic scaling so query workload does not collapse under heavier usage.
That requirement is not theoretical. Industry guidance on embedded analytics explicitly stresses resource isolation, high query concurrency, adaptive resource management, and intelligent caching so one tenant's activity does not slow another tenant's dashboard latency (Sisense). For teams evaluating vendors, that is the architectural test that matters most, because performance problems often appear only after adoption starts to spread.
Semantic governance and the data path underneath
The second building block is the semantic governance layer. The platform defines what revenue, churn, activation, or expansion mean, so different teams stop arguing over metric drift. A shared semantic layer keeps finance, product, and customer success from reading the same number three different ways.
The third piece is the real-time data path. Modern SaaS analytics has to move data from billing systems, product events, CRM, and support into one governed surface quickly enough that leaders still trust it. Independent guidance on built-in analytics platforms emphasizes cloud-native source compatibility, automated ETL or ELT, streaming or near-real-time ingestion, and a semantic layer to keep reports aligned as source systems change (UMA Technology).
Practical rule: if a vendor cannot explain how it prevents metric drift between source systems and dashboards, the demo is incomplete.
The implementation details matter here too, especially when teams want to extend analytics inside the product. For a deeper technical frame on data layout, Querio's warehouse architecture overview is useful context because warehouse-native design changes how much governance and duplication the analytics layer needs to carry.
Core Capabilities of Modern SaaS Analytics Platforms
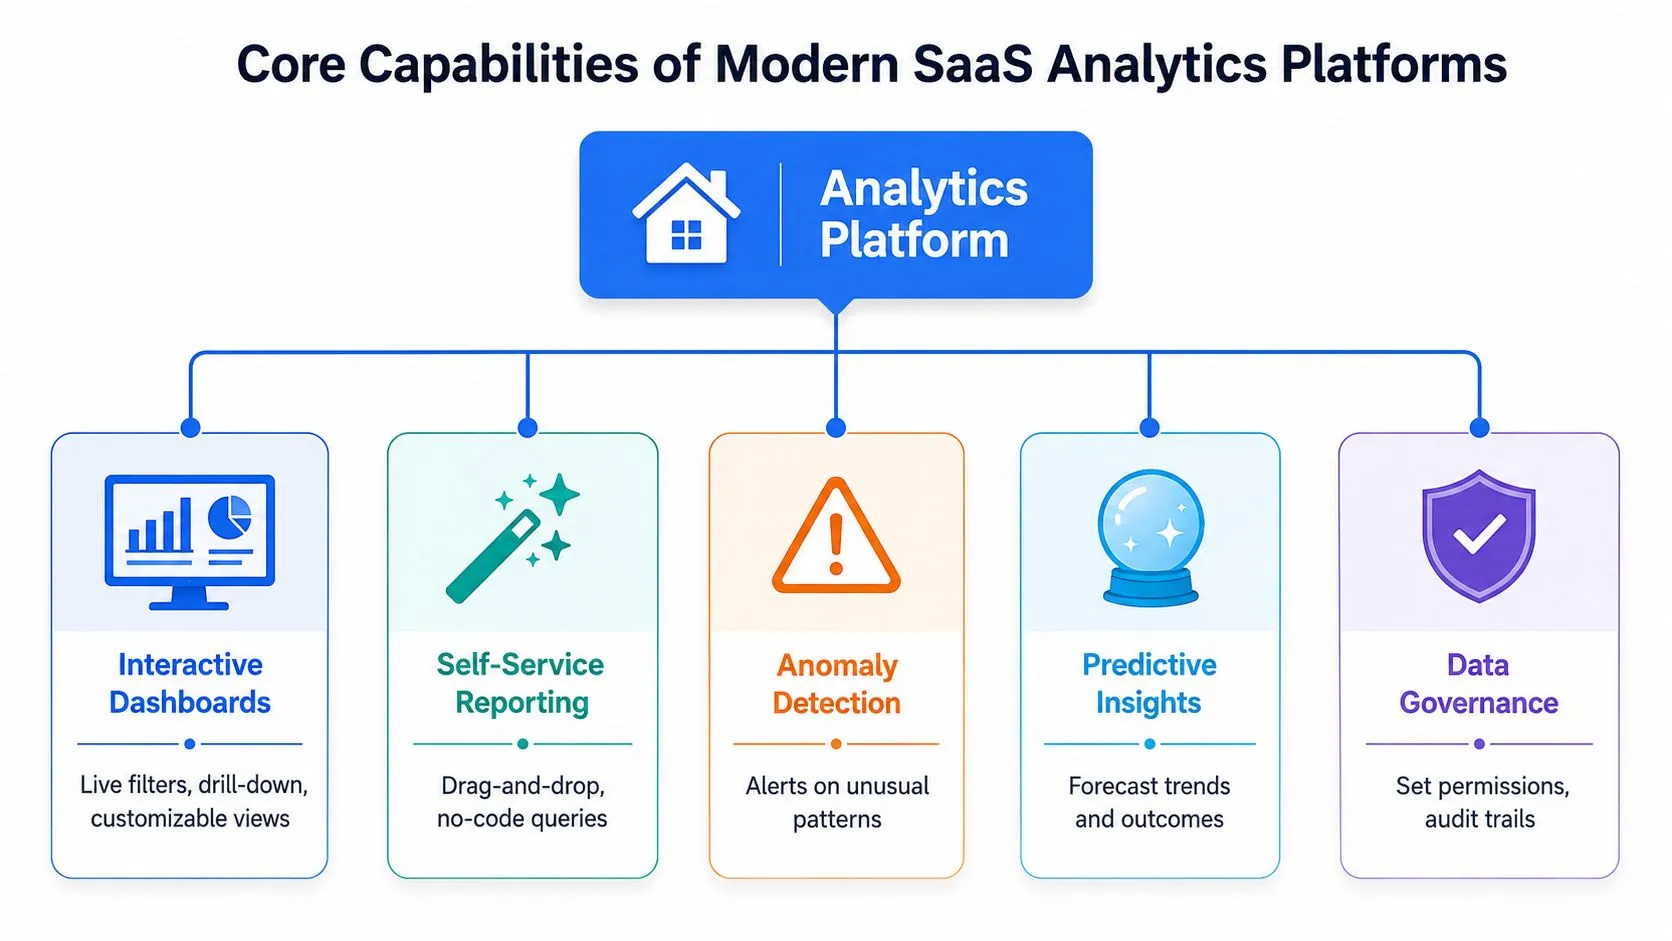
The value of a SaaS analytics platform shows up in operational flow. The right system reduces the time between a data change and a decision, while keeping governed metrics available to both analysts and business users.
The five capabilities that shape day-to-day use
The first capability is automated ELT or ETL. Billing, product, CRM, and support systems change often, so the platform has to keep pipelines current without turning routine source updates into manual rebuilds.
The second is a semantic layer. It defines shared metric logic, which keeps teams from interpreting revenue, retention, or activation in incompatible ways. Without that layer, users can produce dashboards quickly and still disagree on what the numbers mean.
The third is real-time or near-real-time ingestion. A platform that refreshes slowly forces teams to act on old signals, which is a weak fit for product telemetry, customer risk monitoring, and revenue reviews that depend on current state.
The fourth is AI-powered ad hoc exploration. Warehouse-native AI agents change the workflow by letting users ask follow-up questions directly against governed warehouse data, then refine the answer without waiting for a data team to rewrite a query or rebuild a report. That matters most when teams need fast iteration but still need controlled definitions.
The fifth is embedded analytics with secure tenant separation. SaaS products often need customer-facing dashboards as part of the application itself, so the analytics layer has to support internal reporting and tenant-specific access rules at the same time.
A strong platform ties these pieces together instead of treating them as disconnected modules. Governance, ingestion, and exploration work better when the same system controls definitions, refresh behavior, and access paths.
A practical test is simple. If a product manager can ask a follow-up question after viewing a dashboard and get a governed answer without opening a ticket, the platform is doing useful work.
For teams that want a more self-directed workflow, Querio's self-service analytics comparison is helpful context for understanding how active exploration differs from static reporting.
Business Benefits and Use Cases for SaaS Analytics
The value of analytics shows up in how quickly teams can act. Product managers use it to see which features drive adoption. Revenue teams use it to understand whether growth is coming from acquisition or expansion. Customer success teams use it to spot accounts that need intervention before renewal.
The strongest use cases usually sit where teams overlap. A churn risk score is useful, but it becomes far more valuable when customer success can connect it to product usage, billing changes, and support history in one view. That's the business case for a shared platform, it removes the delay between seeing a problem and deciding who owns the next step.
Where the platform pays off
Product analytics is the clearest starting point. Teams need funnel analysis, feature usage, and activation tracking to see whether the product is delivering value early enough to support retention. If users are adopting the wrong feature first, or skipping the core workflow entirely, the platform should make that obvious.
Revenue operations is the next layer. MRR, ARR, churn, expansion, and CAC only become useful when the team can segment them by plan, channel, or customer cohort. A good platform makes the financial picture readable without forcing the finance team to translate product behavior every time they close the books.
Customer success depends on risk visibility. Renewal planning becomes more precise when health signals, product usage, and support trends are in one place. The platform doesn't replace customer managers, but it gives them better timing and more consistent context.
Customer-facing analytics is the newer use case, and it's getting more important. SaaS companies increasingly want to expose reporting inside their own products, which means the platform needs secure, tenant-aware dashboards that don't require a separate engineering project for every customer view.
The ROI isn't just faster reporting. It's fewer meetings spent reconciling the same number across departments.
Analytical teams also benefit in ways that aren't obvious at first glance. Reusable metrics reduce rework, and governed exploration prevents the same one-off query from being rewritten in three different tools. That frees analysts to focus on higher-value questions instead of acting as a permanent reporting desk.
Evaluation Criteria for Startups and Mid-Market Companies
Startups often buy analytics for speed, then discover they have also bought a future governance problem. Mid-market companies usually begin with the opposite concern, control and consistency, yet they can still end up with a system that is too slow for day-to-day use. The right choice depends on whether the platform can support immediate exploration and long-term scale without forcing teams to choose one or the other.
A useful evaluation starts with the work users need to do. If the team's biggest pain is self-serve follow-up questions, the system has to let non-technical users explore without creating a backlog for analysts. If the main pain is customer-facing reporting, embedded analytics, access control, and cost predictability matter more than a nicer dashboard builder. Vendor-neutral buying guides often focus on feature lists, but they understate the operational burden of keeping self-serve analytics usable as usage grows. Querio's criteria guide for self-service analytics gives a practical way to separate real exploration capability from polished presentation.
The questions to ask before buying
- Warehouse-native architecture. Can the platform work directly on the warehouse, or does it copy logic into a separate layer that becomes hard to maintain?
- Real-time performance. Can it keep dashboards responsive as more users and more tenants query the same underlying data?
- Semantic governance. Who owns metric definitions, and how are changes reviewed?
- Predictable pricing. Does cost stay understandable as usage grows, or does every new dashboard add hidden overhead?
- Self-serve exploration. Can product, finance, and operations users ask new questions without analyst intervention?
- AI and ML readiness. Can the system support AI-assisted analysis without losing governed definitions?
The second issue is buyer fit. Startups usually want quick deployment, lighter process, and an interface that encourages adoption. Mid-market companies usually need stronger permissioning, clearer auditability, and a platform that still performs when usage spreads across teams. If the analytics stack is already fragmented, a better front end alone will not fix it.
Selection also has to account for operating model. A platform that works for a small product team may break down once finance, customer success, and operations all depend on the same metrics. That is where the maintenance burden shows up, because every new team adds permission rules, metric requests, and review cycles. Teams that also depend on growth execution should keep the data stack aligned with multichannel outreach for software, since analytics and outbound planning often scale together.
Checklist for Implementation and Migration
A platform rarely fails because the demo was weak. It fails because rollout was sloppy. Teams skip metric alignment, connect sources without a governance plan, and ask users to migrate old reports before the new ones are trusted.
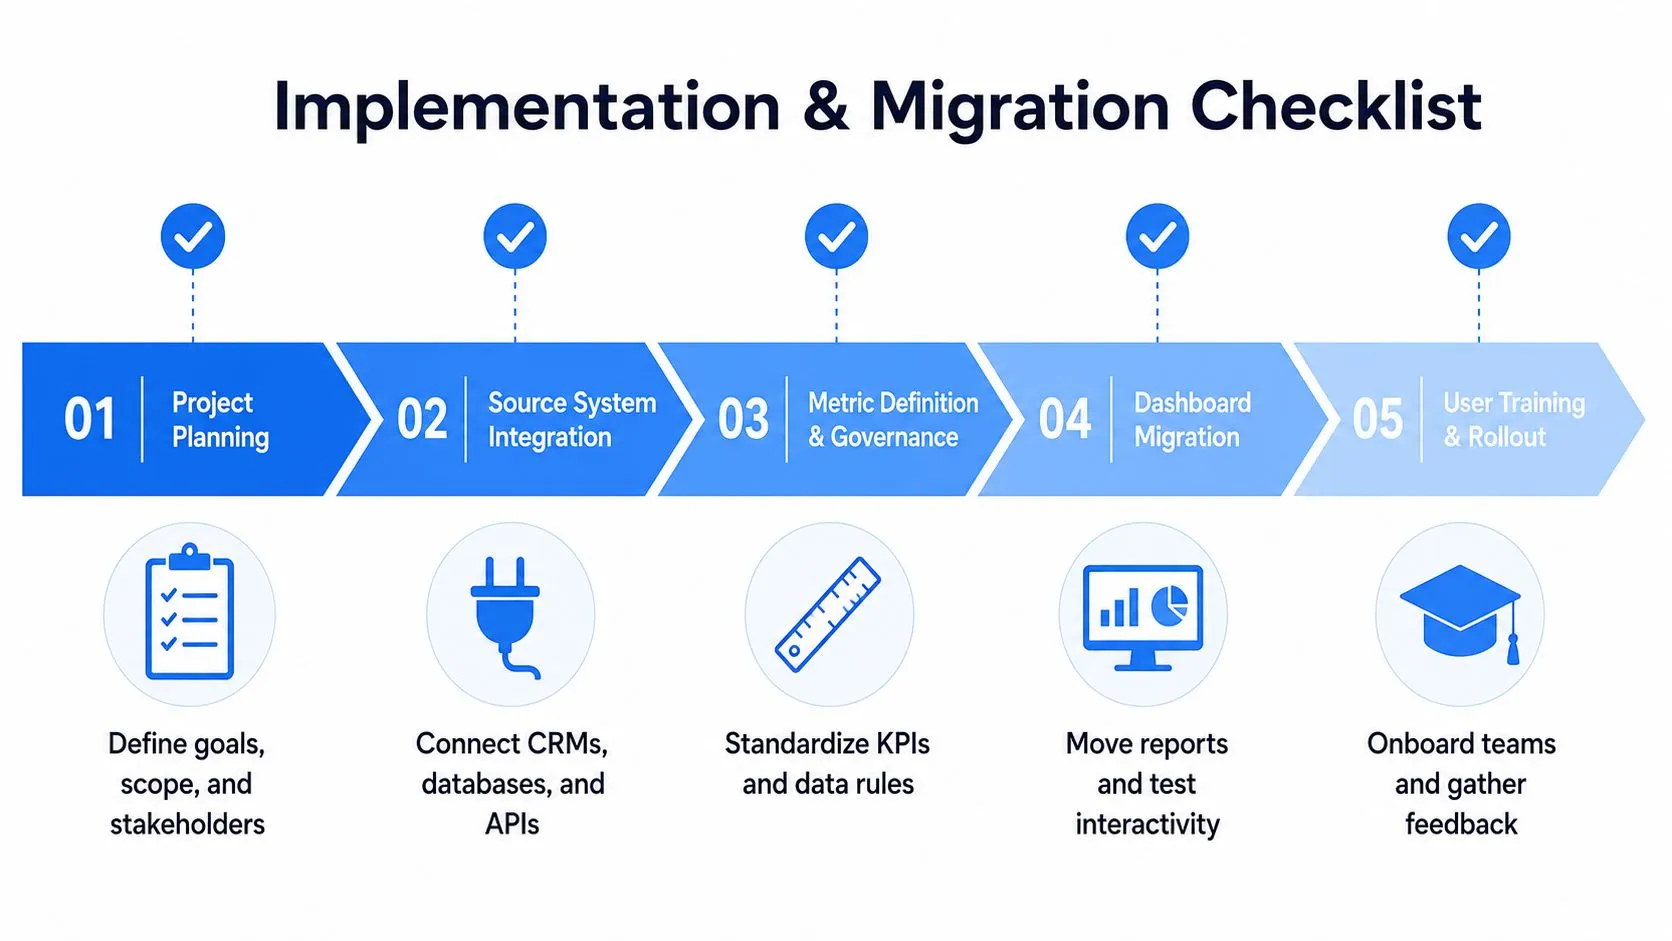
Step 1 to Step 5
- Project planning. Define the business questions first, not the charts. Product, finance, and customer success should agree on the core decisions the platform must support.
- Source system integration. Connect the warehouse, billing system, CRM, and support tools in a controlled sequence, so you can validate one path before adding the next.
- Metric definition and governance. Create a metric registry in the warehouse, then lock down who can change definitions and how those changes get approved.
- Dashboard migration. Move the most-used reports first, then test drill-downs, filters, and permissions before cutting over the old views.
- User training and rollout. Run a pilot with product managers and operators, collect feedback, and fix the confusing parts before full adoption.
A migration works when users trust the numbers before they care about the interface.
The key mistake is trying to convert every report at once. That creates too much noise and turns the new platform into a support queue. It's better to choose a narrow slice of the business, prove the workflow, then expand once the semantic model and permissions are stable.
Teams also need an explicit ownership model. The data team should maintain the governed definitions, but business users need enough autonomy to explore and act. If no one owns the metric layer, the platform becomes another place where definitions drift and trust slowly erodes.
Comparing Querio with Hex Looker and ThoughtSpot
BI evaluations often stop at charting and dashboard polish, but the harder question is operational: how much reusable analytics infrastructure does each tool create, and how much analyst time does it consume after rollout? Many platforms still optimize for reports and cohort views, while the test is whether the system can answer the next question without forcing a new build.
That operational burden is where warehouse-native AI agents change the buying decision. Querio runs on the warehouse and uses a file-system style workflow with Python notebooks, which is intended to reduce the distance between exploration and governed analysis. Hex places more of the work inside notebooks, Looker relies on a proprietary semantic layer, and ThoughtSpot focuses on search-driven analytics. For a broader product-by-product comparison, Querio's side-by-side analysis of ThoughtSpot, Hex, and Querio lays out the trade-offs in more detail.
| Feature | Querio | Hex | Looker | ThoughtSpot |
|---|---|---|---|---|
| Warehouse-native AI agents | Yes | No | No | No |
| Notebook-style workflow | Yes | Yes | Limited | Limited |
| Semantic layer approach | Warehouse-native governance | Notebook-centric | Proprietary semantic layer | Search and model centric |
| Self-serve exploration for mixed users | Designed for both technical and non-technical users | Strong for analysts and technical teams | Strong for governed reporting | Strong for search-led discovery |
| Reusable analytics infrastructure | Core focus | Moderate | Strong governance, but more model overhead | Focused on discovery and search |
| Embedded analytics fit | Supported | Supported in some workflows | Supported | Supported |
| Total ownership burden | Lower when warehouse logic is reused | Moderate | Can rise with model maintenance | Varies with deployment and governance needs |
A practical reason this matters is team bandwidth. If the data team is already overloaded, the deciding factor is not whether the platform can produce one more dashboard. It is whether the system can keep serving new questions without turning analysts into a human API.
The comparison also changes once governance and partner economics enter the picture. Looker's model-heavy approach can fit organizations that already have strong data modeling discipline, while Hex may suit teams that want notebook-first analysis. ThoughtSpot tends to work well when search-led discovery is the priority. The right choice depends on whether your organization wants to centralize logic in a semantic layer, keep analysis close to notebooks, or use warehouse-native workflows that reduce duplicated maintenance. In SaaS teams that also rely on partner programs, the same ownership question shows up in a different form, which is why a revenue share with marketing agency structure should be evaluated with the same attention to incentives and ongoing upkeep.
Conclusion and Next Steps
A strong SaaS analytics platform is less about prettier dashboards and more about operating discipline. The architecture has to isolate tenants, scale cleanly, and keep metrics governed. The workflow has to support real-time data, self-serve exploration, and customer-facing use cases without making analysts the default answer to every question.
The fastest next move is a focused proof of concept. Pick one metric registry, one product funnel, and one revenue view, then test whether the platform can answer follow-up questions without rework. If it can, you've found a foundation that can scale with the business. If it can't, you've just confirmed that the problem is infrastructure, not reporting.
Querio is built for teams that want to run analysis directly on the warehouse while giving both technical and non-technical users a shared way to explore data. If that matches the kind of analytics stack you're trying to build, visit Querio and test it against your current reporting workflow.