Guide
Data Warehouse vs Business Intelligence: A Practical
Data warehouse vs business intelligence explained with clear decision criteria, architecture comparisons, and real use cases for mid-market data teams.
Your CEO wants a board-ready revenue chart before lunch. The analyst pulls orders from the data warehouse, joins them to subscription records, defines the metric, and builds a dashboard in a BI tool. By noon, both systems have done their jobs. Yet someone still asks, “Which one is the answer?”
That question creates expensive confusion for startup leaders. A warehouse and a business intelligence platform aren't competing versions of the same product. One stores and shapes trustworthy data. The other helps people explore and act on it. The practical data warehouse vs business intelligence decision is therefore about layers, ownership, and sequencing, not choosing a winner.
| Question | Data warehouse | Business intelligence |
|---|---|---|
| Primary job | Store, integrate, and model data | Present and analyze governed data |
| Main users | Data engineers, analytics engineers, analysts | Executives, operators, analysts, managers |
| Typical output | Curated tables, models, metrics | Dashboards, reports, ad-hoc analysis |
| Main risk | Broken pipelines, duplicated models, uncontrolled compute | Dashboard sprawl, inconsistent definitions, low adoption |
| Founder's test | Can we trust and reuse the data? | Can the business answer questions without SQL? |
Table of Contents
- Why Founders Confuse the Warehouse with BI
- What Each Layer Actually Does
- Architecture and Roles Compared Side by Side
- Real Use Cases That Expose the Gap
- Performance Metrics That Matter in Practice
- Decision Framework for Mid-Market Startups
- Choosing, Combining, or Bridging the Two
Why Founders Confuse the Warehouse with BI
A founder asks for one metric, then receives three answers. The analyst blames the source system, finance blames the dashboard, and a vendor proposes another platform. That cycle often starts with a bad premise: the warehouse and BI tool are treated as alternative purchases.
The confusion comes partly from how vendors sell. Snowflake may be presented as a modern analytics destination, while Looker may be presented as the place where metrics become useful. Neither description is wrong, but neither product replaces the other. Snowflake doesn't replace Looker, and a BI license doesn't automatically centralize operational data, resolve duplicate records, or create reliable metric definitions.
A warehouse answers where data lives and how it gets shaped. It brings together information from systems such as Stripe, Salesforce, product databases, and support platforms. Data engineers and analytics engineers then transform that information into reusable models. IBM researchers Barry Devlin and Paul Murphy are credited with developing the term “business data warehouse” in 1988, during the period when data warehouses became a core BI architecture for centralized analytical reporting, as described in this history of business intelligence and data warehousing.
BI answers a different question: how do non-technical people read and use the data? It provides dashboards, filters, reports, alerts, and exploratory interfaces. A finance leader doesn't want to inspect transformation code before a forecast meeting. They want to see the approved revenue metric, understand its movement, and investigate the relevant segment.
Practical rule: If a vendor says its product “does BI” or “replaces the warehouse,” ask which layer owns ingestion, modeling, metric definitions, access controls, and business consumption.
The distinction matters because duplicate tools create duplicate logic. A dashboard may calculate active customers one way, a spreadsheet another way, and a SQL query a third way. Founders should first understand the role of business intelligence analytics, then decide where governed logic belongs.
The rest of the stack becomes easier to evaluate once you stop asking which category wins. The useful question is: which layer is currently preventing the company from making a revenue or operating decision?
What Each Layer Actually Does
Start with the warehouse. It receives data from operational systems, stores it in a query-optimized environment, and turns inconsistent source records into structured analytical models. The raw events might include an order, a user login, a subscription change, and a cancellation. The modeled output could be a clean customer-level table with consistent dates, plan categories, revenue treatment, and account status.
A warehouse table joining orders, users, and subscriptions is warehouse output. The value isn't its interface. The value is that multiple teams can query the same shaped data without rebuilding the joins every time.
Business intelligence begins after that foundation exists. A BI tool connects to curated warehouse tables or approved semantic models, then gives business users ways to explore them. A Looker dashboard showing weekly retention is BI output. So is a Metabase report for unpaid invoices or a Mode analysis investigating a change in activation.
The warehouse owns structure
Warehouse work is mostly about reliability and reuse:
- Ingestion: Moving source data into a central analytical environment.
- Transformation: Converting raw records into fact tables, dimensions, and reusable models.
- Quality control: Checking freshness, completeness, uniqueness, and relationship integrity.
- Governance: Managing permissions, lineage, naming, and approved definitions.
- Performance: Organizing queries and workloads so repeated analysis remains usable.
A warehouse doesn't decide whether a sales manager needs a weekly pipeline dashboard. It makes the underlying opportunity, account, stage, and close-date data available in a consistent form.
BI owns consumption
BI work focuses on interpretation and action:
- Dashboards: Monitoring revenue, retention, activation, inventory, or support operations.
- Reports: Delivering recurring views to executives and functional teams.
- Exploration: Letting users filter, drill down, and ask follow-up questions.
- Communication: Turning data into a view that supports a meeting or decision.
- Self-service: Reducing routine requests sent to analysts.
A BI tool can expose a metric beautifully, but it can't rescue a badly modeled source. If every dashboard author has to decide which subscription table to use, how to treat refunds, or whether a deleted user remains active, the BI layer is carrying warehouse responsibilities it shouldn't own.
| Responsibility | Data warehouse | Business intelligence |
|---|---|---|
| Store source data | Central responsibility | Usually consumes connected data |
| Shape analytical models | Core responsibility | May apply limited calculations |
| Define governed metrics | Owns the underlying logic | Exposes approved definitions |
| Deliver dashboards | Not its main function | Core responsibility |
| Support ad-hoc questions | SQL and model access | Visual and conversational exploration |
| Produce decisions | Indirectly | Directly through business-facing analysis |
This is why a modern enterprise data warehouse should be treated as infrastructure, while BI should be treated as the consumption surface. The pipeline isn't a marketplace where one product displaces the other. It's a chain. If the upstream model is weak, the downstream experience becomes fragile. If the downstream experience is missing, useful SQL remains trapped with the data team.
Architecture and Roles Compared Side by Side
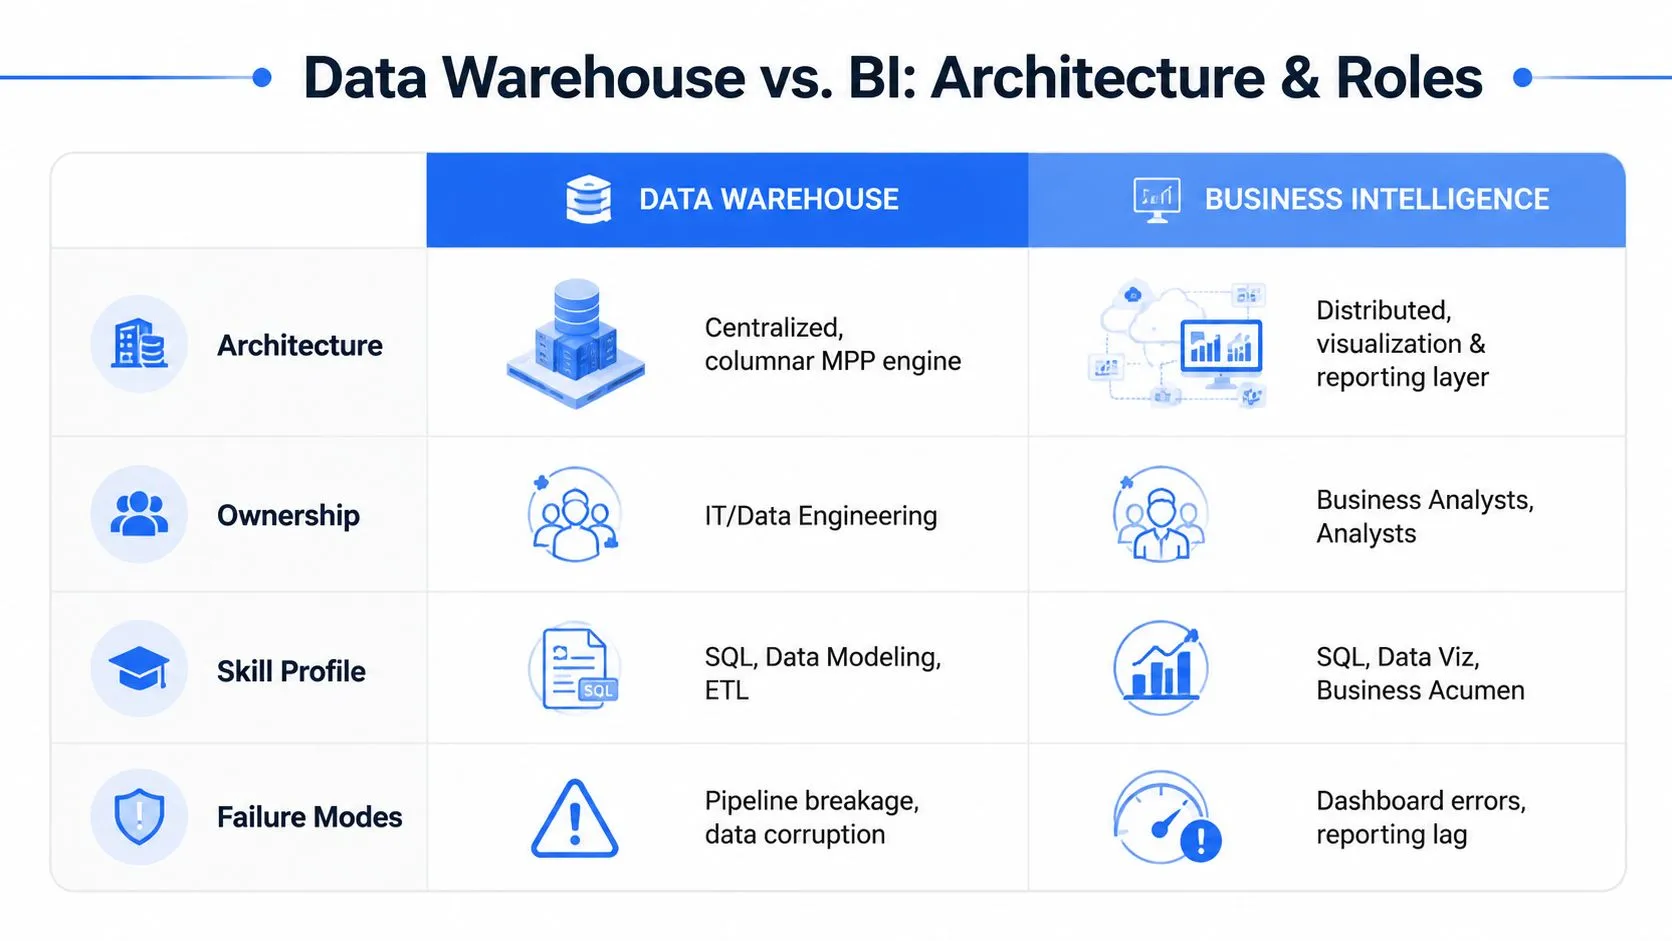
At a mid-market company, the architecture usually runs from source systems through ingestion, warehouse storage, modeled tables, a semantic layer, and BI consumption. Each layer has a different owner and a different failure pattern.
| Criterion | Data warehouse | Business intelligence |
|---|---|---|
| Architecture | Centralized analytical store, often a columnar MPP engine | Visualization, reporting, and exploration layer |
| Ingestion pattern | ELT commonly lands data first, then transforms it | Live queries or extracts consume modeled data |
| Ownership | Data engineering and analytics engineering | Analysts, business owners, and BI administrators |
| Skill profile | SQL, data modeling, pipelines, testing, cost control | SQL, visualization, metric interpretation, stakeholder judgment |
| Typical failure | Pipeline breakage, duplicated models, stale data, cost overruns | Dashboard errors, reporting lag, metric inconsistency |
| Main trade-off | Foundation takes effort but compounds in value | Fast visibility can expose unresolved modeling debt |
What this looks like with a small data team
A company with roughly fifty employees doesn't need a large specialist department to make these layers work. It usually needs one data engineer who owns ingestion and warehouse reliability, plus one analytics engineer or strong analyst who owns models, metric definitions, and business-facing delivery.
The data engineer connects source systems, monitors loads, handles schema changes, and keeps warehouse usage under control. The analytics engineer turns those landed records into models such as orders, customers, subscriptions, pipeline, and support activity. Business owners validate what the metrics mean. A BI tool then makes the approved views accessible.
Columnar MPP warehouses are built for analytical scans across large structured datasets. BI visualization engines solve a different problem, making those results navigable for people who don't write SQL. Some BI products query live warehouse data, while others rely on extracts or cached results. That choice affects freshness, concurrency, and cost, but it doesn't remove the need for a clear upstream model.
BI without a modeled warehouse is a thin user interface over unresolved source data. A warehouse without BI leaves useful analysis trapped in SQL.
Founders should compare three practical costs. Build cost covers pipelines, models, permissions, and tests. Time to first dashboard may favor a BI-first approach, especially when one report matters immediately. Maintenance burden usually appears later, when source schemas change, dashboards multiply, and several teams publish competing definitions.
Warehouse sprawl produces duplicated tables, unclear ownership, and runaway queries. BI rot produces dashboards nobody trusts, stale filters, screenshots in executive decks, and a growing collection of one-off reports. The right architecture doesn't eliminate maintenance. It puts maintenance in the layer best equipped to handle it.
Real Use Cases That Expose the Gap
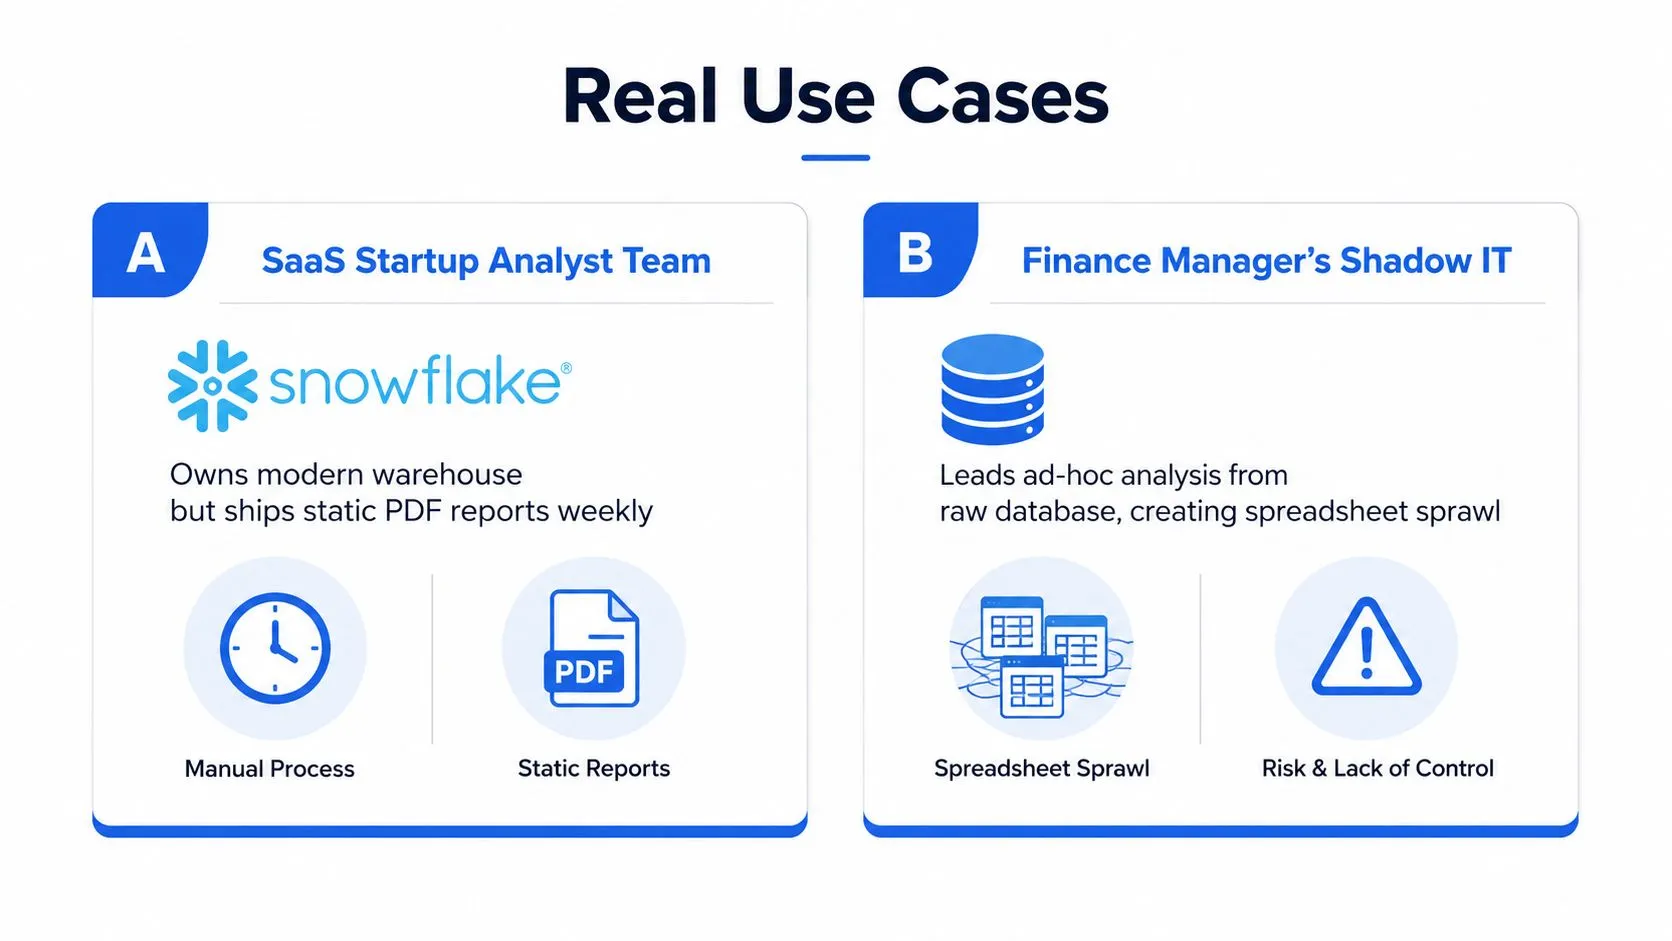
Consider a Series B SaaS company with a modern Snowflake warehouse. The analyst team has centralized product events, billing records, and CRM data, but executives still receive static board screenshots every week. The warehouse isn't necessarily the bottleneck. The company has a BI delivery problem.
The failure points are visible. Analysts may have built useful SQL but never selected a consistent dashboard surface. Metric definitions may live in notebooks or personal queries. Board reporting remains manual because nobody owns the final presentation layer. Query latency may also be acceptable for an analyst but frustrating for an executive who needs a responsive view during a meeting.
Now consider a direct-to-consumer brand that invested heavily in Looker and Tableau. Leaders can open dashboards for revenue, acquisition, inventory, and customer cohorts, but an analyst can't answer a new SQL question confidently. The underlying warehouse contains duplicated source tables, inconsistent customer identifiers, and unclear treatment of returns.
That company has a warehouse and modeling problem. More dashboards won't solve it. Each new visualization adds another interpretation of unreliable inputs, and business users learn to export data into spreadsheets because the official views don't answer the question in front of them.
The diagnostic is straightforward:
- Can analysts answer a new question by reusing trusted models, or do they start from raw source tables?
- Can business users investigate a metric without requesting a screenshot or exporting a spreadsheet?
- When two teams report different results, is the disagreement in the data model or in the dashboard logic?
A warehouse bottleneck shows up as missing, stale, duplicated, or poorly modeled data. A BI bottleneck shows up as inaccessible, confusing, slow, or unused analysis. The distinction prevents you from buying a presentation tool to fix a foundation problem, or rebuilding infrastructure when the company needs a usable interface.
For a closer look at the reporting layer, compare the data warehouse reporting workflow.
Performance Metrics That Matter in Practice
A dashboard can load quickly and still mislead a pricing meeting if its data is stale. A warehouse can contain fresh data and still drive users back to spreadsheets if queries take too long. Measure the complete path, from source update through analysis to business action.
Track the two layers separately, then connect them. Warehouse metrics include query response time, load time, storage usage, freshness, concurrency, and cost per query. BI metrics include adoption, engagement, time to insight, and decision quality. End-to-end ETL or ELT runtime, pipeline latency, high-percentile query latency, and uptime show whether the layers work together, as outlined in this practical data warehouse efficiency metrics guide.
| Metric | Warehouse threshold | BI threshold | Decision it affects |
|---|---|---|---|
| Freshness | Data arrives within the operating rhythm of the decision | Users see the current approved result | Whether leaders trust the morning or meeting-time view |
| Query latency | The warehouse handles repeated analytical queries predictably | Interactive analysis generally targets average latency under 3 seconds | Whether users investigate or abandon the dashboard |
| Pipeline latency | ELT completes before dependent models run | Dashboards refresh after trusted models are available | Whether board and operating reports use current inputs |
| Concurrency | Shared workloads remain stable as analysts and BI users query together | Multiple users can open and filter the same report | Whether a company-wide dashboard remains usable |
| Cost per query | Compute stays aligned with useful workloads | Refresh schedules don't generate wasteful warehouse activity | Whether self-service scales without an unpleasant bill |
| Uptime | Source-to-model delivery remains dependable | Reports are available when teams need them | Whether recurring operating decisions proceed without manual work |
Set targets around decisions, not vanity dashboards. A three-second interactive target matters when a manager is exploring a live question and may otherwise export the data. It matters less for an overnight transformation that finishes before the workday begins.
Freshness also depends on the decision cycle. A four-hour delay may be acceptable for a monthly planning report, but it can disrupt a sales standup or conceal a billing problem. Watch cost per query when BI tools refresh many tiles independently. Repeated expensive joins often signal that the warehouse needs a prepared model, not more compute.
Use benchmarks to compare workload shape and engine behavior, not to promise a vendor result in your own environment. ClickBench tests 43 analytical queries on a 100GB web-analytics dataset, TPC-DS uses 99 complex SQL queries for a retail warehouse, and TPC-H uses 22 ad hoc supply-chain queries, as listed in the OLAP benchmark research. Your acceptance tests should replay representative queries, concurrent users, refresh schedules, and the business decisions the system must support.
Decision Framework for Mid-Market Startups
Founders should make the investment decision across three axes: team capacity, data maturity, and use-case mix. The loudest vendor pitch usually ignores at least one of them.
Team capacity
A solo analyst needs a dependable way to answer recurring business questions without spending every week building infrastructure. Buy a focused BI surface, keep the source scope narrow, and avoid creating a warehouse program the team can't maintain. A dedicated data team can justify a warehouse foundation because reusable models and governance will reduce repeated work across functions.
Data maturity
If the company only needs a handful of recurring reports, BI can deliver value quickly. If teams are asking exploratory questions across product, revenue, marketing, and customer behavior, build the warehouse foundation earlier. Exploratory work exposes inconsistent identifiers and definitions, so postponing modeling merely moves the cost into every future analysis.
Use-case mix
Operational dashboards favor fast, simple consumption. Strategic analysis needs flexible models and governed definitions. Embedded customer reporting adds access-control and product-integration requirements that a basic internal dashboard may not handle well.
| Situation | Buy first | Build next | Skip for now |
|---|---|---|---|
| Solo analyst, recurring reporting | BI surface and source connectors | A small set of approved metrics | Broad warehouse infrastructure |
| Small dedicated data team, cross-functional analysis | Cloud warehouse and ingestion | Reusable models and semantic definitions | Large dashboard catalog |
| Operational dashboards | BI delivery and refresh monitoring | Stable operational models | Complex exploratory features |
| Strategic analysis | Warehouse foundation | Metric governance and analyst workflows | Decorative dashboard variants |
| Customer-facing reporting | Governed warehouse models | Product permissions and serving patterns | Uncontrolled ad-hoc access |
A bridge can make sense when a team needs governed warehouse-grade SQL and faster exploration but isn't ready to operate a large pipeline. Querio's file-system approach connects users to warehouse data through encrypted, read-only access and supports plain-English questions that produce inspectable SQL and Python. Treat it as a bridge option, not a reason to skip governance.
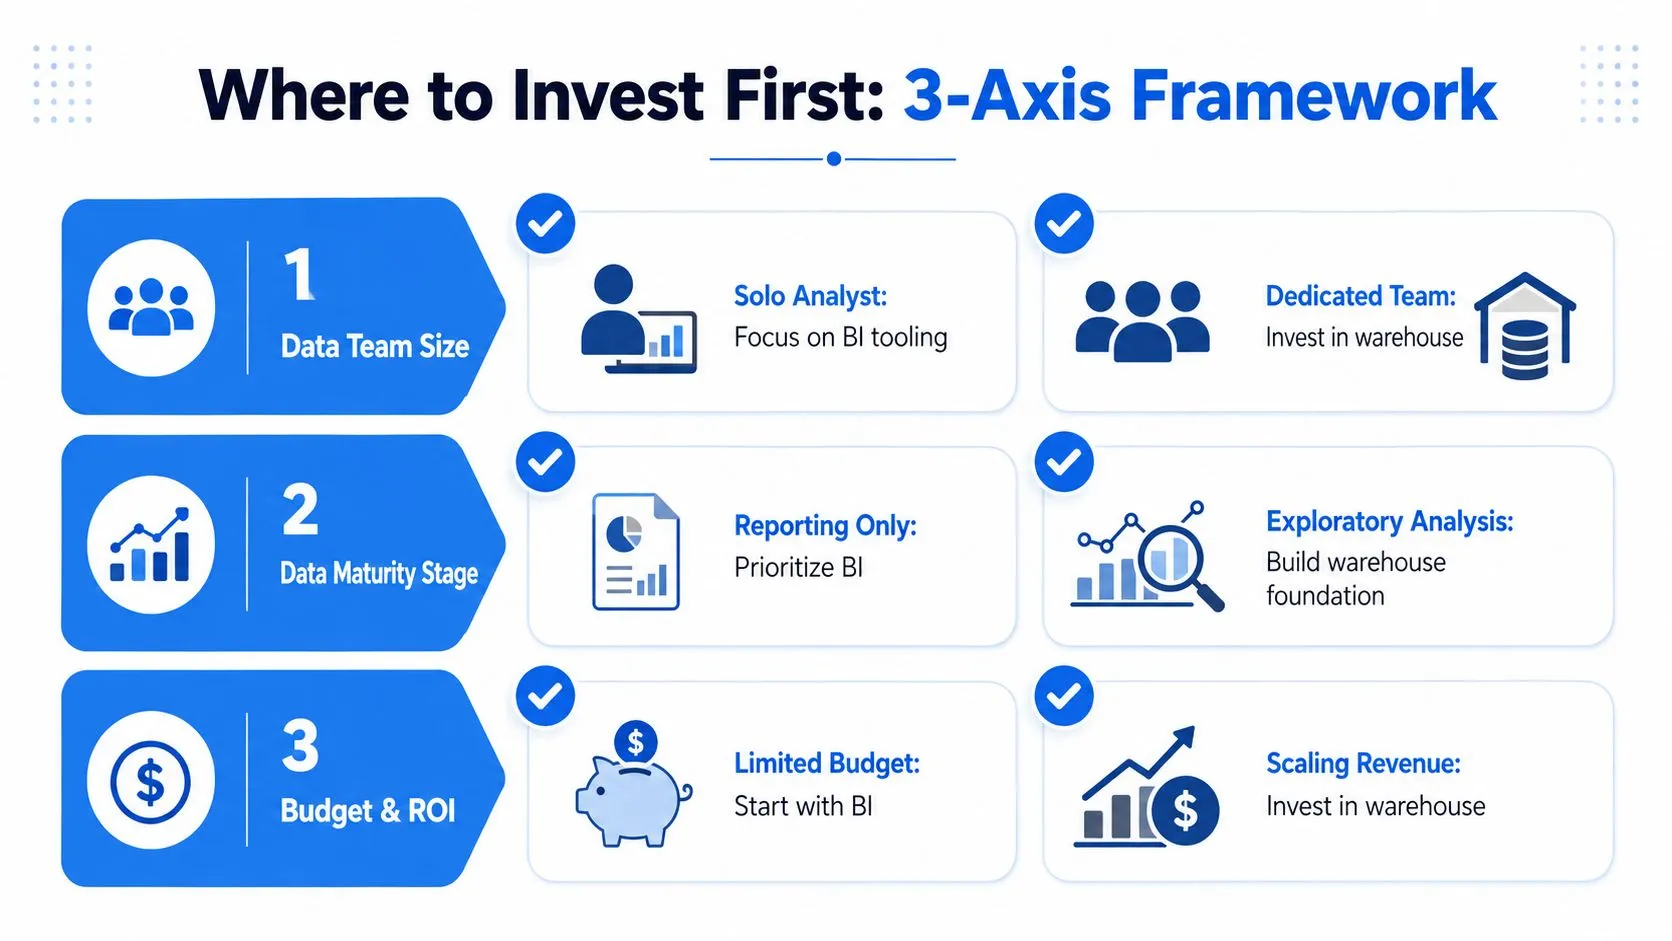
The recommendation is simple: prioritize the layer whose failure blocks a revenue decision. If leaders can't trust the number, fix the warehouse and definitions. If the number is trustworthy but inaccessible, fix BI. If both work separately but users can't move from governed metrics to flexible investigation, consider a bridge.
Choosing, Combining, or Bridging the Two
For most mid-market startups, the right answer is to combine the layers in sequence rather than buy everything at once. Build enough foundation to support the revenue questions in front of you, then add the consumption experience that turns that foundation into routine decisions.
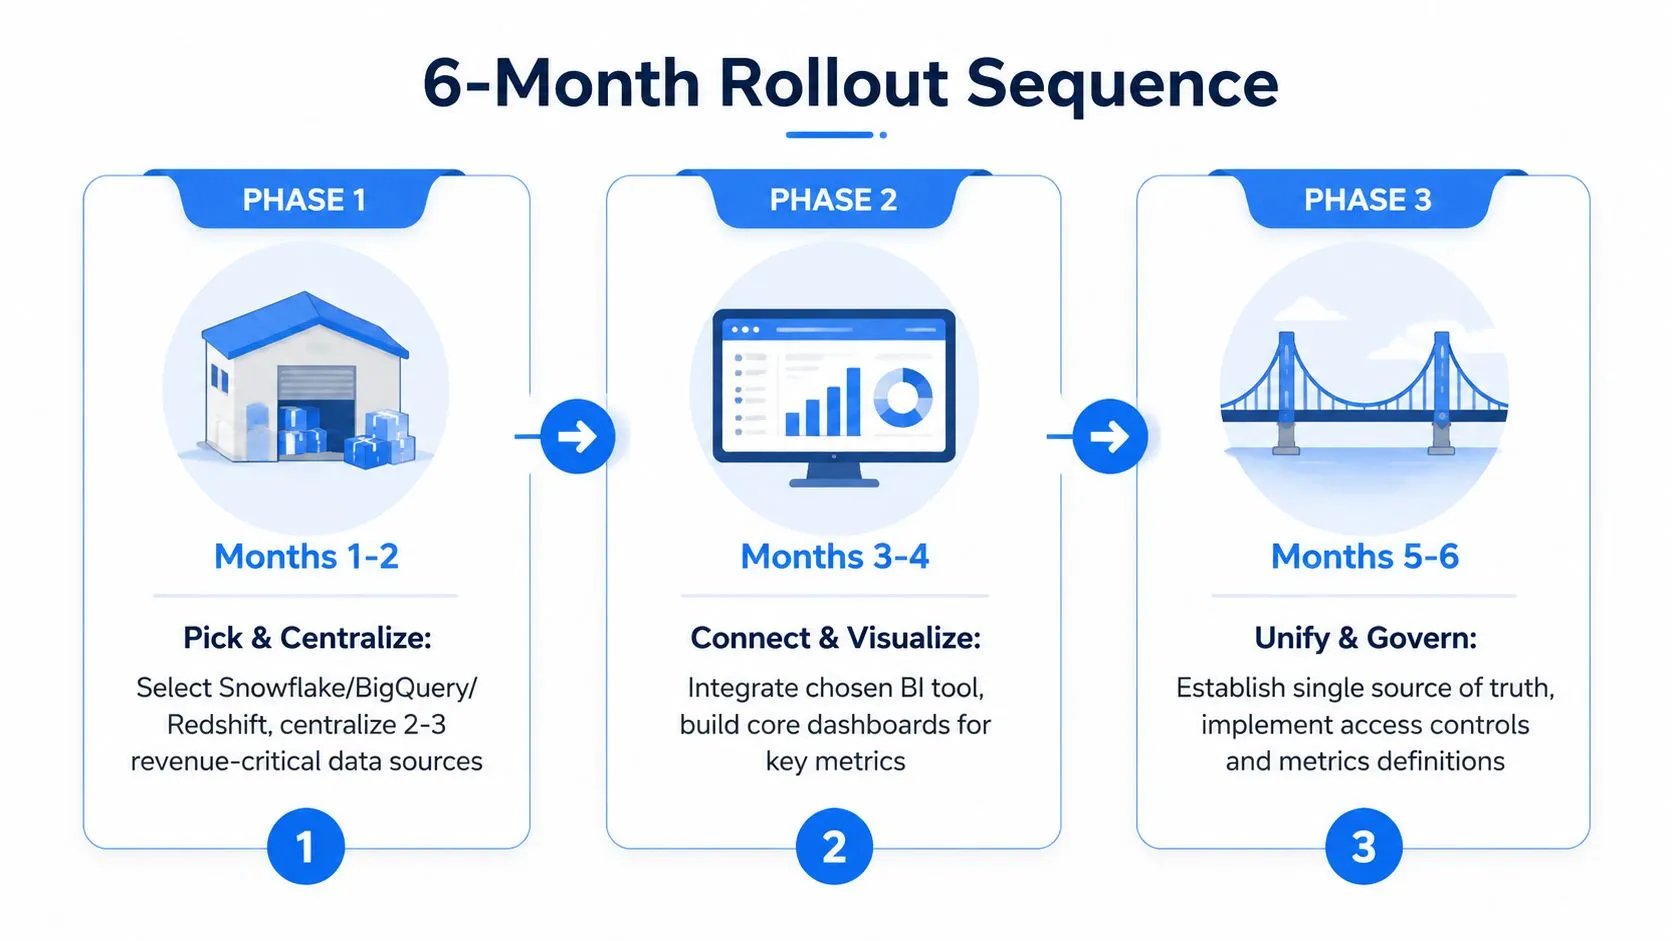
Months one and two
Choose a cloud warehouse such as Snowflake, BigQuery, or Redshift. Centralize the revenue-critical sources first, such as billing, CRM, and product activity. Don't begin with every application or historical dataset. Define ownership, document source freshness, and create a small number of trusted models.
Months three and four
Add one BI surface, not a collection of tools. Looker, Mode, or Metabase can all serve different operating models, but the team should establish one default location for core metrics. Build dashboards for revenue, pipeline, retention, activation, or the operational measures leaders already discuss.
This is also the point to establish a semantic model. A semantic layer gives metrics consistent names, dimensions, filters, and business meaning across dashboards and exploratory work. The case for a semantic layer in AI analytics becomes stronger as more users ask questions in natural language or expect automated analysis.
Months five and six
Close the loop with reverse ETL or operational analytics. Send approved insights back into systems where teams work, such as CRM, customer success, or internal workflows. Add access controls, ownership reviews, and metric change procedures before dashboard sprawl becomes normal.
Defer petabyte-scale optimization, multi-cloud replication, and custom ML feature stores unless a current product or revenue decision requires them. Those projects create impressive architecture diagrams but rarely solve the first self-service reporting problem.
Use a practical decision rule. Build the warehouse when reporting latency exceeds the operating rhythm of the decision. Layer BI when trusted data exists but users still depend on analysts or screenshots. Bridge the two when neither layer alone lets executives move from a governed metric to a useful follow-up answer.
Coverage of modern BI increasingly points toward faster ad-hoc exploration, warehouse modernization, and a closer relationship between the warehouse and the analytics experience, as discussed in this business intelligence and data warehousing overview. Emerging coverage of 2026 trends also frames real-time expectations and AI-driven analysis as forces changing the traditional boundary between warehouse execution and BI consumption, according to TechTarget's future of business intelligence analysis. The architecture should therefore leave room for lower-latency workflows without confusing conversational analysis with data governance.
A warehouse is the foundation. BI is the working surface. Your budget should follow the layer that currently prevents the company from making a confident decision.
Querio connects to warehouse data with encrypted, read-only access and lets technical and non-technical users explore live data through inspectable SQL and Python, while its semantic capabilities help keep metrics governed. Visit Querio to evaluate whether its file-system approach can close the gap between your warehouse foundation and BI workflow.