Business Intelligence
What Is Self-Service Analytics? Benefits, Risks & Governance
Self-service analytics only succeeds when companies enforce a single metric layer, role-based controls, and inspectable logic.
Self-service analytics lets business teams answer routine data questions on their own - but it only works if the rules are set first. As of 2026, 62% of companies have rolled it out, yet only 16% say their path from data to insight is efficient. That gap comes down to one thing: governance.
Here’s the short version:
What it is: Business users work from live warehouse data without waiting on analysts for every report.
Why teams want it: It cuts report delays, removes queue backlog, and gives analysts more time for higher-skill work.
What goes wrong: Metric drift, duplicate dashboards, weak data reads, stale data, permission mistakes, and warehouse cost spikes.
What fixes it: A shared metric layer, certified datasets, role-based access, audit logs, and visible SQL or Python behind each answer.
What to do first: Define your first 5–10 certified metrics, clean up data models, and lock access rules before rollout.
Put simply: access without control leads to confusion. Sales, Finance, and Customer Success may all move faster, but if each team sees a different version of MRR, churn, or ARR, the system fails.
I’d sum up the article like this: self-service analytics is not just a BI feature. It’s a working model for how a company shares data. And if you want it to work, you need one source of metric logic, tight permissions, and answers that people can inspect.
Does self-service analytics relate to data governance? | Amazon Web Services
What Self-Service Analytics Actually Is
Self-service analytics gives business users a way to answer routine questions from governed warehouse data without waiting on analysts. But here's the catch: it only works when definitions, permissions, and metric logic stay in one central place.
In practice, a user opens a certified dataset, applies filters, drills down, and gets an answer in a dashboard or notebook. The definition of the metric does not change. ARR and Active Users stay the same across tools because the semantic layer applies one definition everywhere.
That setup only holds up when the metric layer and access controls keep everyone working from the same logic.
How Self-Service Differs from Analyst-Led Reporting
The big difference is not who looks at the dashboard. It’s who owns the definitions behind it.
In a centralized reporting model, every new question turns into a ticket. A business user sends a request, an analyst writes the SQL, and the report shows up days or even weeks later. [3] That means analysts often spend their time writing the same kinds of SQL queries again and again instead of focusing on modeling and deeper analysis.
Governed self-service analytics changes that split of work. Analysts spend less time building reports and more time on modeling, metric design, and governance. [1][2]
The Core Stack Behind Reliable Self-Service
Reliable self-service depends on a stack that keeps data, models, metrics, and access in one governed setup.
Layer | Component | Purpose |
|---|---|---|
Storage | Data storage | |
Modeling | Builds reusable models | |
Semantic | Metric layer (e.g., LookML, dbt Semantic Layer) | Defines business logic once and applies it across tools |
Security | RBAC, Row-Level Security, Audit Trails | Controls who sees what and tracks usage |
Interface | BI tool, notebooks, conversational AI | User interface |
What Good Self-Service Tooling Should Do
Good tooling should give users a starting point. Pre-built, role-based dashboards for common questions, like weekly pipeline reviews, do exactly that. Users can get answers without having to build everything from scratch. [2]
A few things are non-negotiable:
Searchable catalogs
Certified metrics
Role-based permissions
The biggest test, though, is inspectable SQL or Python. If an AI assistant or automated query gives an answer, the data team needs to see how that answer was produced. The SQL or Python behind the result should be visible so analysts can check the logic.
That inspectable logic is what makes governance possible later in the stack.
The Business Benefits of Governed Self-Service Analytics
Centralized Reporting vs. Governed Self-Service Analytics
Once metric definitions live in one place, the business value gets pretty straightforward: more speed, more scale, and less analyst burnout. Governed self-service analytics helps teams answer routine questions fast without letting metrics drift over time. Business users get data they can trust, and Finance, RevOps, and other teams stay on the same page.
Faster Decisions and Fewer Reporting Bottlenecks
In a lot of companies, a basic request like "Can you break down churn by customer segment for last quarter?" can sit in an analyst queue for 1 to 4 weeks [8]. By the time the answer shows up, the team may already be making calls based on stale data or plain guesswork.
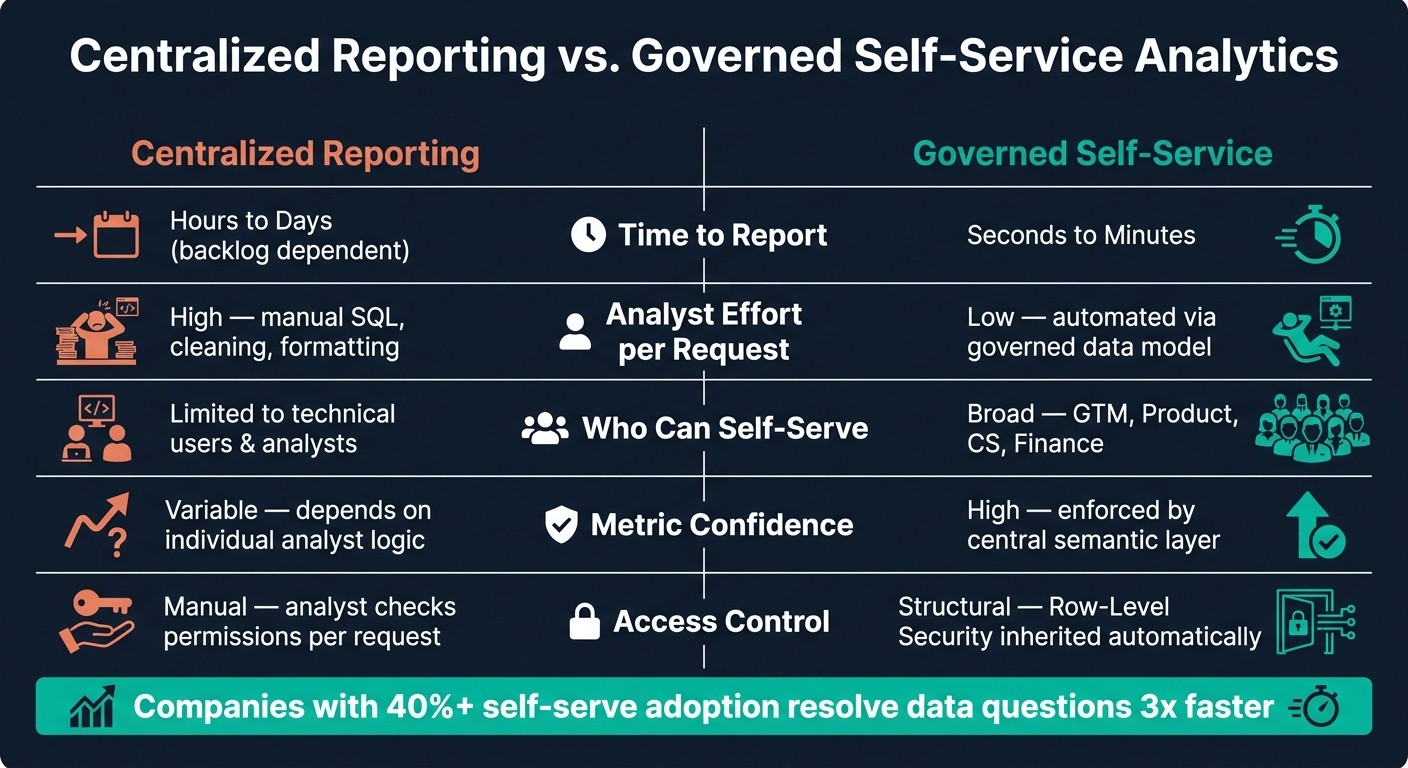
With governed self-service, that changes fast. A Customer Success manager can filter a certified churn dashboard by segment or cohort in seconds. A Product manager can check feature adoption on the spot, without waiting in line. Companies with self-serve adoption above 40% resolve data questions 3x faster than those that still depend on centralized teams [10].
When routine questions never make it to the analyst queue, the bottleneck starts to disappear.
Lower Analyst Workload and Broader Access to Trusted Data
This is where the time savings hit hard. If analysts are stuck answering the same repeat questions every week, they have less room for deeper work. Routine reporting can eat up as much as 60% of a 10-person analytics team's capacity [1], and self-service models that are set up the right way can cut ad-hoc reporting requests by 80% [3].
That shift gives more teams direct access to live warehouse data through role-based views, all using the same certified metrics. GTM, Product, Customer Success, and Finance can work from the same source instead of passing spreadsheets back and forth. At the same time, power users can build new views from those same shared definitions. It's no surprise that 49% of finance executives point to self-service data as a main driver of employee productivity [2].
Centralized Reporting vs. Governed Self-Service: Side-by-Side Comparison
The differences between these two models are easier to grasp when you see them side by side.
Area | Centralized Reporting | Governed Self-Service |
|---|---|---|
Time to get a report | ||
Analyst effort per request | ||
Number of people who can self-serve | Limited to technical users and analysts [1] | |
Confidence in metrics | Variable - depends on individual analyst logic [2] | |
Access control | Manual - analyst checks permissions per request [1] | Structural - Row-Level Security (RLS) inherited automatically [4][5] |
Those gains only hold up if metric definitions and access controls stay tight.
The Main Risks of Self-Service Analytics
Self-service analytics removes reporting bottlenecks. But when access isn't governed, it creates a different set of problems. The biggest ones aren't technical at first glance. They're organizational: metric drift, dashboard sprawl, and decisions based on bad or misread data.
The most damaging issue is metric drift. Once teams stop using the same definitions, trust starts to fall apart everywhere else.
Metric Drift, Dashboard Sprawl, and Conflicting Definitions
The clearest risk is metric drift: two teams show different numbers for the same KPI because each team defines it differently. If no one owns a central definition for metrics like MRR, NRR, churn, or active user, Finance may calculate one number while Sales reports another. And this isn't rare. Research shows that 68% of self-service failures are caused by metric definitions drifting across teams [4].
Dashboard sprawl usually comes right after that. When people can't find a source they trust, they copy an old dashboard and tweak it. Then someone copies that version too. Bit by bit, the mess grows. Before long, you have dozens of overlapping reports and no plain answer to a simple question: Which one is current? 54% of organizations report this as a primary challenge [4]. What follows is predictable: duplicate dashboards, stale dashboards, and users who stop trusting either.
Bad Data, Misread Charts, and Overconfident Decisions
Metric drift is a definition problem. This next risk is more about data quality and data literacy, and it's often tougher to spot.
Many business users don't have the training to catch weak filters, shaky assumptions, or charts that look right but tell the wrong story. A non-technical user might apply a filter to a churn report that accidentally removes churned customers. Or they may see a seasonal drop and treat it like a long-term trend.
This gets worse when systems give answers without showing enough context. The danger is overtrust. A polished chart can hide bad inputs, weak assumptions, or missing data. For example, a column that's only 60% complete can still produce a chart that looks perfectly fine [6].
Risks, Business Impact, and Governance Controls: A Reference Table
Each failure mode lines up with a specific governance control. For warehouse-based SaaS teams, the table below shows the main risks, how they show up, and what helps address them.
Risk | How It Shows Up | Impact for SaaS Teams | Governance Control |
|---|---|---|---|
Metric Drift | Sales and Finance report different MRR or churn numbers in the same board meeting | Eroded trust in data; conflicting strategies | Semantic layer for SaaS / certified metrics [4] [2] |
Dashboard Sprawl | 50+ duplicate or abandoned dashboards with no clear owner | User confusion; stale data driving decisions | |
Data Misinterpretation | Users confuse correlation with causation or filter out key data subsets | Strategic decisions built on flawed logic | Data literacy training / explainable AI [1] [8] |
Bad or Stale Data | Charts built on null values or week-old snapshots | Overconfident, incorrect decisions | |
Permission Errors | An account executive sees commission data for their entire team | Security and compliance breaches (GDPR, HIPAA) | |
Excess Query Load | Slow warehouse performance; unexpected cloud cost spikes | Operational downtime; budget overruns | Compute quotas / query timeouts [7] |
These risks are manageable only when governance is built in from the start. The next section shows how semantic definitions, permissions, and audit trails keep self-service usable and safe.
How to Govern Self-Service Analytics Without Slowing Teams Down
The risks in the previous section - metric drift, dashboard sprawl, and bad data - aren’t a case against self-service. They’re a case for setting it up the right way from day one.
Each risk has a matching control. Clear definitions stop drift. Permissions stop data leaks. Audit trails stop blind trust. When governance is done well, teams still move fast - but now they can trust what they’re seeing.
Start with Data Modeling, Semantic Definitions, and Certified Metrics
Good self-service starts in the warehouse. Before anyone opens a dashboard, the data should be modeled, the metrics should be defined, and the datasets should be certified.
Many teams use dbt to apply tests and lineage on top of raw tables in Snowflake, BigQuery, or Amazon Redshift. That gives the warehouse some structure instead of turning it into a free-for-all.
Then comes the semantic layer. This is where joins and core metrics like ARR, NRR, and churn get defined once so every tool querying the warehouse uses the same logic. That matters more than it might seem at first glance. Without a semantic layer, two analysts can write two SQL queries for the same metric and end up with two different answers. That’s how trust starts to crack. Natural-language tools need to sit on top of governed data too, not raw tables.
Certified metrics and datasets push this one step further. The data team marks certain metrics as approved, assigns a named owner, and documents the refresh schedule. That way, people know which number to use and who’s responsible for it. A governed metric layer can cut copy-paste reporting errors by as much as 90% [9].
Once those definitions are locked in, access rules decide who gets to work with them.
Use Permissions, Approvals, and Audit Trails to Control Access
Permissions control exposure. Audit trails control accountability. In most cases, business users should stay in Consume or Explore. Create or Build access should be limited to power users.
Access Level | What the User Can Do | Technical Control |
|---|---|---|
Consume | View pre-built, certified reports | Read-only, published content only |
Explore | Filter, drill down, change dimensions | Interactive access within guardrails |
Create | Build new reports from governed datasets | Access to semantic layer and approved metrics |
Build/Share | Create and publish for peers | Full access with publishing rights |
Approval workflows for dashboards add a simple checkpoint before content gets shared more broadly. A draft moves through review before it’s certified, which helps stop half-finished reports from being treated like official sources.
Audit logs fill in the rest. They show who queried what and when, help spot misuse, and make stale content easier to find. Reports with zero views over 90 days are a strong signal that it’s time to retire them [5].
How Querio Supports Governed Self-Service on Live Warehouse Data
The point of a warehouse-native product isn’t just faster answers. It’s answers that stay governed and can be checked.
Querio connects directly to Snowflake, BigQuery, Amazon Redshift, ClickHouse, MotherDuck, and PostgreSQL using encrypted, read-only credentials. There are no CSV exports and no copied datasets. Users work directly against live warehouse data.
The governed context layer is where metric definitions, joins, and business terms live. Data teams define the logic once, and that same logic carries across ad-hoc questions, notebooks, dashboards, and AI-generated answers. So when a non-technical user asks something in plain English, the answer comes from shared rules - not from a black box skipping past governed definitions.
Every answer Querio generates includes the underlying SQL or Python. It’s fully inspectable and editable. Business users can see what ran. Analysts can verify it or tweak it. And for teams that want repeatable analysis that stays current, Querio’s reactive notebooks let analysts build logic that updates as the data changes. Role-based access controls and SSO integrations keep permissions aligned with the rest of your stack.
Conclusion: When Self-Service Analytics Works
Self-service analytics works best when business teams can move fast on data they trust - without metric drift or security risk. The idea is simple: analysts set the rules once, then business users dig into the same metrics on their own.
But that speed falls apart if governance comes later. The order matters more than the tool itself. Start by checking data quality, validating the semantic layer, and defining the first 5–10 certified metrics before rollout. If you launch the tool first, governance turns into cleanup.
When this is done right, self-service analytics can cut reporting backlogs by 60% [3] and give analysts more time for strategic work. The end state is a governed warehouse model with shared metric definitions, tiered permissions, approved content, and inspectable logic. That setup lets business users work with live data without copying it out of the warehouse. Self-service analytics should widen access without weakening trust.
FAQs
Who should get self-service access first?
Start with teams that ask the same questions again and again but get stuck waiting on a central reporting queue. Good early candidates include RevOps, marketing, and finance.
Focus first on groups that track recurring KPIs you can standardize in a governed semantic layer. Hold off on teams that need raw, sensitive, or highly complex data until your governance, access controls, and metric definitions are more mature.
How do you know if your metrics are ready?
Your metrics are ready for self-service when you have one governed source of truth and core definitions like revenue, margin, and ARR are documented and calculated the same way across teams.
You’re ready when you have:
a semantic layer for standardized business concepts
data quality checks for accuracy and completeness
role-based access controls
a centralized, version-controlled repository like dbt
What should you govern before rollout?
Before you roll out self-service analytics, set up governance first. If you skip that step, inconsistent reporting can creep in fast.
Start with a centralized semantic layer. That gives you one place to define key metrics and business logic, so teams use the same definitions instead of making their own.
You’ll also want structural governance in place. That includes role-based access controls, row-level security, clear metric ownership, dataset certification, and audit trails. The goal is simple: users should see data they can trust, and only the data that’s relevant to them.
Related Blog Posts


