Unlocking Your Data A Practical Guide to Data Warehouse Data Modeling
Master data warehouse data modeling with this practical guide. Learn core concepts, proven design patterns, and how to build models for performance and clarity.
published
Outrank AI
data warehouse data modeling, dimensional modeling, kimball vs inmon, star schema, data modeling
9baf4bb4-3e60-4e7d-a4c2-e380b98d5fb4

Data warehousing modeling is all about creating a blueprint for your company's data. It’s the behind-the-scenes work of taking raw, often messy information and arranging it into a logical, coherent structure. This process is what defines the relationships between different data points, making sure that when you ask a question about your business, the answer you get back is both accurate and fast.
Ultimately, this foundational step is what transforms a chaotic sea of data into a valuable, queryable asset.
Building the Blueprint for Business Intelligence
Imagine trying to construct a massive skyscraper without architectural plans. You’d have a mountain of steel beams, concrete, and glass, but no real structure, no safety, and certainly no function. That chaotic pile is exactly what your company’s data looks like without data warehouse data modeling. It’s the strategic thinking that organizes information so that anyone, from a data analyst to the CEO, can easily find what they need.
Think of it as the difference between a messy, disorganized stockroom and a perfectly organized library. In the library, every book has a specific place on a specific shelf, making it simple to find. This kind of blueprint is what allows powerful business intelligence tools to answer complex business questions correctly and efficiently.
When you get the model right, the benefits are huge:
Faster Query Performance: A well-designed model means your database doesn't have to sift through irrelevant information. The result? Dashboards and reports that load in seconds, not minutes.
Improved Data Quality and Consistency: Modeling establishes rules and standards. It ensures a term like "customer" means the exact same thing across sales, marketing, and support.
Simplified Analytics: It presents data in a format that makes business sense, empowering non-technical users to explore data and find answers on their own.
Scalability for the Future: A good model is built with an eye toward the future, allowing your data warehouse to grow alongside your business without needing a costly and painful overhaul.
A well-structured data warehouse model is the single most important factor in the success of a business intelligence project. It’s the framework that supports every query, every report, and every insight you generate.
This whole process involves figuring out how data from all your different sources—your CRM, your ad platforms, your payment processor—connects and how it should be stored. It's a core piece of building a modern analytics stack.
The real goal here is to create a "single source of truth" that everyone in the company can trust for a complete view of the business. Without it, you're stuck with isolated data silos and conflicting reports, making it nearly impossible to make truly informed decisions. This carefully planned structure is what ultimately allows tools like Querio to turn natural language questions into reliable answers, fueling a genuinely data-driven culture.
Understanding the Building Blocks of Your Data Model
Every solid data warehouse is built on a few core concepts. It's not about complex jargon; it’s about understanding two key pieces of the puzzle: facts and dimensions. Once you get how these two work together, you're well on your way to turning raw data into a genuine asset for analysis.
Let’s start with a simple, everyday example: a single purchase at an online store. The numbers you want to measure—the quantifiable parts of that event—are your facts.
A fact table is really just a big log of business events or transactions. Each row is a specific occurrence, and the columns hold the juicy numerical metrics you care about. These are the things you’ll eventually want to count, sum up, or average, like sales revenue, units sold, or profit margin.
But numbers without context are pretty useless. Knowing you made a $250 sale means nothing on its own. Who bought it? What did they buy? When? This is where dimensions enter the picture.
Adding Context with Dimensions
Dimensions are the descriptive tables that give you the "who, what, where, when, and why" behind every number in your fact table. They provide the rich, narrative context that makes the data meaningful.
Let’s go back to our e-commerce sale. The dimensions would be the tables that answer the real business questions:
Who made the purchase? That’s your Customer Dimension, holding everything from their name and location to maybe their loyalty status.
What was purchased? This is your Product Dimension, which has the product name, its category, brand, and maybe even its supplier.
When did the sale happen? That's the Date Dimension, which breaks down the transaction by year, quarter, month, day, and even day of the week.
Getting this structure right is a huge part of jobs like Data Architect roles, where the goal is to build these intuitive, high-performance data structures. Each dimension table links up to the fact table, turning a simple number into a multi-faceted business story.
This whole process is about creating order out of chaos, as the map below shows.
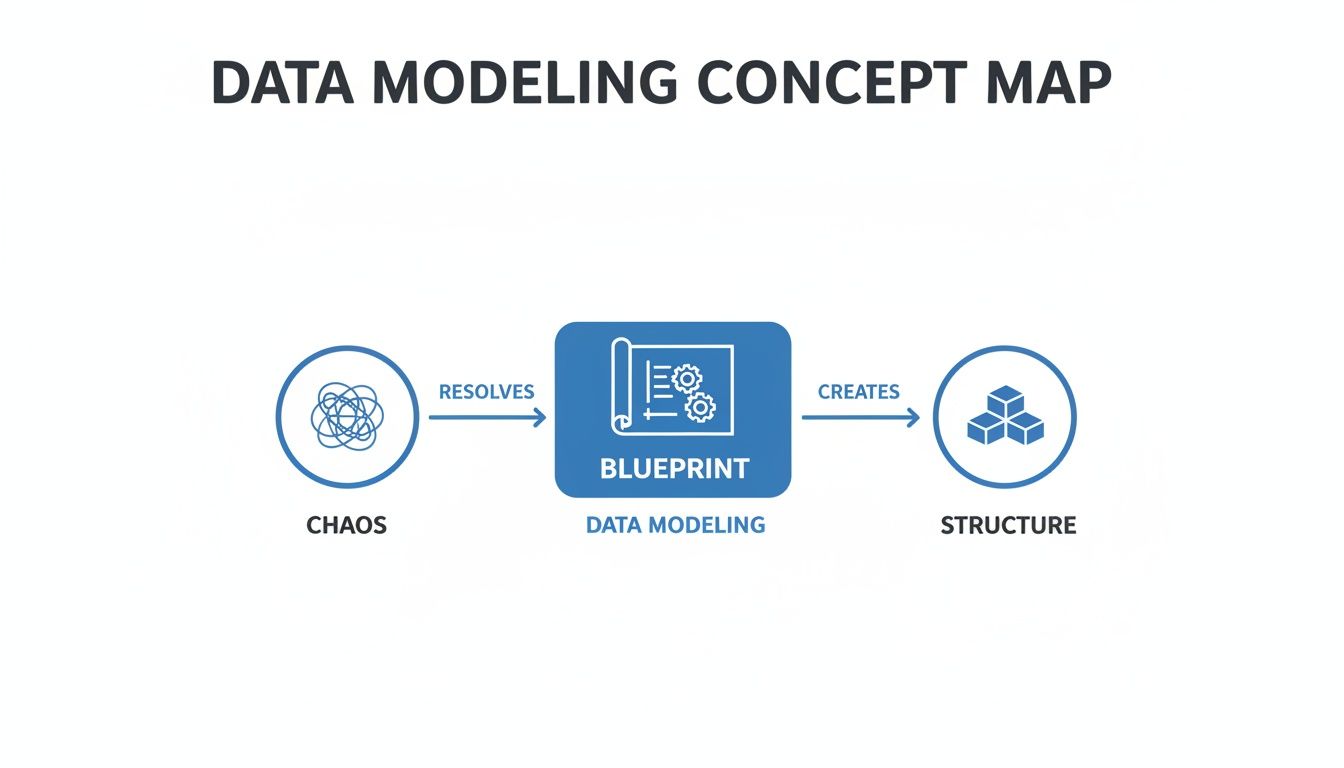
A good data model is the blueprint that transforms a jumble of disconnected data points into a clear, organized structure that’s actually ready for someone to analyze.
To quickly see the difference between these two core components, here’s a simple breakdown.
Facts vs Dimensions at a Glance
Characteristic | Facts | Dimensions |
|---|---|---|
Purpose | Stores quantitative, numerical business metrics | Provides descriptive, contextual attributes |
Content | Measurements, metrics (e.g., sales, quantity) | Textual descriptions (e.g., customer name, product color) |
Structure | Tall, narrow tables with many rows | Wide, short tables with fewer rows |
Example Questions | "How much?" or "How many?" | "Who?", "What?", "Where?", "When?" |
Change Frequency | Data is added frequently (new events) | Data changes infrequently (e.g., a customer moves) |
This table highlights the complementary roles they play; you simply can't have one without the other for meaningful analysis.
Defining the Grain: The Most Important Decision
Before you even think about building tables, there’s one decision that overshadows all others: defining the grain. The grain is simply the level of detail that a single row in your fact table represents. It is, without a doubt, the most critical decision in your entire model.
The grain statement is a declaration of exactly what a fact table row represents. Everything else in the model—the facts you can store and the dimensions you can connect—is dictated by this single decision.
Let’s think about our e-commerce fact table again. What does one row truly represent? You have options, and each one has major consequences for what you can (and can't) analyze later.
Grain = One row per order: With this model, you could easily store the total order value and the number of items. But you could never analyze the sales of individual products within that order. That detail is lost.
Grain = One row per product line item per order: This is a much more detailed, or "finer," grain. Now you can analyze individual product sales, quantities, and discounts. You have far more analytical power.
As a rule of thumb, it's almost always better to choose a finer grain. Why? Because you can always roll up detailed data to get a high-level summary (like total order value), but you can never drill down into details that you didn't capture from the start.
The grain you choose has a direct line to the kinds of questions your team can answer. For a more hands-on walkthrough of this process, check out our guide on https://querio.ai/article/how-to-build-a-data-model.
Comparing the Two Major Modeling Philosophies
When you first dip your toes into designing a data warehouse, you’ll run into two giants of the industry: Ralph Kimball and Bill Inmon. Their names are attached to the two dominant schools of thought in data warehouse data modeling, and understanding their philosophies isn't just an academic exercise. It's a foundational choice that will shape how your data is structured, how it's accessed, and ultimately, how useful it is for making business decisions.
Let's use an analogy. Imagine you're building a retail empire. Do you start by constructing a massive, perfectly organized central distribution hub that inventories every single product before anything goes out? Or do you begin by opening a series of specialized, customer-facing boutiques, each tailored to a specific department like electronics or apparel?
That's the core difference between the Inmon and Kimball methodologies right there.
The Kimball Method: A Bottom-Up Approach
Ralph Kimball was a huge proponent of dimensional modeling, which is fundamentally a bottom-up strategy. His philosophy is all about one thing: getting data into the hands of business users as quickly and intuitively as possible.
Following our retail analogy, Kimball's method is like building those specialized boutiques first. You pick a specific business area—say, sales or marketing—and build a highly optimized data mart just for that function. This data mart is typically built using a star schema, making it incredibly easy for analysts to "shop" for the insights they need. The whole focus is on speed, usability, and answering real-world business questions, fast.
Here’s what defines the Kimball approach:
Business Process-Oriented: Each model is built around a specific business process, like order fulfillment, inventory management, or customer support.
Fast to Implement: You deliver value incrementally, building one data mart at a time instead of waiting for a grand, unified project to finish.
User-Friendly: Star schemas are simple for both people and BI tools to understand, which translates directly to faster queries and easier report building.
It's a pragmatic approach, aimed at delivering tangible wins to business departments without getting bogged down in a massive, enterprise-wide project from day one.
The Inmon Method: A Top-Down Approach
On the other side of the aisle is Bill Inmon, often called the "father of the data warehouse." He advocates for a top-down approach. Inmon's philosophy is to build that massive, centralized distribution center first—what he termed the Corporate Information Factory (CIF).
With this model, the main goal is to create a single, centralized repository where all the company's data lives in a highly structured and integrated state. This central warehouse is built using a normalized structure, often Third Normal Form (3NF), to slash data redundancy and nail down data integrity. Only after this central hub is built and perfected do you spin off specific data marts for departmental analysis.
The Inmon approach is architected for enterprise-wide consistency and data integrity. It aims to build a single source of truth first, from which all other analytical applications are fed.
This methodology is all about control, consistency, and creating a truly holistic view of the company’s data. It’s a more rigorous, structured way of doing things, designed to prevent data silos from cropping up in the first place.
Making the Right Choice for Your Team
So, Kimball or Inmon? Which path is right for you? The honest answer is: it depends entirely on your organization's goals, resources, and timeline. Each one comes with its own set of pros and cons.
Feature | Kimball (Dimensional) | Inmon (Normalized/3NF) |
|---|---|---|
Approach | Bottom-up, business process-focused | Top-down, enterprise data-focused |
Primary Goal | Speed to insight and business usability | Data integrity and enterprise consistency |
Core Structure | Denormalized star schemas (Data Marts) | Normalized 3NF (Central Warehouse) |
Implementation Speed | Faster, delivering value in iterative cycles | Slower, requiring significant upfront design and effort |
Flexibility | More adaptable to changing business requirements | More rigid and less adaptable once built |
Best For | Teams needing quick wins and user-friendly analytics | Large enterprises requiring a single source of truth |
In the real world today, the Kimball approach is overwhelmingly popular for modern analytics. Dimensional modeling remains the go-to technique for analytic warehouses because it strikes a perfect balance between user-friendliness and performance at scale. Industry reports have shown that migrating from a normalized schema to a well-designed star schema can boost query performance by 2x–10x. For teams in product and finance, this can turn ad-hoc report turnarounds from weeks into hours, with some vendors even reporting a 30%–70% reduction in analyst workload. You can discover more about dimensional modeling's performance benefits on owox.com.
That said, the debate isn't as black-and-white as it used to be. Many modern data architectures now blend the two philosophies. They might use an Inmon-style normalized layer for data integration and storage (think of a data lakehouse) while serving up Kimball-style dimensional models to BI tools like Querio for fast, intuitive analysis. This hybrid model offers the best of both worlds: the rock-solid integrity of a central repository and the agile, user-focused speed of departmental data marts.
Putting Theory into Practice with Key Design Patterns
Alright, we've talked about the big-picture philosophies of Kimball and Inmon. Now it's time to get our hands dirty. Moving from theory to a working data warehouse means relying on a toolkit of proven design patterns. These are the nuts-and-bolts techniques that separate a functional model from a truly great one—one that's robust, easy to maintain, and consistently accurate.
Think of these patterns as the solutions to the most common headaches you'll encounter. They help you tackle real-world problems like tracking historical changes, keeping data consistent across different departments, and preventing chaos when your source systems inevitably change. Mastering them is essential for building a data warehouse that actually delivers reliable business insights.

Handling Historical Data with Slowly Changing Dimensions
One of the first challenges you'll face is how to manage changes to your dimension attributes. What happens when a customer moves to a new city? Or a product gets a new name? Or a sales territory is redrawn? How you handle these updates is absolutely critical for accurate reporting over time. This is exactly what Slowly Changing Dimensions (SCDs) were designed for.
SCDs are essentially a set of recipes for managing history. While there are several types, three of them cover most situations you'll run into:
SCD Type 1 (Overwrite): This is the "no history" approach. When an attribute changes, you just write over the old value. Simple. It’s perfect for fixing typos or clear errors, but it completely erases the past. If a customer moves from New York to Los Angeles, all their past sales now look like they happened in LA. History is lost.
SCD Type 2 (Add New Row): This is the gold standard for historical tracking and by far the most common method. Instead of overwriting, you add a brand new row for the customer with their updated info. You then use start/end dates or a simple "current" flag to show which record is active. This preserves the complete history, letting you see the business exactly as it was at any point in time.
SCD Type 3 (Add New Attribute): This is a middle-ground solution. You add a new column to hold the previous value of a specific attribute, like
current_cityandprevious_city. It gives you some limited history without the complexity of Type 2, but it doesn't scale well if you need to track many changes to the same attribute.
The right SCD type isn't a technical choice; it's a business one. It all boils down to whether you need to see the world as it is now (Type 1) or as it once was (Type 2).
Building a Foundation with Surrogate Keys
Another absolute must-have is the use of surrogate keys. A surrogate key is just a simple, unique ID (usually an integer) that the data warehouse assigns to each row in a dimension table. It has no meaning in the real world—its only job is to connect the dimension to the fact table.
So why is this so important? Because the "natural" keys from your source systems—like an employee ID or a product SKU—can and do change. An employee gets a new ID number, or a product SKU is revised. If you use that natural key to join your tables, the moment it changes, the link to all its historical facts is broken. Instantly.
A surrogate key decouples the data warehouse from the volatility of operational source systems. It provides a stable, permanent anchor for all historical facts, ensuring that your analytical history remains intact no matter what changes occur upstream.
Using surrogate keys is the bedrock of reliable historical analysis. It protects the integrity of your warehouse for years to come and is a core tenet of dimensional modeling.
Ensuring Consistency with Conformed Dimensions and Fact Types
As your data warehouse grows, you’ll likely build different data marts for sales, marketing, inventory, and so on. To make sure everyone is analyzing data from a shared playbook, you need conformed dimensions.
A conformed dimension is simply a dimension—like Date, Customer, or Product—that is built once and then shared across multiple fact tables. This means the sales team analyzing revenue by customer and the marketing team analyzing campaign responses by customer are using the exact same customer list. This seemingly simple idea is incredibly powerful because it lets you seamlessly integrate and compare data across the entire business.
It’s also helpful to recognize the different kinds of fact tables you might build:
Transactional: This is the most common type. Each row represents a single event, like a sale, a web click, or a phone call.
Periodic Snapshot: This table captures a "picture" of performance at regular intervals, like daily account balances or monthly inventory counts.
Accumulating Snapshot: This tracks a process that has a clear start and end, like an order fulfillment pipeline. A single row gets updated as the order moves through different milestones (e.g.,
order_placed_date,shipped_date,delivered_date).
The shift to cloud data warehousing has only made these patterns more critical. With the global market for cloud data warehouses expected to balloon to somewhere between $69–155 billion by 2025, companies are laser-focused on efficiency. Clean modeling patterns like star schemas and conformed dimensions minimize expensive data joins and wasted compute cycles—a huge deal in the pay-as-you-go cloud world. You can read more about the future of AI in cloud data warehouses on firebolt.io.
Optimizing Your Model for Speed and Savings
A theoretically perfect data warehouse model is completely useless if it’s too slow to query or costs a fortune to run. This is where the blueprint meets the real world. Smart data warehouse data modeling isn't just about the logical structure; it’s about making smart physical design choices that deliver real performance gains and cost savings.
This is especially true in the cloud, where modern data warehouses take advantage of the benefits of cloud computing to scale up and down. Your model needs to be built to thrive in this environment.
The goal is simple: make queries run faster while using fewer resources. In a pay-as-you-go cloud warehouse, every byte scanned and every second of compute time adds up on your monthly bill. Let's look at the key technical levers you can pull to make your model both fast and frugal.
Slicing Your Data with Partitioning
Imagine you have a gigantic fact table with billions of sales records from the last ten years. If an analyst just wants to see sales from last month, should the database really have to scan all ten years of data to find it? Of course not, but without instructions, it just might.
This is exactly what partitioning is for. It’s a physical design technique where you break a massive table into smaller, more manageable pieces based on a specific column—almost always a date. Think of it like organizing a giant filing cabinet by year. Instead of searching the entire cabinet for a document from 2024, you go straight to the "2024" drawer.
By partitioning your fact table by date, you’re giving the database a map. When a query comes in with a date filter (like WHERE order_date >= '2024-01-01'), the query optimizer can completely ignore all the partitions outside that range. This "partition pruning" can slash the amount of data scanned, leading to dramatically faster queries and lower costs.
Grouping Related Data with Clustering
If partitioning gets you to the right section of the warehouse, clustering (or sorting) organizes the data inside that section. Clustering physically stores rows with similar values for a chosen "cluster key" next to each other.
For example, after partitioning by date, you might cluster your sales data by customer_id. This means all of a single customer's transactions for a given month are stored together in a contiguous block. When you run a query to analyze that customer's buying habits, the database can read a small, tidy chunk of data instead of jumping all over its storage to piece things together.
Combining partitioning and clustering is a powerful one-two punch for optimization. Partitioning minimizes the data you scan, and clustering makes reading that data incredibly efficient.
These aren’t just minor tweaks; they have a massive impact. Proper modeling and physical design can drop query latency from minutes or seconds down to the sub-second range and cut compute spending by 20%–60%. A common, practical example—partitioning and clustering fact tables by date and a field like customer_id—often reduces the bytes scanned per query by over 50%, directly cutting your cloud bill in half. You can discover more insights about mastering data warehouse modeling on integrate.io.
Pre-Calculating Answers with Materialized Views
Some queries get run over and over again. Think about the key metrics that power your executive dashboard: daily active users, monthly recurring revenue, or year-to-date sales. Running these complex calculations from scratch every single time someone hits "refresh" is a huge waste of time and resources.
A materialized view solves this problem by pre-calculating the results of a query and storing them as a physical table. Instead of re-running the logic every time, queries can just grab the pre-aggregated, ready-to-go answer.
Here are a few great use cases:
Executive Dashboards: Pre-calculate the high-level KPIs that are viewed hundreds of times a day.
Complex Joins: If you have a costly join between several huge tables that’s used in many reports, materialize the result.
BI Tool Performance: Create summarized views for tools like Querio to query, ensuring dashboards load in a snap.
The trade-off, of course, is that materialized views use storage space and need to be refreshed to stay current. But for your most critical and frequently accessed data, the performance boost is almost always worth it. It’s a strategic decision to trade a little storage for a much better user experience and a lighter compute load on your most important queries.
How Your Data Model Empowers Self-Serve Analytics

At the end of the day, a data warehouse model isn't just an academic exercise for data engineers. It's built for the marketing managers, product leaders, and financial analysts who need answers to run the business. All that careful work—choosing schemas, defining grains, and wrangling SCDs—is what ultimately powers true self-serve analytics.
This is where the blueprint you’ve built becomes a superpower for the entire organization.
Modern BI tools like Querio lean heavily on this structure. They use it to translate simple, natural language questions into the precise SQL queries needed to pull the right data. Your model gives the AI the business context it needs to get the job done right.
Think about it: when a dimension table is clearly named dim_customer and a fact table is called fct_monthly_recurring_revenue, the AI doesn't have to guess. That clarity is the secret ingredient that makes self-serve analytics actually work.
From Model to Instant Answers
Picture a marketing manager asking, "Which campaigns drove the most new sign-ups last quarter in the EMEA region?" A well-structured data warehouse makes this kind of question trivially easy to answer. The AI can instantly:
Identify "campaigns" by looking at the
dim_campaigntable.Find "new sign-ups" as a key metric in the
fct_acquisitionstable.Filter by date using the handy
dim_datetable.Segment the results using the
dim_regiontable.
Without that logical model, the question is ambiguous. The system would probably return a wrong or incomplete answer. The model serves as a clear, machine-readable map of your business logic.
The ultimate payoff of excellent data warehouse data modeling is not a technically perfect database. It is the dramatic reduction in time-to-insight for non-technical teams, fostering a culture where data exploration is accessible to everyone.
This is the real goal. You’re empowering your colleagues to find answers on their own, which frees up your data team from an endless queue of ad-hoc report requests. It lets them focus on much more strategic work.
In effect, your model creates a semantic layer over the raw data. You can learn more about this in our guide to semantic layers and their key benefits. It transforms a complex database into an intuitive, question-and-answer machine for everyone.
Common Data Modeling Questions Answered
Even after you’ve got the core concepts down, you’ll inevitably run into specific questions when you start a real-world data modeling project. Let’s walk through some of the most common sticking points I see and give you some clear, practical answers to guide your design choices.
These questions usually pop up around choosing the right schema, wrestling with keys, and figuring out how all this connects to modern tools.
Star Schema vs. Snowflake Schema
So, what's the real difference between a star and a snowflake schema? Honestly, it boils down to a classic trade-off: simplicity versus normalization.
Star Schema: Imagine a central fact table directly connected to each of its dimension tables. This simple, denormalized structure looks like a star and is built for one thing: speed. It makes queries fast and easy for business users to understand, which is why it's the go-to for most BI work.
Snowflake Schema: This one takes the star and "snowflakes" it out by normalizing the dimensions into more, smaller tables. While this does a better job of reducing data redundancy, it also adds a lot of complexity. More tables mean more joins, and more joins can really slow down your queries.
For the vast majority of analytics work, the clear performance advantages and simplicity of a star schema make it the right choice.
Why Use Surrogate Keys Instead of Natural Keys?
This is one of those rules you just don't break. Surrogate keys are your secret weapon—they're unique identifiers (like a simple auto-incrementing number) that are generated and controlled entirely by your data warehouse. They never change.
Natural keys, on the other hand, are things that come from the source system, like a product SKU or a customer's email address. The problem? They can and do change. An employee gets a new ID number after a system migration, or a customer updates their email address. If you used that natural key, every single piece of historical data tied to it would instantly become disconnected.
Using a surrogate key ensures that an entity's entire history stays tied to a single, stable ID. This is absolutely critical for accurate historical reporting and for managing slowly changing dimensions effectively.
How Modeling Affects AI-Powered BI Tools
A good data model isn't just a technical detail; it's the foundation for any AI-powered BI tool. Think of it as the map and dictionary that an AI needs to understand your business. It provides the context—clear business terms, well-defined relationships, and a logical structure—that allows an AI to translate a plain-English question into a correct SQL query.
Without a well-designed model, an AI is flying blind. Its interpretations would be ambiguous and unreliable, leading to wrong answers and frustrated users.
Ready to turn that well-designed data model into a self-serve analytics engine? With Querio, anyone on your team can ask questions in plain English and get trusted, accurate answers in seconds. Explore how Querio empowers data-driven decisions at https://www.querio.ai.

