Business Intelligence
What Is Embedded Analytics? Benefits, Use Cases & Examples (2026)
Why embedding dashboards, AI summaries, and governed metrics inside your product boosts adoption, cuts churn, and drives revenue.
Embedded analytics means putting dashboards, reports, AI summaries, and self-serve data inside your product instead of sending users to a separate BI tool. If I had to boil this article down to a few points, it’s this:
Users adopt in-app analytics more often because there’s less friction
Teams can cut churn by 30%–40% when customers use analytics features often
Revenue can grow through premium reporting, add-ons, and upsells
Security and metric control are the hard part, not charts
The best setup is usually live warehouse access plus a shared semantic layer and server-side RLS
In plain English: embedded analytics helps people act on data where they already work. But it only works well when the numbers stay consistent and each customer can only see their own data.
Here’s the short version of when I’d use it:
Use embedded analytics for customer-facing dashboards, account health, finance views, RevOps tools, and in-app KPI tracking
Use separate BI for analyst work, open-ended investigation, and company-wide reporting
Buy instead of build if you want to ship in weeks, not months, and don’t want a long engineering tax
A few stats from the article stand out:
94% customer satisfaction for SaaS vendors with native in-app analytics
84% feature adoption for embedded analytics inside host products
3x to 5x more maintenance than expected for many in-house builds
6–18 months to build in-house vs. 2–6 weeks to launch with a vendor
$300,000–$1,500,000+ typical 24-month in-house cost vs. $15,000–$150,000/year for a platform
Option | Best for | Main upside | Main risk |
|---|---|---|---|
Embedded analytics | In-product decisions | High usage, less tab-switching | Security, upkeep, metric drift |
Separate BI | Analysts and execs | Deep analysis freedom | Lower day-to-day usage by end users |
Build in-house | Teams where analytics is core to the product | Full control | High cost, long build time |
Buy a platform | Most B2B SaaS teams | Faster launch, less engineering work | Less control than fully custom |
Bottom line: if you run a B2B SaaS product and want customers or internal teams to use data more often, embedded analytics is often the right move. But I’d only do it after checking three things: warehouse readiness, metric definitions, and multi-tenant security.
Benefits and tradeoffs for B2B SaaS teams
Benefits for product, revenue, and end-user adoption
The biggest upside is simple: less friction. Analytics lives inside the product, so users don't need to open another tab or sign in to a separate tool. When data is right there in the flow of work, people use it more. Embedded analytics features see an 84% adoption rate inside host products [1][5].
It can also help with revenue. 57% of product teams say embedded analytics has a direct positive effect on revenue, often through premium analytics tiers, white-labeled reporting, or usage-based add-ons [1][4]. And it doesn't stop at upsells. Customers who regularly use in-product analytics churn 30–40% less than those who don't [2]. That makes analytics more than a reporting feature. It becomes a lever for retention and account growth.
Once usage goes up, the next issue is whether the data layer stays governed.
Benefits for data teams and governance
For data teams, one of the biggest gains is fewer repeat reporting requests. If nontechnical users can answer their own questions through governed self-serve, analysts spend less time exporting CSVs or rebuilding the same dashboard again and again.
The piece that makes this work is a governed semantic layer. It maps raw warehouse columns to steady business definitions. Define a metric once, then reuse it across dashboards, notebooks, and embedded reports. That cuts down on the classic problem where two teams quote different numbers for the same KPI.
Security matters just as much. Role-based access and row-level security (RLS) need to be enforced at query time on the server, not in the client. That's what stops one customer from seeing another tenant's data. Cropin cut report delivery from 3–6 weeks to 1–2-week sprint cycles without adding headcount [7].
Of course, that only holds up if metric definitions and access rules stay aligned across both the warehouse and the product UI.
Common limitations and when separate BI still makes sense
The hardest parts are usually security and upkeep. In-house builds often come with 3x to 5x more maintenance than expected [1][4]. Teams have to keep charts up to date, patch security issues, tune query performance as data volume grows, and keep up with new visualization requests. That work stacks up fast.
RLS is probably the clearest example. If you run a multi-tenant SaaS product, data isolation has to happen server-side at query time, so Tenant A can never see Tenant B's rows. Client-side filtering is not a substitute. It's a real security risk.
Separate BI tools like Looker, Hex, or ThoughtSpot still fit best for:
Deep exploratory analysis
Broad executive reporting
Ad hoc investigation where analysts need full freedom
The table below shows where the tradeoffs differ in practice.
Criterion | Embedded Analytics | Separate BI |
|---|---|---|
Governance burden | Product team owns definitions and access; semantic layer must stay in sync with warehouse | Centrally managed by data/IT team; easier to enforce consistent definitions |
Maintenance load | Higher if built in-house; vendor-managed platforms reduce but don't eliminate it | Contained within the BI platform; upgrades and patches handled by vendor |
Multi-tenant security | Required; RLS must be enforced server-side at query time | Not typically needed; single-tenant permission model |
Flexibility for analysts | Limited to what the product UI exposes | Full ad hoc exploration, custom models, and notebook-style analysis |
Metric consistency | Depends on a shared semantic layer tied to the warehouse | Depends on BI platform's own semantic or LookML layer |
The next section breaks down the embedding models, governance controls, and warehouse-native patterns that make these tradeoffs manageable.
Common use cases and embedded analytics examples
Customer-facing analytics inside SaaS products
The goal isn't just to display charts. It's to put the right metric in front of the person who can do something with it.
One of the most common starting points is customer-facing analytics built right into the product. That usually means giving customers a direct view of their own data without sending them to a separate BI tool. In SaaS, that often looks like account health dashboards showing activation progress, weekly active users (WAU), feature adoption rates, and ROI metrics such as time saved. The same setup fits customer portals and e-commerce apps too, where users need order status, usage, inventory, or conversion data in context.
SpotDraft launched warehouse-native embedded analytics in 4 weeks and avoided months of in-house build time [2]. That meant customers could see product value sooner, while the product team got a cleaner route to adoption and retention.
Different users should see different views, even when the numbers come from the same source of truth. Admins need metrics like seat utilization, inactive users, and rollout progress. End users need to see their own activity and the value they're getting from the product. Both views should rely on the same governed definitions in Snowflake or BigQuery so the numbers don't drift.
That same in-product setup also works well for internal teams that need live data inside the flow of work.
Internal analytics inside sales, success, finance, and operations tools
Internal teams need live metrics in the tools they already use. That includes RevOps, CS, finance, and operations. A CS manager shouldn't have to wait on an analyst to explain last week's usage drop. A finance lead shouldn't need to sit tight for a weekly report on DSO or invoice aging.
Embedded analytics solves that by putting KPIs directly inside the places where decisions happen: RevOps portals, CS platforms, finance planning apps, and logistics dashboards. Take logistics as an example. A team can track on-time delivery (OTD) rates, carrier performance, and delivery exceptions inside its dispatch tool instead of bouncing into a separate BI instance. If an SLA breach is close, the warning is already there in front of the person who owns the next move.
That's where the speed comes from. The person responsible for the KPI can step in before the problem spreads.
It also keeps finance, CS, and operations aligned on current numbers. And once the data lives inside the workflow, AI can help turn it into faster answers, alerts, and summaries.
AI-powered embedded analytics experiences
AI is now part of embedded analytics itself, not some bolt-on layer sitting off to the side.
Natural-language querying lets a CS manager ask for accounts that haven't logged in for 14 days and get a chart back, with no SQL needed. Anomaly alerts can spot unusual drops in feature usage before a customer even notices. AI-generated summaries can turn a dense dashboard into a plain-English paragraph that a non-technical stakeholder can act on.
That said, AI only stays useful if it pulls from governed metric definitions. Otherwise, "active user", MRR, and churn start meaning different things in different places, and then the whole thing gets messy fast. Financial services teams using AI-powered embedded fraud detection have seen a 35% reduction in false positives and 360,000 hours saved in manual reviews [5].
These are the personas, workflows, and data sources teams usually scope first.
Persona | Workflow | Typical KPIs |
|---|---|---|
SaaS Admin | Product rollout & adoption | Feature adoption rate, inactive users, seat utilization |
CS Manager | Churn prevention | Account health score, usage drops, SLA breach risk |
Finance Lead | Revenue operations | DSO, invoice aging, MRR expansion |
Logistics Ops | Exception management | On-time delivery, carrier performance, delivery latency |
Sales/RevOps | Pipeline management | Deal velocity, forecast accuracy, quota attainment |
Embedded Analytics: The Ultimate Guide to Unlock the Power of Data
Implementation patterns, architecture, and tooling choices
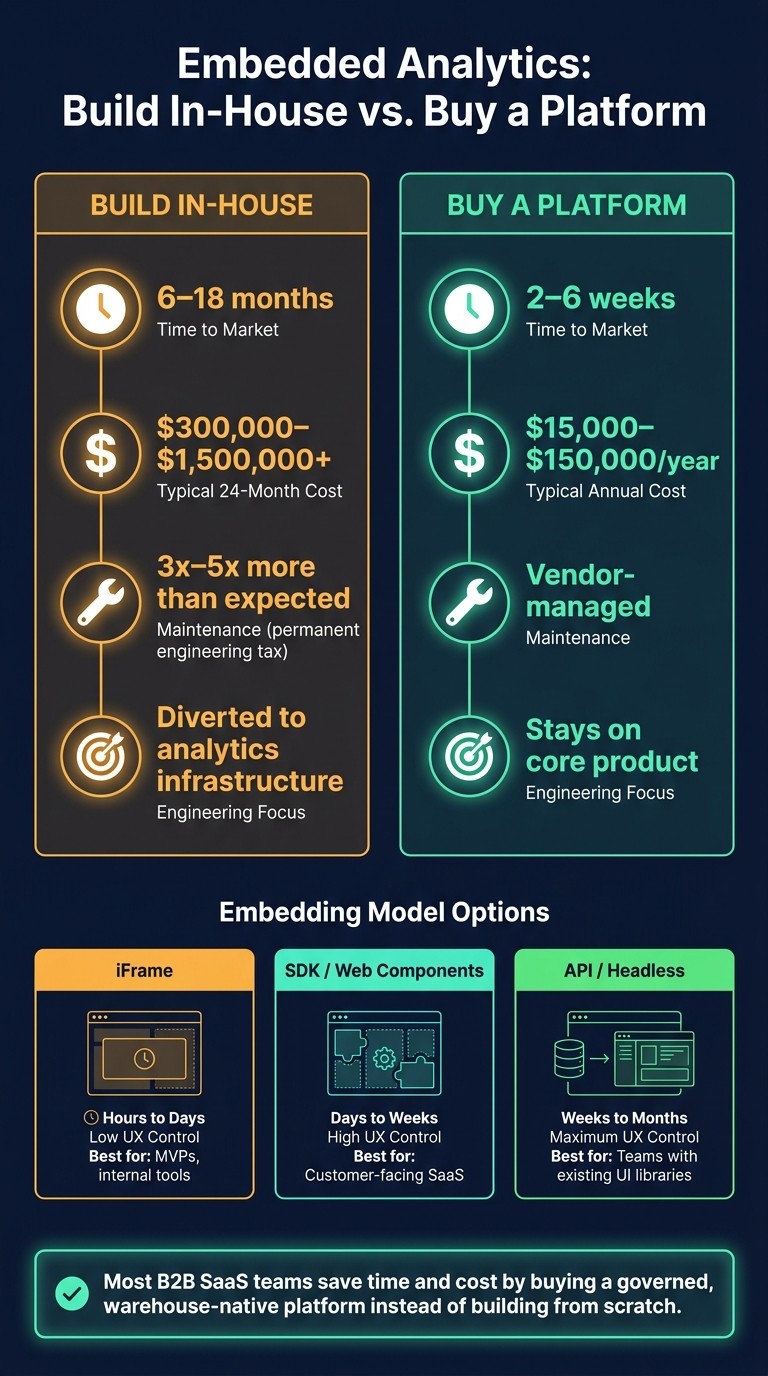
Embedded Analytics: Build In-House vs. Buy a Platform (2026 Cost & Time Comparison)
Once you know which use cases to go after, the next step is delivery. How you ship analytics shapes security, upkeep, and whether the experience feels like part of your product or a bolt-on.
Embedding models: components, APIs, iframes, and adjacent analytics
There are three main ways to embed analytics into a product.
Iframes are the fastest way to get started. You can launch in hours to days, but they often look a little out of place inside a polished SaaS app. That makes them a better fit for MVPs, internal tools, or partner portals [1][3].
JavaScript SDKs and web components are usually the best fit for modern B2B SaaS. They plug into the host app's DOM, so the analytics feels like part of the product instead of a separate tool. The host app can also pass identity and filter context - like tenant ID and active filters - into the analytics layer. Embedded analytics inside the host product has been reported to reach 84% adoption, while standalone BI tools tend to see much lower use [1][5].
API-first or headless BI gives teams the most control. You build custom visualizations on top of a governed metric engine that runs live warehouse queries [1][2]. This works well if you already have a design system and charting library. The tradeoff is plain: more engineering work up front, and more long-term ownership of the rendering layer [1][2].
Embedding Model | Time to Launch | UX Control | Best For |
|---|---|---|---|
iframe | Low | Internal tools, MVPs, partner portals | |
SDK / Web Components | High | Customer-facing SaaS | |
API / Headless | Maximum | Teams with existing UI libraries |
The delivery model matters because it sets how much control you keep over identity, styling, and metric logic.
Once you pick that model, governance becomes the next hard limit.
Governance, security, and warehouse-native design
"The hardest part [of embedded analytics] is multi-tenant security, not the visuals." - Analytify [1]
That sums it up well. The charts are the easy part. In multi-tenant SaaS, the risks of embedded analytics include tenant isolation and shared metric definitions. RLS needs to run server-side at query time. Client-side filters are not security [1][4].
Authentication should run through signed JWTs or SSO (SAML/OIDC) [1][4]. The host application passes identity claims to the analytics layer, and that layer scopes data access from there. Column-level security matters too, especially when different roles need access to different fields from the same tables in Snowflake, BigQuery, or Redshift [1][4].
The semantic layer helps keep metric names and filters aligned across dashboards, AI queries, and reports. If "active user" is defined once in dbt or a governed metric layer and reused everywhere, the numbers stay in sync [1][2][4]. Querying Snowflake, BigQuery, Redshift, or Postgres directly also keeps the embedded experience tied to the warehouse instead of drifting away from it [1][2].
Those controls decide whether embedded analytics stays safe as the product grows.
Build vs. buy: where Querio fits
Most teams lowball the cost of building in-house by 3 to 5x [1][4]. In practice, the tradeoffs usually look like this:
Factor | Build In-House | Buy with Querio |
|---|---|---|
Time to market | ||
Engineering focus | Diverted to analytics infrastructure | Stays on the core product |
Maintenance | Vendor-managed | |
Typical 24-month cost | $15,000–$150,000/year [1] |
Querio makes sense for teams that want governed, warehouse-native embedded analytics without building the semantic layer, security model, and query engine from scratch. It connects live to Snowflake, BigQuery, Redshift, and Postgres - no CSV exports. Its semantic layer keeps metric definitions in sync across dbt models, dashboards, and embedded experiences. SQL and Python are inspectable and editable, so analysts aren't stuck with a black box. That gives non-technical users governed self-serve inside the product without throwing metric consistency off track.
Building in-house can still make sense, but the lane is narrow. It's usually the right call only when analytics is the core product differentiator and the team has dedicated engineering capacity for multi-year upkeep. Mobile support and a steady stream of new chart requests also add to that maintenance load [1][4].
How to decide if embedded analytics is the right fit
Readiness checklist for data and product leaders
Before you commit, make sure your data stack can handle governed, warehouse-native analytics. The smoothest launches usually start with a few things you simply can't skip.
Use this checklist to see if your stack is ready before you move ahead.
Warehouse maturity comes first. If the data you need already lives in Snowflake, BigQuery, Redshift, or Postgres, and it's modeled with dbt or clean SQL, you're in a strong spot.
Metric governance comes next. Can your team define key metrics once and use them everywhere? If different teams are still arguing over the same numbers, solve that before anything else.
Multi-tenant security isn't optional. Test tenant isolation with two accounts. Server-side RLS at query time is the baseline [4].
Data freshness shapes your pipeline needs. Match freshness to the job: batch refresh for historical reporting, near-real-time for product usage and account health [2][1].
How to pick the first embedded analytics project
If your stack passes the checklist, don't start big. Start with the smallest workflow that can still prove the point. The sweet spot is high trust, low lift.
A good starting place is the manual report that Support or Customer Success keeps sending over and over. Customer health dashboards are often a strong first move [6]. Pick one dashboard people already trust instead of launching a broad self-serve suite on day one. Then watch usage and grow from there.
When choosing where to begin, weigh:
Customer value
Time saved
Data trust
Implementation effort
AI-powered features can wait. Add them later, after your core metrics are solid and your team trusts the numbers [6].
Key decision points to remember
If you only keep three ideas in mind, keep these.
Embedded analytics works best when it sits inside the product flow, not off to the side. Governance and security also need to be treated as core requirements, not cleanup work for later. The big calls are live warehouse access, server-side RLS, and a shared semantic layer. Those choices shape whether your embedded analytics stays trustworthy as the product grows.
For most B2B SaaS teams at this stage, the main call is build vs. buy. Building in-house can make sense if analytics is a core product differentiator and you have a team with dedicated engineering capacity for long-term maintenance [2][1][4]. For most teams, a governed, warehouse-native platform that connects live to Snowflake, BigQuery, Redshift, or Postgres - and keeps SQL inspectable instead of hiding it - gets you to market with less drag.
FAQs
How do I know if my data stack is ready for embedded analytics?
Your stack is ready when you have a centralized warehouse like Snowflake, BigQuery, or Redshift, plus a governed semantic layer so your metrics stay consistent across the board.
You also need reliable pipelines, tight row-level security, and tenant isolation. On top of that, your setup should connect safely to your current authentication provider, such as JWT or SSO, so people only see the data they’re allowed to access.
What’s the best first embedded analytics use case to launch?
Start with a high-impact dashboard that fixes a clear, repeat pain point, like ROI visibility, core KPI tracking, or real-time performance reporting.
Keep the first rollout tight. Pick one high-traffic area - such as a customer-facing usage report or a key workflow - so you can prove value fast, collect feedback, and test your data models and integrations before you expand.
How do teams keep embedded analytics secure in a multi-tenant SaaS app?
Teams keep embedded analytics secure in multi-tenant SaaS apps by enforcing strict data isolation and governance at the query level, not just in the UI.
The strongest approach is server-side row-level security (RLS). With RLS, queries are filtered by the authenticated user’s attributes, such as organization ID, before the database runs them. That matters because security lives in the data layer, not just on the screen.
Authentication should also stay in sync with the host app through JWT, SSO, or SAML. That way, every interaction stays scoped to the tenant data the user is allowed to see.
Related Blog Posts