Business Intelligence
Sigma vs Hex (2026): Two Very Different Answers to Analytics
Compare Sigma and Hex for mid-market teams: Sigma for business self-serve dashboards; Hex for code-first notebooks, apps, and AI.

If I had to give the short answer: Sigma is for business-led BI, and Hex is for code-led analysis.
If you run a team of 100 to 500 people, this choice usually comes down to three things:
- Who uses the tool most: business teams or analysts
- How work gets done: visual workbooks or SQL/Python notebooks
- What you need to ship: dashboards or data apps
The article’s core point is simple: these tools do different jobs. Sigma leans toward self-service reporting tools, live warehouse analysis, and governed metrics. Hex leans toward notebooks, SQL + Python, published apps, and AI help for technical users.
A few numbers stand out right away:
- Hex public pricing starts at $36/editor/month and $75/editor/month
- In the scorecard, Sigma gets 10/10 for business self-serve
- Hex gets 10/10 for notebook depth
- Both land at 7/10 for governance rigor
Quick Comparison
| Criteria | Sigma | Hex |
|---|---|---|
| Best for | Finance, ops, and business teams | Analysts, analytics engineers, and data scientists |
| Main workflow | Visual workbook analysis | SQL and Python notebooks |
| Main output | Dashboards and governed reporting | Interactive apps and deep analysis |
| Governance | Data models and warehouse-based controls | Context Studio, shared metrics, and Git-based version control |
| AI use | AI apps for business tasks | AI help for SQL and Python drafts |
| Warehouse model | Live queries, no extracts | Push-down compute, no extracts |
| Pricing | Platform fee + per-user licensing | Free tier, then $36/editor/month and $75/editor/month |
My read: pick Sigma if you want many non-technical users working in live data with guardrails. Pick Hex if your team writes SQL and Python every day and needs to publish that work in a usable format.
That’s the lens I’d use for the rest of the piece.
sbb-itb-284a532
Where Sigma fits best
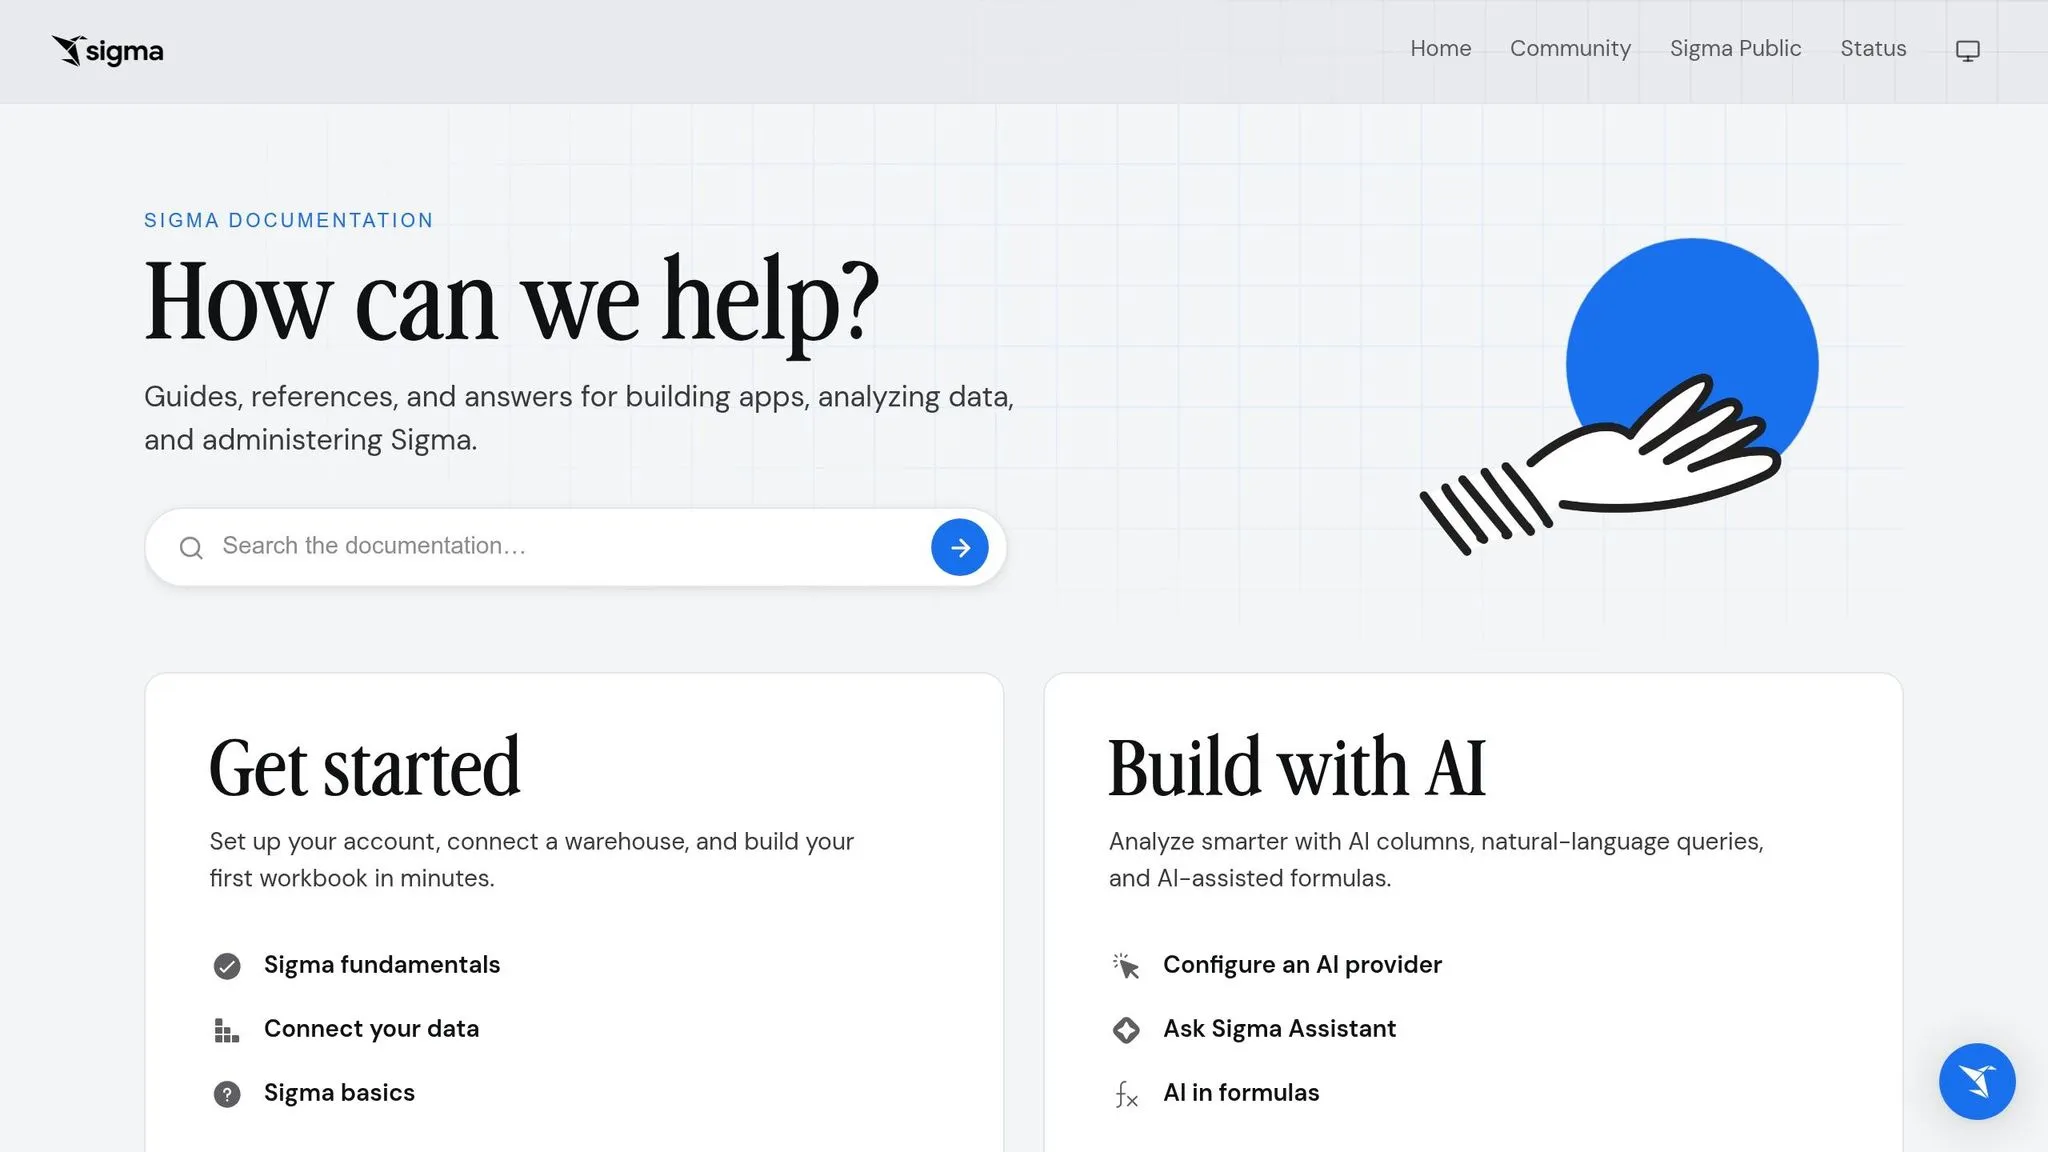
Sigma works best for mid-market teams that have moved past rigid BI workflows but still want self-service reporting to stay efficient.
Spreadsheet-style exploration for business teams
The main draw is its spreadsheet-like interface. Business users can filter, group, pivot, and drill into live warehouse data in Snowflake, BigQuery, or Redshift without writing code. That means less bouncing between SQL editors, BI tools, and spreadsheets.
Governed reporting on top of the warehouse
Sigma is also built for governed self-serve reporting on top of the warehouse. Since Sigma runs queries in the warehouse, performance depends on warehouse tuning [1].
That makes Sigma a better fit for governed business reporting, while Hex handles code-first work that needs SQL, Python, and app outputs.
Where Hex fits best
Where Sigma is built for business-user exploration, Hex is built for analyst work in code. It’s a notebook-first tool for analysts and analytics engineers who want SQL, Python, charts, and shareable outputs in one place. The sweet spot here is repeatable, code-first analysis, not spreadsheet-style BI.
SQL and Python in one collaborative workspace
At the center of Hex is a collaborative notebook where SQL and Python cells sit side by side. Teams working in Snowflake, BigQuery, Redshift, or Postgres can query live data directly, which keeps analysis close to the source. More than one analyst can also work in the same notebook, so it feels less like passing files around and more like working together in real time.
That setup matters because Hex is made to publish the work, not just run it.
Notebook outputs, internal apps, and AI-assisted analysis
Hex turns analysis into something people can actually use and share. A finished notebook can be published as an interactive data app, with inputs and outputs presented cleanly for the end reader.
It also comes with Magic AI and a Notebook Agent that turn natural language into SQL or Python. That can speed up early drafts of queries and code without taking control away from the analyst.
For teams that want code-first analysis and reusable outputs, Hex is the stronger fit. Governance comes through version control, project permissions, and Context Studio. That difference stands out even more in the side-by-side comparison below.
Sigma vs Hex side by side
::: @figure 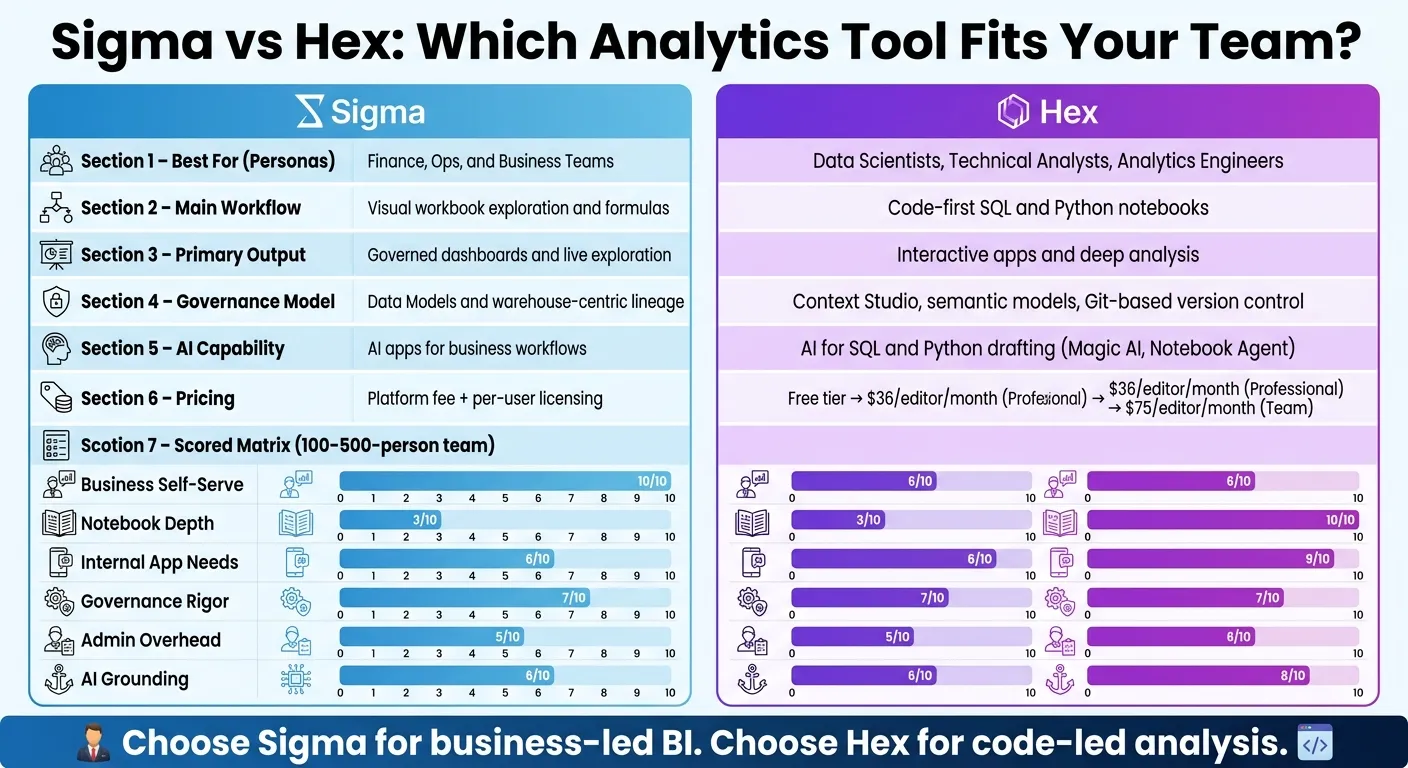 {Sigma vs Hex 2026: Side-by-Side Analytics Tool Comparison}
:::
{Sigma vs Hex 2026: Side-by-Side Analytics Tool Comparison}
:::
The two tools may look similar at a glance. But when you look at who uses them, how work gets done, and what each tool is built to produce, the gap gets pretty clear. The table below breaks down how Sigma and Hex differ across personas, workflow, governance, collaboration, and cost.
Comparison table: personas, workflow, governance, and cost
| Criterion | Sigma | Hex |
|---|---|---|
| Personas | Finance, Ops, business teams | Data scientists, technical analysts |
| Workflow | Visual exploration and formulas | Code-first analysis with linked execution |
| Outputs | Governed dashboards, live exploration | Interactive apps, deep analysis |
| Governance Model | Data Models, warehouse-centric lineage | Context Studio, semantic models (shared metric definitions), Git-based version control |
| Collaboration Style | Shared workbooks, business self-serve | Multi-player notebooks, Threads (Slack integration) |
| Warehouse Use | High - live query, no extracts | High - push-down compute, no extracts |
| Extensibility | AI Apps, Input Tables (write-back) | Custom Docker images, API, CLI, Python libraries |
| AI Style | AI apps for business workflows | AI for SQL and Python drafting |
| Pricing Model | Platform fee + per-user licensing | Per-editor pricing |
Hex’s public pricing starts with a free Community tier, then $36/editor/month for Professional and $75/editor/month for Team, with custom Enterprise pricing.
Governance is one of the biggest tie-breakers here. Sigma leans on Data Models and lineage. Hex leans on Context Studio, semantic models, and Git-based version control. That difference matters because it shapes how teams define metrics, track changes, and keep work under control.
The matrix below turns that side-by-side view into a practical pick for a 100–500-person team.
Scored matrix for a 100–500-employee team
This matrix shows fit for a mid-size team, not feature count.
| Criteria | Sigma | Hex |
|---|---|---|
| Business self-serve | 10 | 6 |
| Notebook depth | 3 | 10 |
| Internal app needs | 6 | 9 |
| Governance rigor | 7 | 7 |
| Admin overhead | 5 | 6 |
| AI grounding | 6 | 8 |
Hex posts its best scores in notebook depth and AI-assisted technical analysis. Sigma pulls ahead in business self-serve. The admin overhead scores hint at the same thing for both tools: neither one runs on autopilot. As teams get bigger, both need setup and guardrails.
So the choice comes down to one plain question: Is your team mostly business users exploring data, or technical users building analysis and apps? That answer usually points you to the right tool fast.
How to decide for your team
The scored matrix and comparison table help trim the list. But the final call usually comes down to three simple questions: Who asks the most questions? What kind of output do they need? How much SQL do they write? In practice, that often points to one of two paths: business-user reporting in Sigma or analyst-led notebook work in Hex.
Choose based on users, governance, and output format
Choose Sigma when business users need live, self-serve exploration and governed dashboards. It fits teams where people outside the data group want to dig into numbers on their own without waiting on an analyst every time.
Choose Hex when analysts need SQL and Python in the same shared notebook, and stakeholders are fine consuming published outputs instead of sending ad hoc requests back to the team. That setup works well when the analysis itself is the main job.
There’s another angle here: metric control. If consistent metrics across finance, sales, and product matter most, a governed metric or semantic layer on top of live warehouse data is the cleaner way to run analytics.
Conclusion: pick the tool that matches the actual analytics job
The main factor is your team’s bottleneck, not the length of a feature checklist. Sigma is the better fit when the goal is broad, governed self-serve reporting. Hex makes more sense when the team centers on notebook-based analysis, SQL/Python teamwork, and shipping interactive data apps to stakeholders.
FAQs
::: faq
Can one team use both tools?
Yes. A lot of teams use both tools so technical and non-technical users each get an interface that fits the way they work.
A common setup looks like this: one tool handles deep, collaborative ad hoc analysis, while the other is used for governed self-serve reporting.
The big risk is metric drift. That happens when teams define the same KPI in different ways across tools. The usual fix is simple: connect both tools to the same shared semantic layer so everyone works from the same definitions. :::
::: faq
How should I think about total cost?
In 2026, total cost depends less on per-seat fees and more on how you scale and how much of your stack you can roll into one platform.
A lot of BI tools still charge per seat. That can get expensive fast as you add more viewers across teams. Newer AI-native platforms often take a different route, using flat subscriptions, usage-based credits, or open-source models instead.
There’s another cost factor that matters just as much: whether the platform can take the place of separate tools like dbt, observability, or ETL. If one tool can handle more of that work, you may spend less over time.
In practice, cutting vendor sprawl is often the biggest reason teams lower long-term spend. :::
::: faq
Which tool is easier to govern at scale?
It depends on how your team works day to day, and what matters more to you: central control or room to analyze from different angles.
Hex leans on project structure, version control, and endorsed notebooks. That setup can work well for analyst-led teams. But there’s a catch: metric consistency still depends on how well individual notebooks are kept in sync.
Querio is usually easier to manage at scale for governed self-serve. Its centralized semantic and context layer keeps metric definitions, business terms, and joins in line across dashboards, notebooks, and AI answers. :::