Business Intelligence
Omni vs Sigma: Spreadsheet BI or Semantic BI?
Compare spreadsheet-style Sigma and semantic-model Omni: fast ad-hoc warehouse analysis vs governed, reusable metrics for consistent KPIs.
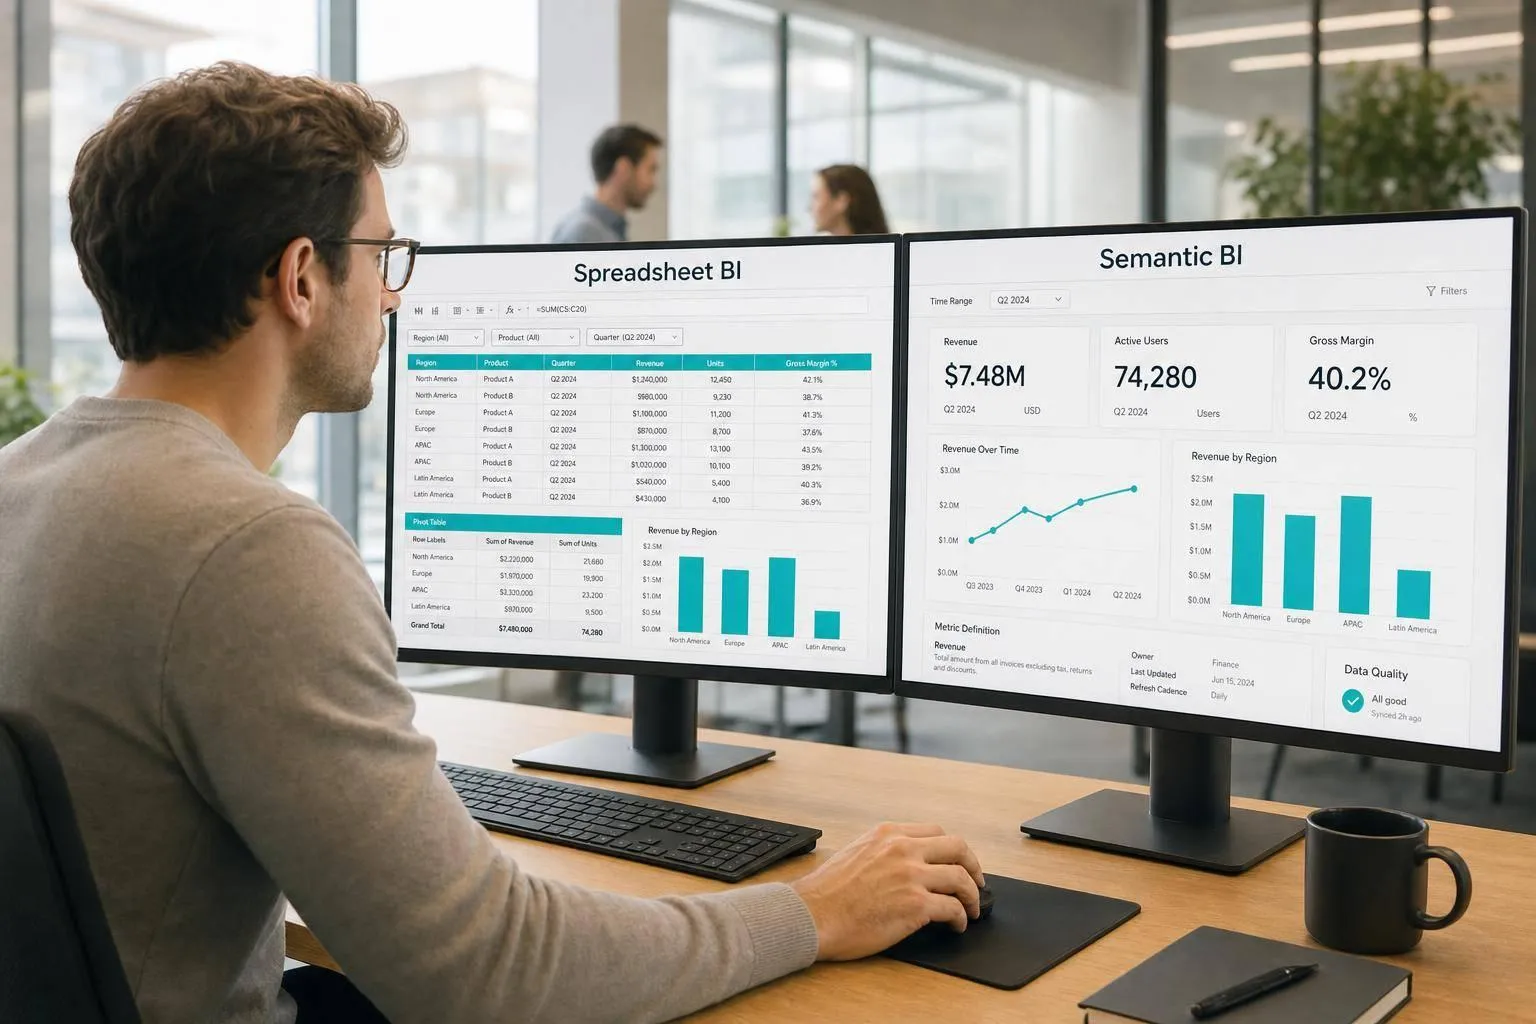
If your team works like Excel on top of Snowflake or BigQuery, Sigma is usually the better fit. If your team needs one shared metric definition across reports, Omni is usually the better fit.
I’d boil it down like this:
- Sigma is built for spreadsheet-style analysis on live warehouse data
- Omni is built for shared metrics, governed logic, and reuse across reports
- Sigma tends to fit Finance, Ops, and marketing teams that want fast self-serve work
- Omni tends to fit data teams using dbt and Git to control metric logic
- For one-off ad hoc analysis, Sigma often feels more natural
- For recurring KPI reporting, Omni usually keeps numbers more consistent
- The article also covers AI-readiness, dashboards, ad hoc work, and support across Snowflake, BigQuery, Redshift, Postgres, and dbt
One stat stands out: 26 of 58 tools (45%) in the cited market set include governed semantic layers. That helps explain why Omni’s model matters more when the same KPI must match across Finance, Sales, and Marketing.
::: @figure 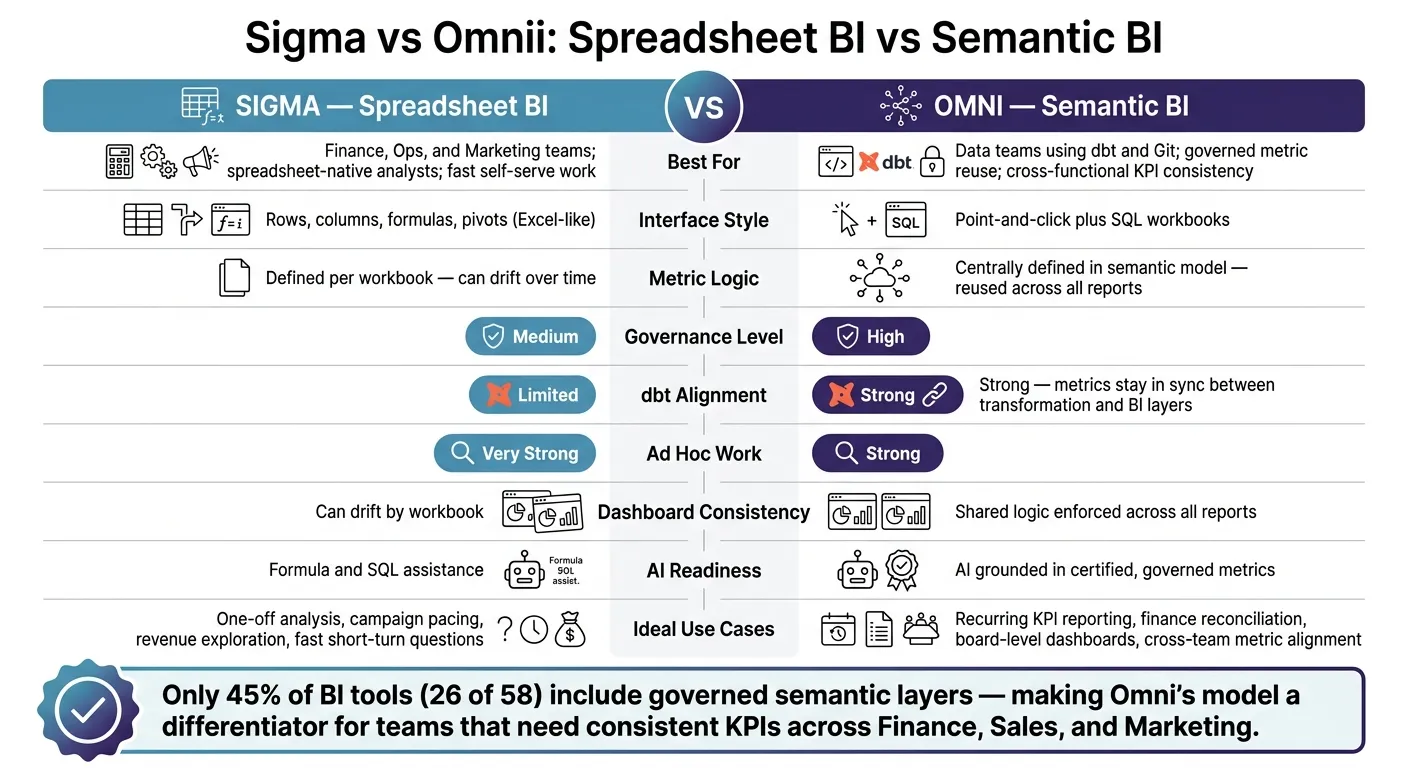 {Sigma vs Omni: Spreadsheet BI vs Semantic BI Comparison}
:::
{Sigma vs Omni: Spreadsheet BI vs Semantic BI Comparison}
:::
Omni Demo
::: @iframe https://www.youtube.com/embed/9GduXHYYGbU :::
sbb-itb-284a532
Quick Comparison
| Criteria | Sigma | Omni |
|---|---|---|
| Main style | Spreadsheet BI | Semantic BI |
| Best for | Business-user-led analysis | Governed metric reuse |
| Interface | Rows, columns, formulas, pivots | Point-and-click plus SQL workbooks |
| Metric logic | More workbook- or model-level | Central semantic model |
| Governance | Medium | High |
| dbt alignment | Limited compared with Omni | Strong |
| Ad hoc work | Very strong | Strong |
| Dashboard consistency | Can drift by workbook | Shared logic across reports |
| AI use | Formula and SQL help | AI grounded in certified metrics |
My take: if you care most about spreadsheet familiarity, pick Sigma. If you care most about metric consistency, pick Omni.
The rest of the piece explains where each model works well, where it runs into limits, and how to choose based on your team’s workflow.
Sigma: warehouse-native spreadsheets for self-serve analysis
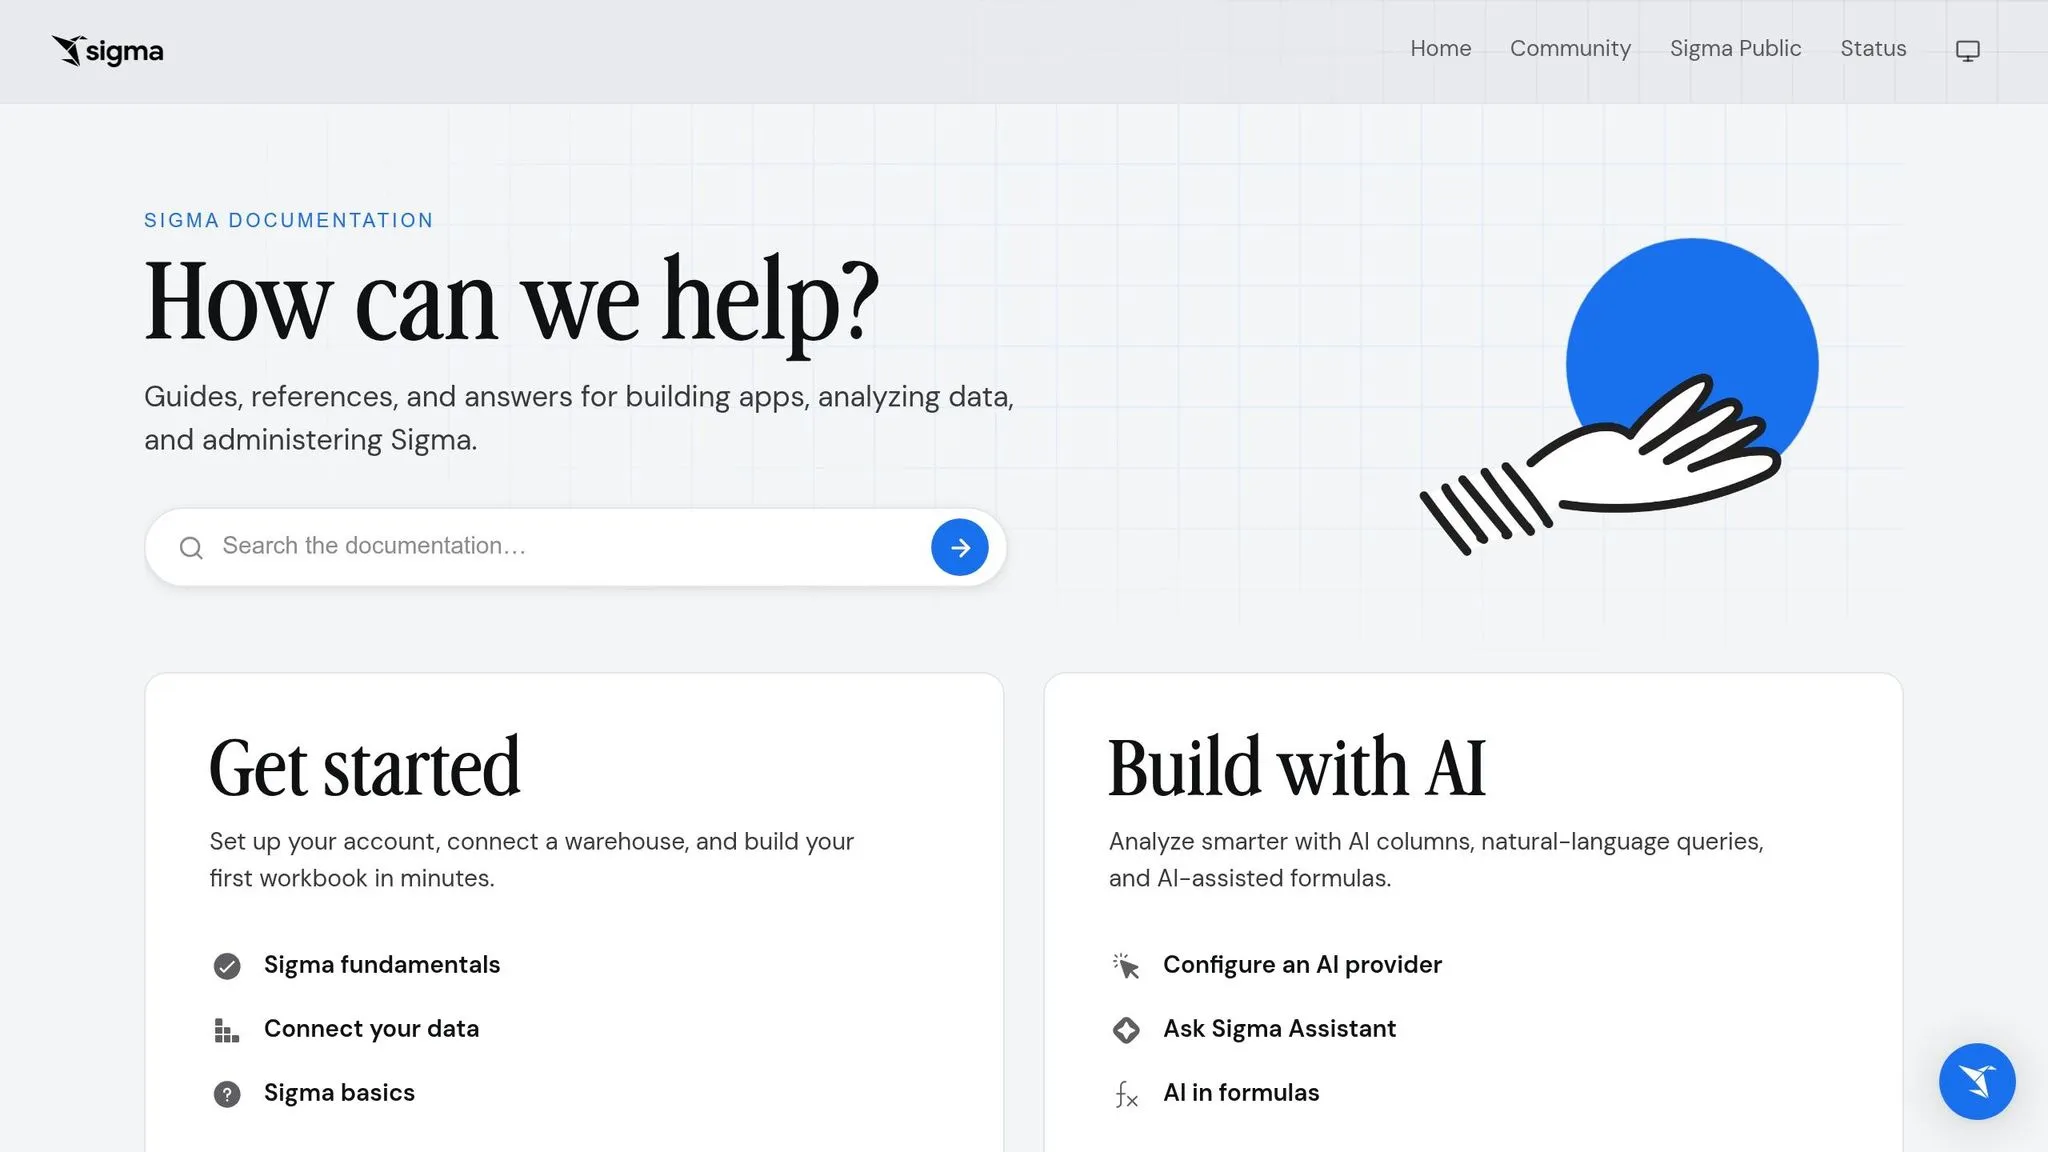
Sigma connects straight to Snowflake, BigQuery, Redshift, Databricks, or Postgres and shows live warehouse data in a spreadsheet-style grid. People can work directly on top of warehouse data without exporting CSVs or making copies. Sigma handles the SQL in the background.
That setup turns spreadsheet know-how into direct warehouse analysis. If a team already works in rows, columns, formulas, and pivots, they can start using Sigma without first learning SQL.
Where Sigma works well
Finance, operations, and marketing teams often pick up Sigma fast because Excel and Google Sheets habits carry over. The interface turns familiar actions like filtering, grouping, and calculations into SQL queries that run against the warehouse.
That makes Sigma a strong option for fast, exploratory work: revenue exploration, campaign pacing, forecasting, and operational analysis when business users need answers on the spot. Sigma also supports Input Tables, a write-back feature that lets users send inputs back to warehouse tables. That helps with planning and data annotation workflows.
For ad hoc querying, especially when speed matters more than centralized metric governance, Sigma’s flexibility is a big plus.
Where Sigma runs into limits
That same flexibility can become a problem once teams need shared definitions. The tradeoff shows up when the same metric needs to mean the same thing everywhere. Recurring executive dashboards and cross-functional reporting often need more upkeep inside Sigma’s Data Models. The more your analytics work depends on governed, reusable business logic, the more spreadsheet-style freedom can work against consistency.
When reusable definitions matter more than workbook-level flexibility, a semantic layer is usually the better fit.
Omni: semantic BI built on governed metrics and reusable logic
Omni is the semantic-model route. Teams define metrics, dimensions, joins, and business logic once, then use them again across dashboards, workbooks, and ad hoc analysis. You feel that difference pretty fast in day-to-day dashboarding and ad hoc work.
Where Omni works well
Omni fits teams that already put serious effort into warehouse modeling and shared data standards, especially teams using dbt. It connects straight to dbt models, so metric logic stays in sync between the transformation layer and the BI layer instead of getting rebuilt in a bunch of places. If your team already models in dbt, that setup cuts duplicate logic and helps prevent reporting drift.
Analysts can begin in a workbook and then move tested logic into the semantic model. That keeps ad hoc work quick, while making sure only checked logic gets reused. Model updates go through Git-based review, which gives teams version control and an audit trail for business logic.
For business users, the semantic layer turns raw source tables into business terms people can work with. Users can mix certified metrics and dimensions in a point-and-click interface without writing SQL and without waiting on a new report. That helps reduce metric drift, where the same KPI gets calculated in different ways across teams.
How a semantic layer affects AI-readiness
AI assistants that sit on top of a semantic layer use certified metrics and defined join paths. So when someone asks, "show me revenue by region", the answer is more likely to stay consistent. That matters when finance, marketing, sales, and leadership all need to look at the same number and trust that it means the same thing.
You see that most clearly in dashboards, revenue reporting, and ad hoc analysis, especially during finance close, revenue reporting, and executive dashboard review.
How the two models differ in day-to-day analytics work
The way a tool is set up affects almost every analytics task, from KPI definitions all the way to board-level trust. You see it most in who owns metrics, how dashboards get maintained, and how often teams have to stop and reconcile numbers that should have matched in the first place.
Metrics, dashboards, and ad hoc analysis side by side
Sigma helps analysts move fast. That speed is useful, especially when a team needs answers now, not next week. But there’s a tradeoff: when different workbooks define the same metric in different ways, teams can end up arguing over whose number is right.
Omni takes a different path. It keeps dashboards and ad hoc analysis tied to the same metric definitions. That means the logic stays in one place instead of being rebuilt over and over. If those definitions start to drift, you get mismatched numbers either way, a common issue when comparing semantic layers vs traditional data models.
The table below shows how that choice plays out in daily work.
| Workflow | Sigma | Omni |
|---|---|---|
| KPI definition | Defined in individual workbooks, which can drift over time | Defined centrally in the semantic model and reused across analysis |
| Dashboard maintenance | Fast to build, but workbook logic can vary by analyst | Dashboards reuse the same governed metric definitions |
| Ad hoc exploration | Strong for quick, spreadsheet-style analysis | Supports exploration while keeping shared definitions intact |
| Metric consistency across teams | Depends on analyst discipline | Enforced through the semantic layer |
Use-case fit: revenue reporting, marketing performance, finance reconciliation
This split becomes even clearer when you look at actual workflows.
Revenue reporting usually needs consistency more than anything else. For recurring leadership and board reporting, a semantic model is often the better fit because the same MRR definition can be reused every time. Finance reconciliation leans the same way. If adjustment logic changes from one report to another, trust breaks down fast.
Marketing performance is different. Those questions often move fast and stay narrow. One week it’s campaign performance by channel, the next it’s lead quality by audience segment. In that kind of work, spreadsheet-style exploration can make more sense for short-lived analysis.
That’s why many teams end up with a mix:
- A small set of core dashboards for recurring reviews
- Flexible analysis for one-off questions
Where Querio fits for governed self-serve analytics
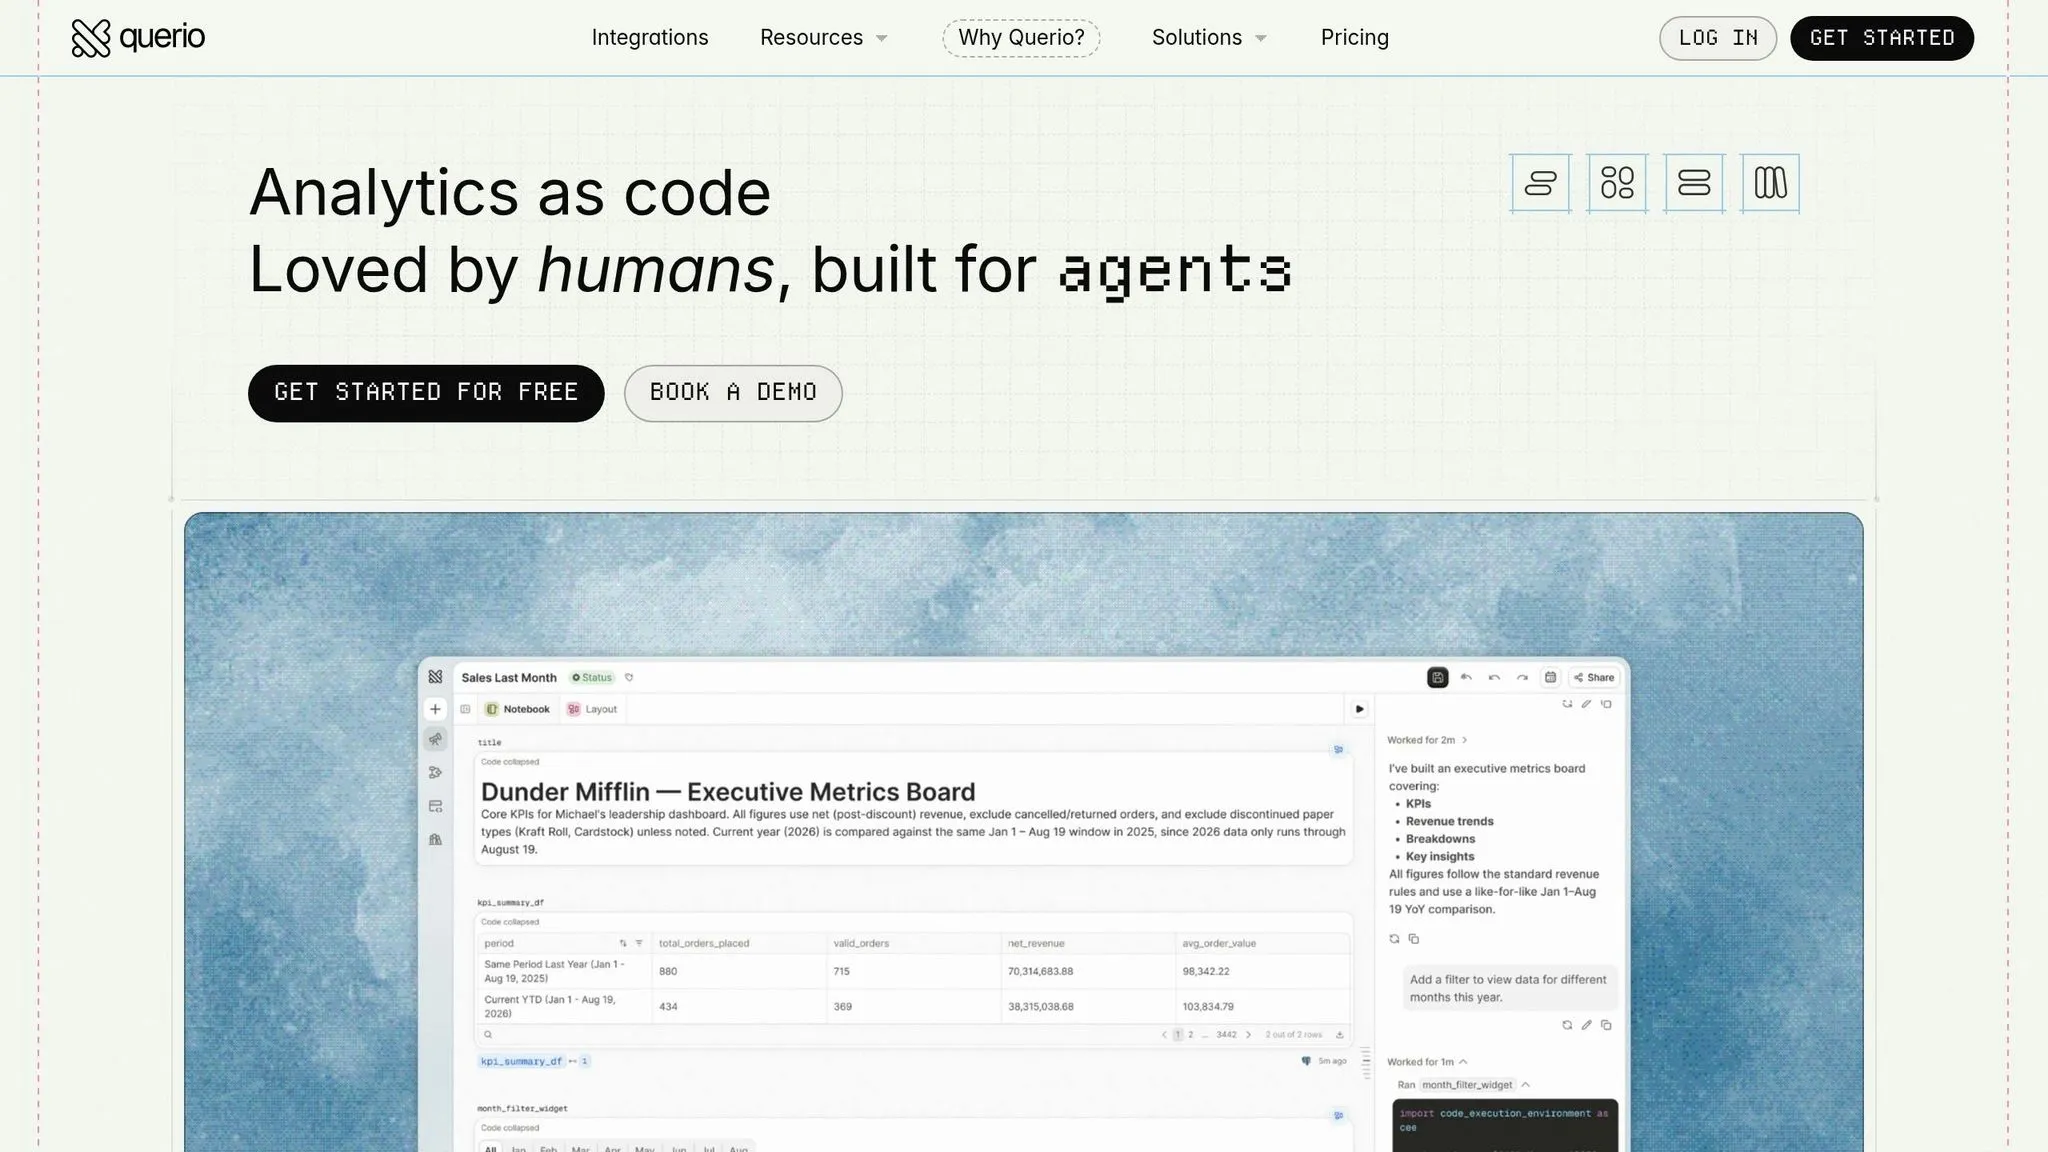
For teams that want both speed and control inside a live warehouse workflow, Querio keeps the logic governed without forcing exports or copies. It fits teams that want governed self-serve analytics on a live warehouse without giving up inspectable SQL or Python.
Analysts can inspect and edit the logic behind an answer, then rerun it against Snowflake, BigQuery, or Redshift. For non-technical users, the goal is simpler: answers should be self-serve and grounded in trusted logic. AI self-service is working when most questions get answered without escalation to the data team.
Which model fits your team
Sigma fits spreadsheet-first teams that want fast, business-user-led analysis in the warehouse. Omni fits teams that need governed metrics, reusable logic, and the same answer across the business.
How to choose based on workflow, governance, and consistency needs
If your analysts live in spreadsheets and Finance or Ops drives most requests, Sigma lines up well with that workflow. It feels natural for teams that move fast and need short-turn analysis without a lot of setup.
If recurring KPIs need to match across departments - revenue reporting in Finance, pipeline in Sales, spend in Marketing - Omni is the better match. Its dbt-connected, Git-versioned semantic layer is built for shared metric logic and tighter control. That setup still isn't common across the market: governed semantic layers appear in 26 of 58 analyzed tools, or 45% [1].
Use the matrix below to match your team's workflow with the right operating model.
| Team situation | Better fit |
|---|---|
| Analysts are spreadsheet-native; Finance/Ops drives most requests | Sigma |
| Metric definitions already live in dbt; governance is a priority | Omni |
| Teams need consistent answers across Sales, Finance, and Marketing | Omni |
| Short, one-off analysis | Sigma |
That's the practical split: speed and spreadsheet familiarity on one side, governed reuse and consistency on the other.
For Snowflake, BigQuery, and Redshift teams, the main question is simple: who owns metric logic, and how often does it need to stay the same across teams? If speed matters most, spreadsheet BI is often the faster route. If the same metric keeps needing reconciliation across departments - whether that's MRR in revenue reporting, attribution in marketing performance, or adjustments in finance reconciliation - semantic BI is the better fit.
The FAQ below covers common edge cases and team-fit questions.