Business Intelligence
How to go from Postgres to self-serve BI in a week without Tableau
Turn Postgres into live, self-serve BI in a week with an AI-powered semantic layer, natural-language notebooks, governed dashboards, and security.
If you're tired of expensive BI tools like Tableau and the constant need for technical support, here's a faster, simpler solution: Querio. In just one week, you can turn your Postgres database into a self-serve BI platform without relying on exports, proprietary clouds, or vendor lock-in. Querio uses AI to let anyone in your team ask questions in plain English and get live, actionable insights directly from your database. Here's how:
Set up your Postgres database: Create a secure, read-only environment with proper schema organization and performance optimizations.
Connect Querio: Build a context layer with consistent business metrics and joins, ensuring clarity and accuracy across your team.
Use AI-powered notebooks: Ask natural language questions, refine queries, and collaborate easily without writing SQL.
Create dashboards and reports: Automate updates, embed dashboards, and set up alerts for real-time insights.
Govern and roll out: Implement role-based access, test accuracy, and train your team for smooth adoption.
Querio eliminates the need for ETL pipelines, keeps your data live, and reduces dependency on engineers. By the end of the week, your team will have a reliable BI system that’s secure, scalable, and easy to use.
Step 1: Prepare Your Postgres Database
Set up a secure, well-structured Postgres environment to safeguard your production systems and enable reliable business intelligence (BI) workflows.
Check Database and Schema Setup
Always connect to a dedicated analytics environment or a read-only replica to ensure production performance remains unaffected [3].
Keep your schema tidy and consistent by using standardized naming conventions. If you frequently join multiple tables, consider using materialized views for moderate data volumes. These pre-computed views enhance query performance without adding extra infrastructure [3].
Create Read-Only Credentials
Security is key. Set up a dedicated read-only user specifically for Querio. This approach restricts access to only the data required for analytics.
Use the following SQL script to create secure credentials:
The ALTER DEFAULT PRIVILEGES command ensures that new tables automatically grant read access [1]. To prevent long-running queries from consuming resources, set a statement timeout:
Test Your Sample Data
Run tests on a representative dataset to verify clear column names, correct data types, and properly defined relationships. This avoids confusion and ensures smoother analytics.
For frequently queried columns, add indexes to maintain responsiveness in BI tools. If you're working with a production replica, make sure metadata sync is enabled so Querio can detect schema changes automatically [4].
Once your Postgres setup is ready, you can move on to connecting Querio and building your context layer.
Step 2: Connect Querio to Postgres and Build Your Context Layer
Once your Postgres database is ready, it’s time to connect Querio and set up a semantic layer. This ensures everyone in your organization works with consistent definitions and metrics.
Set Up the Postgres Connection
In Querio, choose PostgreSQL as your data source. Then, input the necessary details: hostname, port (usually 5432), database name, and the read-only username you created earlier. Querio automatically encrypts connections for security.
Before saving, test the connection to make sure everything is working properly.
Define Joins, Metrics, and Business Terms
The context layer is where Querio shines. Start by setting up shared table joins in this layer. Define relationships like primary and foreign keys, and document how your tables connect.
Next, create standardized business metrics. For example, define terms like "Monthly Recurring Revenue" or "Customer Lifetime Value" using SQL expressions that can be reused by everyone. Add plain-English descriptions for these metrics so that even non-technical team members can easily understand what they’re analyzing. This step helps eliminate confusion, such as differing interpretations of revenue, across your organization.
Test Query Speed
Run a few sample queries to check performance. Ideally, dashboards should load within 5–10 seconds. If you notice delays, review your query patterns and optimize access to frequently used data.
To prevent runaway queries from overloading resources, set a statement timeout (e.g., 30 seconds) [1][2]. Once performance is confirmed, you're ready to move on to creating AI-powered analysis notebooks that outperform traditional BI.
Step 3: Build AI-Powered Notebooks for Analysis
With your Postgres connection set up and the context layer ready, it's time to dive into data analysis. Querio's notebooks make this process seamless by letting you ask questions in plain English, which are then converted into SQL and Python code for your review.
Query Data Using Plain English
Forget about writing SQL from scratch. Just type in a question like, "What were our top 10 customers by revenue last quarter?" Querio's AI agent takes your plain English input, converts it into SQL, runs the query against your Postgres database, and displays the results. Plus, the generated SQL code is shown alongside the output, so you can see exactly what was executed and confirm it aligns with your intent.
If the results aren't quite what you need, you can refine your question or manually adjust the SQL to fit specific database constraints. Detailed metadata helps the AI improve its accuracy, ensuring your queries are both efficient and precise. This approach not only simplifies querying but also lays the groundwork for collaborative analysis in the next phase.
Refine and Share Notebooks with Your Team
Once you have auto-generated queries, you can refine them further and collaborate with your team. Querio's notebooks are reactive, meaning they’re perfect for group analysis. Team members can add their own questions, build on existing queries, and fine-tune insights together - all without duplicating efforts.
For smoother sharing, handle complex joins and heavy transformations upstream to ensure faster and more accurate analyses [5]. When your notebook is ready and packed with insights, share it across your organization. This ensures everyone works from a single, reliable source of truth. By using these collaborative and reactive notebooks, you'll speed up the process of making business intelligence accessible to everyone.
Step 4: Create Dashboards and Automate Reports
Once your analysis is polished, the next step is to transform those insights into dashboards and automated reports. These tools ensure your team has continuous access to up-to-date, actionable data.
Build Live Dashboards for Key Metrics
Turn your notebook queries into interactive dashboards that refresh automatically. This way, your team always has access to the latest data without manual updates. Focus on critical metrics like revenue patterns, customer acquisition costs, or inventory levels. By using the shared context layer you set up earlier, your charts and tables remain consistent and trustworthy across the board.
Schedule Automated Reports
Set up recurring schedules to deliver fresh data directly to your team via email or Slack. Querio’s integrated alerting system makes it easy to configure email delivery through SMTP or push updates using Slack webhooks. This approach allows you to create specific notification channels and cut down on redundant alerts. Be sure to send a test notification to confirm everything is working properly[7]. If you need real-time updates, consider using Change Data Capture (CDC) instead of traditional batch ETL processes. CDC updates data in seconds, making it a faster option compared to methods that might take hours or even days[6].
Share and Embed Dashboards
Distribute dashboards securely or embed them into other tools your team uses. Querio supports two embedded self-serve analytics options:
Iframe embedding: This is a quick solution where you paste a code snippet to display the dashboard. While it’s fast and simple, customization options are limited.
API/SDK embedding: This provides full control over the dashboard’s appearance, layout, and branding, creating a seamless, native experience within your application.
Choose iframe embedding for a speedy setup, or go with API/SDK embedding if you need a fully tailored solution. Both options ensure your team can easily access the insights they need.
Step 5: Test, Govern, and Roll Out
Before launching your BI system, make sure it's secure, accurate, and ready for production. This step ensures the data is reliable and the system can handle real-world demands without breaking or slowing down.
Verify Accuracy and Set Up Governance
Start by validating the SQL logic behind your dashboards. For complex reports, double-check that JOINs and aggregations are working as intended [1][8]. Also, ensure that dashboard filters, such as date ranges, apply correctly across all charts without causing "No data" errors due to overly restrictive settings [2].
Next, establish role-based access control (RBAC) to clearly define roles like Admin, Member, Contributor, and Viewer. Stick to the principle of least privilege by granting users only the access they need [10]. For added security, implement row-level security (RLS) so users only see data relevant to their department or role [10]. Use a read-only user to prevent accidental data changes, and set query timeouts (e.g., 30 seconds) at the database user level to prevent runaway queries from overloading resources [1].
"Data governance serves as the foundation of self-service analytics." - Dundas Data Visualization [11]
Once you've confirmed data integrity and access controls, move on to creating a rollout checklist.
Create a Rollout Checklist
A detailed checklist will help streamline the onboarding process. Start by confirming system health - ensure containers are running smoothly, health endpoints return HTTP 200, and dashboard queries consistently perform in under 3 seconds [12][8]. Direct your BI tool to a read-only replica instead of the primary database to avoid affecting application performance [1]. Test RLS policies thoroughly to confirm that data isn't leaking between departments [12]. Finally, conduct user walk-throughs and provide basic training to help employees use the system effectively and interpret insights correctly [9][11].
Once onboarding is complete, focus on monitoring and improving the system to keep it running smoothly.
Monitor and Improve After Launch
After the system goes live, set up automated health checks using API endpoints like /api/health to track service status [8]. Create alerts for stale data - such as data that hasn't been refreshed within twice the expected interval - and watch for anomalies in row counts or refresh failures [12]. Continuously monitor query performance, and index columns frequently used in WHERE clauses or JOIN operations if needed [2][1]. Keep an eye on usage trends to optimize resources and catch compliance issues early [9][10].
Consistent monitoring and adjustments will ensure your BI system remains efficient and reliable.
Why Querio Works Best for Postgres BI
Querio vs Traditional BI Tools: Feature Comparison
Querio simplifies Postgres BI in ways that traditional tools just can't match. After setup, it transforms how analytics operate by directly connecting to your live Postgres database. Forget the weeks-long process of configuring traditional BI tools - Querio eliminates the need for ETL pipelines, data extracts, and duplicates. This approach ensures that your data remains current, serving as a single, reliable source of truth.
One standout feature is Querio's AI-driven natural language interface. Users can ask straightforward questions, and the platform translates them into inspectable SQL or Python code. This means every query is fully transparent and auditable, bridging the gap between technical teams and business users by providing clarity and trust in the data.
Querio also introduces a governed context layer, where joins, metrics, and business terms are defined once and applied consistently across all queries, dashboards, and embedded analytics. On top of that, it prioritizes data security with SOC 2 Type II certification, a 99.9% uptime SLA, AES-256 encryption at rest, and support for row-level security (RLS). These features ensure compliance and protect sensitive information.
"The best self-service environments do not remove the data team. They change its job from answering every question to building a system where good questions can be answered safely by many people." - Querio Editorial [13]
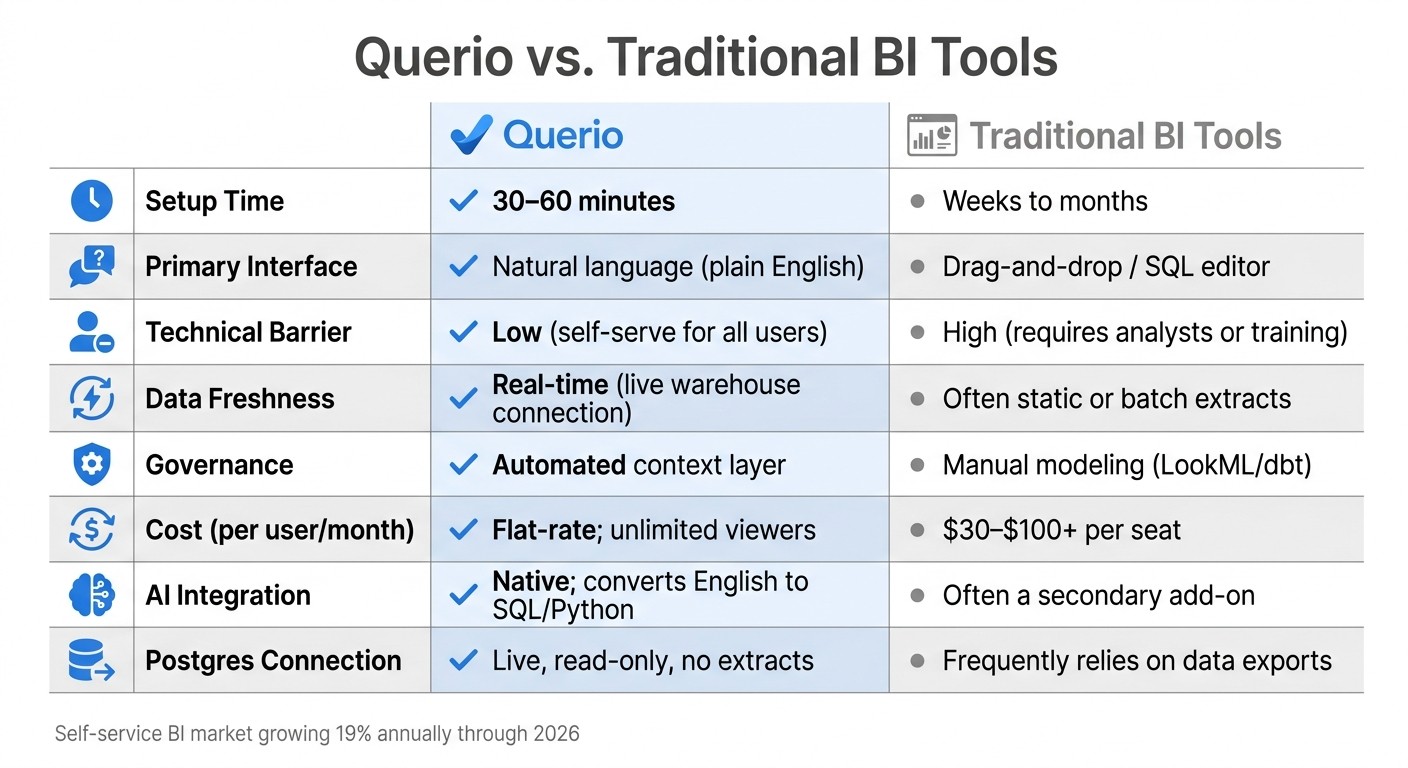
Querio vs. Traditional BI Tools
Here's a quick comparison to illustrate how Querio stacks up against traditional BI tools:
Feature | Querio | Traditional BI Tools |
|---|---|---|
Setup Time | 30–60 minutes | Weeks to months |
Primary Interface | Natural language (plain English) | Drag-and-drop / SQL editor |
Technical Barrier | Low (self-serve for all users) | High (requires analysts or training) |
Data Freshness | Real-time (live warehouse connection) | Often static or batch extracts |
Governance | Automated context layer | Manual modeling (LookML/dbt) |
Cost (per user/month) | Flat-rate; unlimited viewers | $30–$100+ per seat |
AI Integration | Native; converts English to SQL/Python | Often a secondary add-on |
Postgres Connection | Live, read-only, no extracts | Frequently relies on data exports |
As the self-service BI market grows by nearly 19% annually through 2026, governance remains a significant hurdle for many companies, with only about one-third reporting successful initiatives [13]. Querio tackles this challenge by centralizing business logic and delivering AI-generated insights that are both accurate and auditable. And with deployment taking less than an hour, it’s clear why Querio is a game-changer for Postgres BI.
Conclusion
Creating a self-serve BI solution from Postgres in just one week is entirely doable. By directly connecting Querio to your database, setting up a governed context layer, and using AI-powered natural language queries, you can sidestep the usual delays of traditional BI systems. What typically takes months can be accomplished in days, transforming complex SQL into simple, everyday language. This streamlined process delivers actionable insights almost immediately.
One of the standout advantages is live querying directly from your data warehouse. This eliminates the need for data extracts, outdated dashboards, and expensive software licenses. Your team gains instant access to real-time insights, allowing engineers to focus on more impactful tasks instead of repetitive query requests. In fact, self-service BI tools can cut report generation time by up to 80%, shifting the focus to strategic priorities.
Governance plays a key role in maintaining both speed and accuracy. With safeguards in place, your production database remains secure, and data integrity is preserved. Plus, every AI-generated query is transparent and verifiable, giving users confidence in the results.
The warehouse-native approach ensures your analytics grow alongside your data. As your Postgres database expands, Querio adapts - no need for data duplication, complex ETL pipelines, or performance hits to your production systems. This scalability makes real-time analytics accessible without adding unnecessary complexity.
Ready to break free from traditional BI limitations? With a proven one-week plan, you can empower your team with trusted, real-time analytics. Start by preparing a clean database, connect Querio in less than an hour, define your context layer, and deploy AI-driven notebooks and dashboards that inspire action.
FAQs
Will live querying slow down my production Postgres?
Live querying can put a strain on your production Postgres database, especially if the queries are frequent or involve complex operations. The impact largely depends on how busy your database is and how well the queries are optimized. To avoid potential slowdowns, consider strategies like caching frequently accessed data, optimizing your queries for efficiency, and allocating resources properly. With a well-thought-out setup, you can keep performance issues to a minimum and maintain seamless real-time analytics.
How do I ensure the AI uses the right metric definitions?
To make sure AI relies on accurate and consistent metric definitions, leverage self-service BI tools like Querio. These tools allow you to analyze data directly from PostgreSQL and create dashboards that align with standardized metrics. Additionally, incorporating governance features like role-based access control (RBAC) and row-level security (RLS) ensures uniform data usage across different teams. This approach supports reliable AI-driven insights by maintaining consistency in data interpretation.
What security controls can I enforce for different teams?
You can manage security controls for teams effectively by implementing role-based access control (RBAC) and dataset permissions within your BI platform. Tools like RBAC and Row-Level Security (RLS) help you limit data access according to specific user roles. On top of that, permissions management allows for precise control over who can view or interact with dashboards and data sources. This ensures that each team gets the data visibility they need while maintaining compliance and protecting sensitive information.
Related Blog Posts


