Business Intelligence
Snowflake + AI BI: How to set up self-serve analytics without hiring a data team
Self-serve analytics with Snowflake and AI BI lets teams run live, governed SQL queries for fast insights—no dedicated data team needed.
Tired of waiting weeks for data insights? Businesses often face delays caused by overloaded data teams and a lack of skilled analysts. But there's a solution: combining Snowflake's scalable data warehouse with Querio's AI-powered analytics tool. This setup allows teams to access live data instantly, using plain English queries - no coding or extra hires required.
Key Takeaways:
Faster Insights: Self-serve analytics deliver answers 5x faster, cutting data request backlogs.
Cost-Effective: Save on hiring costs (analyst salaries often exceed $150,000/year).
Consistent Metrics: Querio ensures all teams use the same business logic and definitions.
Secure Access:Role-based permissions, dynamic masking, and audit logs keep your data safe.
With Snowflake handling infrastructure and Querio simplifying data access, decision-making becomes real-time and efficient. Here's how to set it up.
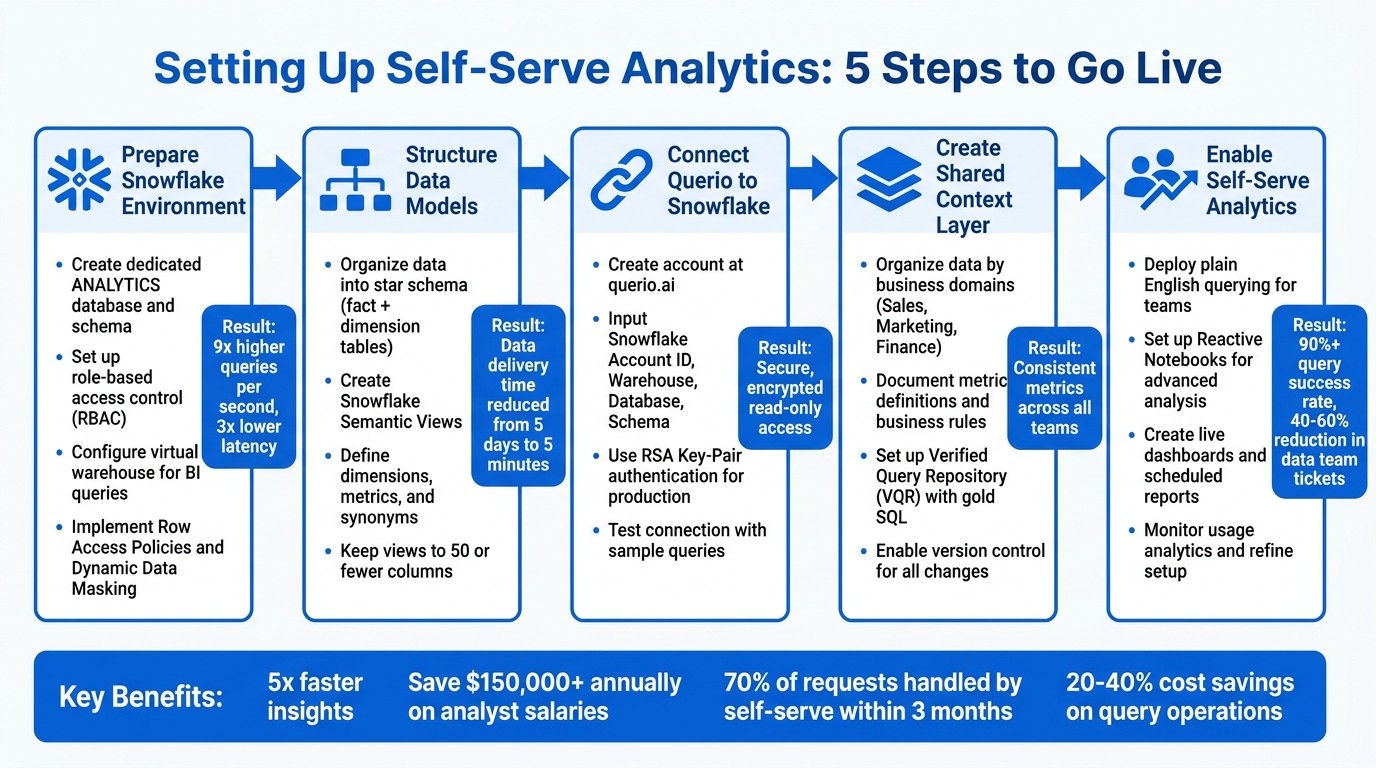
5-Step Setup Guide for Snowflake and Querio Self-Serve Analytics
Cortex Analyst Paves The Way For Reliable, Self-Serve Analytics
Preparing Your Snowflake Environment
Before connecting Querio, it's crucial to set up Snowflake for secure and efficient self-serve analytics. This involves configuring access controls, organizing data, and ensuring a scalable foundation. By doing so, you can fully leverage Snowflake's capabilities.
Setting Up Read-Only Access and Data Governance
Start by creating a dedicated database and schema, such as ANALYTICS, specifically for analytical workloads. Implement role-based access control (RBAC) using the least-privilege principle. For instance, you can create roles like BI_ANALYST_GLOBAL or BI_ANALYST_REGIONAL and grant them USAGE permissions on the warehouse, database, and schema. Additionally, provide SELECT privileges on the specific tables or views they need [5]. This approach ensures your teams have secure and efficient access to the data they require.
Set up a virtual warehouse exclusively for BI queries. This separation prevents performance issues - so, for example, a complex query from marketing won't disrupt your data pipeline. Snowflake Interactive Analytics has demonstrated impressive results with 9x higher queries per second and 3x lower latency under a 200-concurrent-user load compared to standard warehouses [6].
For sensitive data, use Row Access Policies to filter results at query time based on user roles. A regional sales analyst, for example, could be restricted to viewing transactions only from their assigned territory. Protect sensitive columns, such as those containing personally identifiable information (PII), with Dynamic Data Masking. Tag-based masking is particularly effective - when you attach masking policies to tags like PII or data_sensitivity = 'high', any new column with those tags automatically inherits the protection [3][8][10].
To simplify ongoing access management, use future grants. Applying GRANT SELECT ON FUTURE TABLES in your analytics schema means BI roles automatically gain access to new data models without manual updates [5]. For example, in early 2026, NYC Health + Hospitals used Snowflake Horizon Catalog to manage membership and claims data, cutting their data delivery time from five days to five minutes [7].
Structuring Data Models and Defining Metrics
Organize your data into star and snowflake schemas to improve performance and make it intuitive for business users. In this structure, fact tables hold measurable events like sales transactions (many rows, few columns), while dimension tables store descriptive attributes like product categories or customer details (fewer rows, many columns) [5].
Leverage Snowflake Semantic Views to define business logic, metrics, and relationships directly in the database. As Chanin Nantasenamat, Developer Advocate at Snowflake, puts it:
A semantic view acts as a translator between your raw data and how humans or AI interpret it [2].
In these views, define dimensions (e.g., Product Category or Region) and metrics (e.g., Total Sales or Monthly Recurring Revenue). Adding synonyms - like equating "revenue", "total sales", and "sales amount" - helps Querio’s natural language engine interpret queries more effectively. Include descriptions and sample values to provide additional context [9]. This structure ensures consistent metrics and quick, accurate responses to plain English queries.
For optimal performance, keep semantic views streamlined - 50 or fewer columns is ideal. Assign primary keys to logical tables within the semantic view to ensure proper joins and avoid duplicate results. Use Dynamic Tables to automate data transformations, keeping analytics models up-to-date without the need for manual scheduling [5][4]. When loading large tables for the first time, temporarily scale up your virtual warehouse to 2X-LARGE to speed up the process, then scale back down once the setup is complete [5]. These steps lay the groundwork for seamlessly connecting Querio.
Connecting Querio to Snowflake
Once your Snowflake environment is set up, the next step is linking Querio for real-time analytics. Querio connects seamlessly to Snowflake, using a read-only service account with encrypted credentials to ensure your data remains within Snowflake. Before starting, make sure you have the following ready: Snowflake Account ID, Warehouse Name, Database, and Schema. These details are essential for setting up the connection.
Setting Up Your Querio Account and Snowflake Connection
To begin, create an account at querio.ai, log in, and navigate to the data sources section. Choose Snowflake as your source and input the required connection details: your account identifier, warehouse, database, schema, and the service account credentials.
For production environments, it’s recommended to use RSA Key-Pair authentication (either 2048-bit or 4096-bit) for added security. If your Snowflake instance is behind a firewall, you’ll need to whitelist Querio's production IP addresses to establish the connection.
Querio securely encrypts and stores your credentials using a credential management system. Once all parameters are entered, click on 'Test Connection' to confirm that Querio can communicate with your Snowflake instance.
Running Test Queries to Verify the Connection
After setting up the connection, it’s time to ensure everything is working as expected by running test queries. Start with straightforward queries like: "Show me all tables in my database" or "How many records are in my customers table?" These queries help confirm that Querio can access metadata and understand your database structure.
Next, move on to queries that interact with actual data. For example, you can try: "What is the total revenue for the last month?" or "List the top 10 customers by purchase volume." Querio will display the auto-generate SQL code for each question, giving you the chance to review the logic behind the queries.
To ensure accuracy, compare the results with known values from Snowflake. Verify that joins are correctly constructed, WHERE clauses align with your intent, and that data governance rules - like masked columns or row-level filters - are respected. This step ensures Querio interprets your schema correctly and applies your semantic layer definitions consistently.
Creating a Shared Context Layer in Querio
Once your Snowflake connection is set up, the next step is to define a shared context layer in Querio. This layer plays a crucial role in ensuring consistent data usage across all queries. By standardizing metric definitions, business rules, and table relationships, this shared layer ensures that everyone - whether they're working with AI-driven queries, dashboards, or notebook analyses - uses the same definitions. To maintain this consistency, you’ll also need to configure these definitions and manage them through version control.
Setting Up Metrics and Business Rules
The key to organizing your data lies in structuring it according to business domains such as Sales, Marketing, Customer Support, or Finance. This approach matches how teams actually view and use data, rather than how it’s stored in Snowflake [12]. For instance, instead of categorizing by table names like fact_transactions or dim_customers, you could create a Sales domain that includes metrics such as "Monthly Recurring Revenue" or "Customer Lifetime Value."
Every table and column should come with clear, detailed descriptions. This step ensures that AI can correctly interpret company-specific terms [12]. For example, if your company defines an "active customer" as someone who made a purchase within the last 90 days, document that explicitly. Similarly, if your fiscal year starts on February 1st instead of January 1st, include this detail in your SQL generation rules [12].
To handle complex logic, leverage Querio’s Verified Query Repository (VQR). This repository houses pre-approved SQL examples, often referred to as "gold SQL", which help the AI accurately handle intricate business logic [11][12]. For example, if your revenue calculation involves specific exclusions or your churn metric requires multi-step logic, include these queries in the VQR. This setup empowers teams to perform AI-driven self-serve analytics while reducing their dependency on data teams for routine metric definitions.
Using Version Control for Consistent Logic
Querio automatically versions every change made to metrics or business rules, creating a detailed audit trail. This feature tracks who made changes, what was altered, and when it happened, offering full transparency into the evolution of your definitions [13]. If a metric starts producing unexpected results, you can quickly review the version history and revert to a previous version if needed [13].
Version control also eliminates the risk of manual UI drift across different environments. When promoting changes from development to production, Querio ensures definitions remain synchronized without requiring manual updates in multiple locations [13]. This process allows for safe testing and smooth transitions, minimizing errors caused by copy-pasting definitions.
Enabling Self-Serve Analytics for Your Teams
Once your context layer is in place, you can empower your teams with governed self-serve analytics, giving them the ability to query live Snowflake data instantly - no coding or waiting required. This approach allows non-technical users to uncover insights on their own while maintaining accuracy and clarity.
Querying Data with Plain English Questions
With Querio, users can log in, choose the Snowflake data source, and simply ask questions in everyday language. For instance, they might ask, "What were sales by region last quarter?" or "Show me the top 10 customers by revenue in Q1 2026." Querio’s AI takes these plain English queries, converts them into accurate SQL commands, and runs them live on Snowflake. The results? Visualized data paired with the underlying SQL for complete transparency [1][14].
For example, if someone asks, "What is the average order value by state?" Querio applies your specific revenue logic, presenting a map visualization filtered by U.S. states with dollar amounts formatted in standard U.S. currency (e.g., $1,234.89) [1][14].
Using Reactive Notebooks for Advanced Analysis
Querio's Reactive Notebooks make it easy to refine and expand natural language queries without writing a single line of code. A user might start with, "Plot monthly sales trends for 2025", then add a region filter, and follow up with, "Calculate YoY growth and forecast Q2 2026" [1]. Each refinement triggers a live query on Snowflake, automatically updating the visualizations in real time - no manual refreshes needed.
Unlike traditional notebooks, which often require manual SQL coding and static data, Reactive Notebooks generate AI-driven queries using your context layer. They also continuously refresh data with every interaction, removing the need for separate ETL pipelines [14]. This makes it possible to perform advanced tasks like cohort analysis or what-if scenario planning using intuitive drag-and-drop tools and parameter binding, all while staying aligned with your governed business logic [14].
Tracking Usage and Refining Your Setup
Querio’s Usage Analytics dashboard provides actionable insights into how teams are using the data. For example, you might notice that 25 users run the query "sales by region" 150 times a week or that 40% of all queries focus on customer churn metrics [1]. These patterns can help you fine-tune metrics and adjust your business rules.
Organizations have reported impressive results: over 90% query success rates, with self-serve analytics handling 70% of requests within three months. This shift has also reduced data team tickets by 40–60% [1]. Additionally, by monitoring live query costs through integrated reports, teams often see savings of 20–40% as ad hoc requests decrease [1].
Building Dashboards and Reports
When your team has mastered querying data, the next step is transforming those insights into actionable dashboards and reports. Querio simplifies this by connecting directly to Snowflake, ensuring your analytics stay live - no outdated exports or static data.
Creating Dashboards with Live Snowflake Data
To start, log into Querio, head to the Dashboards section, and click New Dashboard. Select your Snowflake connection, then drag and drop essential metrics - like revenue by region or customer engagement KPIs - onto the canvas. Querio automatically generates visualizations, such as bar charts, line graphs, or heatmaps, by running live queries on Snowflake data [1][14].
Keep your dashboards concise by focusing on 4–6 key metrics and using a consistent color scheme, like blue for positive trends. Add helpful tooltips to explain metrics using definitions from your shared context layer. Enable dynamic filters to allow slicing by date ranges or regions. For example, a sales dashboard could show quarterly revenue with the option to drill down by state or product category.
Setting Up Scheduled Reports
Navigate to the Reports tab and click New Scheduled Report. Link it to an existing dashboard or create a custom Snowflake query. Set the delivery frequency - daily at 9:00 AM EST, weekly on Mondays, or monthly on the 1st - and choose the format, such as PDF or interactive HTML. Reports can be sent via email, Slack integrations, or shared folders in tools like Google Drive, with role-based access [1][14].
Scheduled reports respect Snowflake's row-level security, ensuring users only see data they’re authorized to access. Additional features include audit logs to track views and downloads, PDF watermarking, and expiration dates on shared reports - all compliant with SOC 2 standards.
With these dashboards and reports in place, you can take things further by embedding analytics directly into your applications.
Embedding Analytics in Other Applications
Querio makes it easy to integrate live dashboards into your applications using its APIs. Start by generating an API key in your account settings. Then, use endpoints like /embed/dashboard/{id} with JWT tokens to securely embed dashboards. For example, you could embed a live revenue dashboard in Salesforce by adding an iframe like this:
You can pass Snowflake filters through URL parameters, such as ?region=US.
For custom applications built with frameworks like React, leverage the Query API by sending a POST request to /api/query with JSON payloads like:
{"metrics": ["total_sales"], "filters": {"date": "01/01/2025 to 12/31/2025"}}
This retrieves real-time results from Snowflake. For instance, a mid-sized U.S. e-commerce company reduced reporting time by 80% by embedding Querio dashboards into their Shopify admin. This allowed them to monitor live inventory data, enabling real-time stock alerts and reducing overstock by 25% [1][14].
iFrame embedding is simpler to implement but may load more slowly and offer limited customization. On the other hand, JavaScript SDKs provide faster performance, full customization capabilities, and a seamless user experience, integrating directly with your app's authentication for smoother workflows.
Conclusion
Creating a self-serve analytics system with Snowflake and Querio removes the need for a dedicated data team and lengthy implementation processes. The key steps include configuring Snowflake, connecting Querio, and standardizing metrics and business logic to enable team-led data exploration. Once these foundations are in place, you can roll out dashboards, schedule automated reports, and embed analytics directly into your applications.
This approach offers a fast and cost-effective way to gain insights. With scalable performance, AI-powered query generation that delivers accurate SQL in seconds, and strong governance, growing companies can embrace data-driven decision-making across all departments - without spending over $500,000 annually on a team of data specialists.
FAQs
What do I need to set up in Snowflake before connecting Querio?
Before linking Querio, it's essential to set up a dedicated service user with the right permissions and a least-privilege role. Start by creating the service user with the USERADMIN role. Then, assign the necessary grants, such as usage permissions for the warehouse, database, and schema, as well as select privileges for the relevant tables. To ensure secure authentication, associate an RSA public key with the service user.
How do I make sure everyone uses the same definitions for metrics like revenue?
To keep metrics like revenue consistent across your organization, it's essential to establish a clear semantic layer within your analytics framework. Using a Snowflake semantic view can serve as that central source of truth, ensuring metric definitions are standardized for everyone.
On top of that, implement role-based access controls and leverage data governance tools to maintain clarity and security. Providing training sessions, along with pre-built templates or dashboards, can also help users interpret and work with data in a uniform way.
How can I keep data secure while enabling self-serve analytics?
To keep data safe in self-serve analytics, Snowflake offers several useful tools. Features like role-based access controls, data masking, and automated compliance checks help ensure that sensitive information is only accessible to authorized users.
On top of that, it's important to implement strong data governance policies and actively monitor data quality. This not only maintains data integrity but also ensures compliance, protecting sensitive information even when users are exploring data independently.
Related Blog Posts


