Business Intelligence
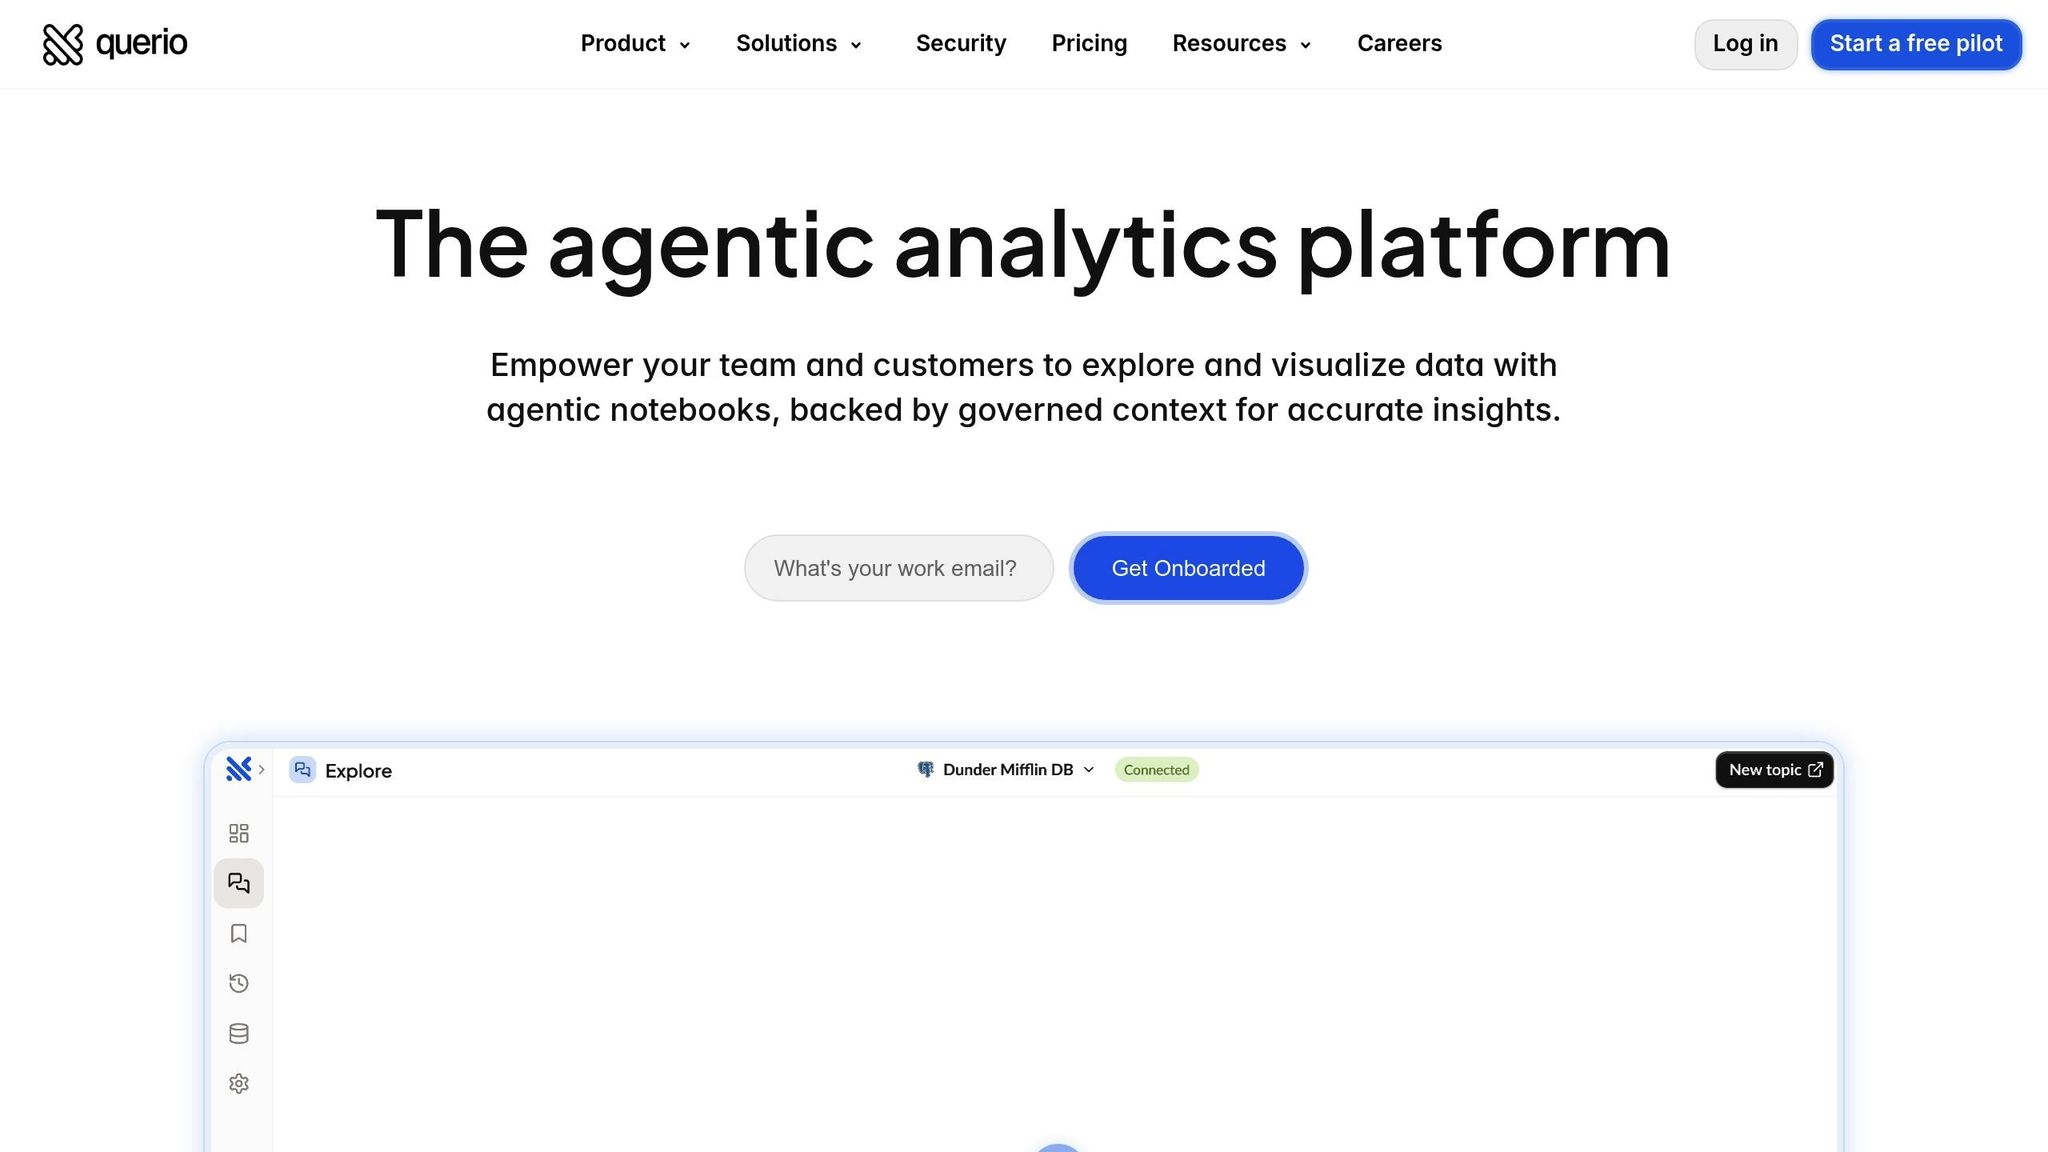
The Future of Customer-Facing Analytics
Embedded AI analytics deliver real-time, role-specific dashboards inside customer apps, boosting engagement, security, and monetization without heavy engineering.
Customer-facing analytics integrate dashboards and visualizations directly into customer applications, enabling users to make informed decisions without relying on internal teams. Unlike traditional BI tools, these analytics focus on user empowerment by providing real-time, role-specific insights through intuitive interfaces. AI-driven tools like Querio allow users to ask questions in plain English, delivering instant, actionable insights while maintaining strict data security through features like multi-tenant isolation and SOC 2 compliance.
Key Points:
What It Is: Embedded analytics that helps customers access data insights within the apps they already use.
Why It Matters: Boosts user engagement, reduces churn, and allows companies to charge premium prices for analytics features.
How It Works: Combines AI, real-time data, and secure architecture to deliver fast, personalized dashboards.
Trends:
Natural language queries for easy access.
Embedded dashboards for seamless integration.
Role-specific insights tailored to different users.
Querio leads the charge by offering an AI-native platform with live data connections, white-label analytics options, and scalable pricing starting at $14,000/year. It’s a practical solution for SaaS, fintech, and e-commerce companies aiming to enhance customer experiences while reducing engineering overhead.
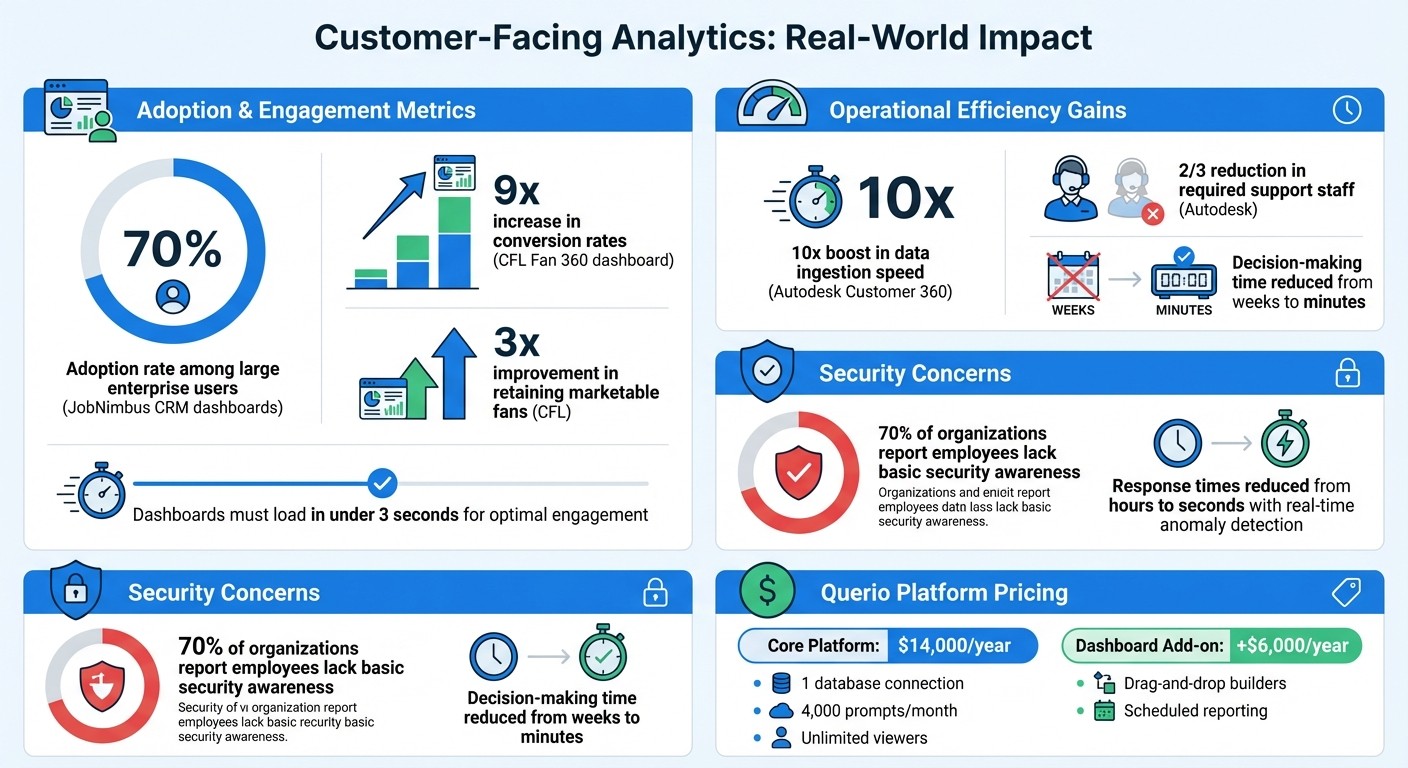
Customer-Facing Analytics Impact: Key Statistics and ROI Metrics
3 Trends Shaping Customer-Facing Analytics
Natural Language Queries for Easier Data Access
Imagine typing a question like, "What were our top revenue sources last quarter?" and instantly seeing a clear, visual answer - no coding required. That’s the power of natural language querying (NLQ) tools. By removing the need for technical skills, NLQ makes analytics accessible to everyone, not just data specialists. Marketing managers, finance directors, and operations teams can now explore data directly without waiting on analysts to create custom reports.
With NLQ, decision-making becomes faster and more collaborative. Users can ask follow-up questions like, "Can you break that down by region?" and receive immediate insights. Tools like Querio’s AI-powered query engine handle the heavy lifting behind the scenes, translating plain English into SQL or Python and pulling data directly from your warehouse - all while respecting the governance rules set by your data team. This seamless interaction brings analytics into everyday workflows, empowering teams to make smarter decisions, faster.
Embedded Analytics Inside Your Applications
What if analytics felt like a natural part of the tools you already use? Embedded analytics makes this possible by integrating insights directly into customer-facing applications using embedded analytics tools. Instead of juggling multiple platforms or exporting data, users can access the information they need right where they are.
Take JobNimbus, for example. In June 2025, they introduced interactive dashboards to their construction CRM, offering contractors real-time insights into job completion and productivity. The results? 70% adoption among large enterprise users and a noticeable drop in customer churn. By keeping data within the platform contractors already relied on, JobNimbus made analytics an indispensable part of their daily operations.
Querio offers a similar experience through live dashboards that connect directly to your data warehouse. No data replication is required, and with white-labeling options, the dashboards blend seamlessly into your application’s design. Speed is critical here - dashboards that load in under three seconds keep users engaged, while slower ones risk being ignored.
Personalized Dashboards for Different Users
Not all users need the same data. A CFO might focus on cash flow and profit margins, while a sales manager looks at pipeline metrics. Personalized dashboards cater to these unique needs, tailoring insights based on roles, behavior, and even the size of the business.
To achieve this level of customization, platforms rely on multi-tenant architecture that isolates data securely for each user. Querio’s semantic layer ensures consistency, so everyone sees accurate metrics while maintaining strict data privacy. Business logic, joins, and metrics are defined once, and the platform handles the rest, automatically applying the rules across dashboards and queries.
The future of analytics is even more proactive. AI-driven systems now monitor data in real time, flagging anomalies, highlighting trends, and even suggesting actions. This shift from static reporting to active analytics transforms dashboards into decision-making tools. SaaS companies are already monetizing this trend by offering tiered analytics - basic dashboards for standard users and advanced, self-service options for premium customers. This not only enhances user experience but also turns analytics into a revenue stream.
How to Build Real-Time Customer Dashboards
Setting Up Live Data Connections
Real-time dashboards depend on live connections to data warehouses, which help avoid duplication and ensure information stays current. By using tools like native schema objects and a semantic layer for SaaS via Snowflake Semantic Views, governance rules remain within the database, allowing the system to interpret business logic without needing to move data around.
Advanced query routing plays a big role here. It starts by using the semantic layer to handle queries, only falling back to the base schema when absolutely necessary. This approach improves both accuracy and flexibility. Once you've got these strong data connections in place, the next step is designing dashboards that are intuitive and tailored to specific roles.
Dashboard Design Best Practices
After establishing live data connections, the focus shifts to design - turning raw data into actionable insights. The best dashboards are easy to navigate from the get-go. Personalization by role ensures users see what matters most to them: finance teams track cash flow, sales managers monitor pipelines, and executives focus on high-level KPIs. This isn't just about filtering data but creating an experience that aligns with how each team operates.
A great example is the Canadian Football League (CFL), which in 2025 developed a Fan 360 dashboard using Snowflake. This dashboard unified over 120 data points per fan, leading to a 9x increase in conversion rates and a 3x improvement in retaining marketable fans [1].
Adding conversational exploration takes dashboards to the next level. Users can ask follow-up questions like “What are the trends by region?” directly within the dashboard. Features like guided analytics - tooltips, suggested queries, and contextual help - make it easier for users to explore data, even if they’re not experts. It’s as seamless as browsing a website.
Speed and Accessibility Requirements
A dashboard’s design is only as good as its performance and accessibility. To keep users engaged, dashboards need to load quickly and be universally accessible. This involves optimizing queries, caching commonly accessed data, and handling peak traffic without a hitch.
Responsive design is another must-have, ensuring dashboards work across devices - be it desktops, tablets, or smartphones. Accessibility features, like proper color contrast, keyboard navigation, and screen reader compatibility, make sure everyone can use the dashboard, including those with disabilities.
For example, Autodesk transformed its Customer 360 analytics platform with Snowflake's AI Data Cloud, achieving a 10x boost in data ingestion speed. This upgrade enabled self-service analytics across the company and cut the required support staff by two-thirds. The result? A scalable platform that not only met growing demands but gave Autodesk a competitive edge [2].
Security and Compliance for Customer Analytics
Read-Only Access and Encrypted Connections
Keeping your analytics dashboard secure is non-negotiable. One way to achieve this is through read-only connections, which prevent any accidental or intentional changes to your data. By directly linking to your data warehouse using encrypted credentials, you eliminate the need for data duplication, reducing potential security risks.
Data encryption plays a key role here - whether at rest (using AES-256) or during transmission (via HTTPS/TLS 1.3). Additional safeguards like SSH tunneling and IP whitelisting add extra layers of protection.
"At Querio, we believe that trust is crucial for strong partnerships. When it comes to security and data privacy, we are unwavering in our dedication."
Querio Security Overview
For industries like SaaS and fintech, tenant isolation is critical. Separating projects and catalogs ensures that one customer’s data remains completely invisible to others. This setup, paired with frequent vulnerability checks and web-based scanning, helps identify and address security gaps early. Together, these practices support compliance with industry standards.
Meeting SOC 2 and Compliance Standards
Achieving SOC 2 Type II certification proves that your systems meet rigorous standards for security, availability, and confidentiality.
"SOC 2 compliance demonstrates that AI customer service platforms maintain robust controls related to security, availability, processing integrity, confidentiality, and privacy."
Cobbai
Regulations like GDPR and CCPA each have unique requirements. GDPR emphasizes transparency and the need for clear user consent, with tools like explainable AI to clarify decision-making processes for regulators. On the other hand, CCPA focuses on consumer rights, such as requiring businesses to disclose data collection practices and offering "do not sell" options. Alarmingly, nearly 70% of organizations report that their employees lack basic security awareness, making automated compliance monitoring an essential tool.
By relying on API-driven evidence collection and continuous monitoring, companies can stay "audit-ready" without the hassle of manual data gathering. This approach not only lightens the load on IT teams but also ensures compliance is consistently maintained. Strengthening this foundation, advanced access controls further protect sensitive customer data.
Role-Based Access and Data Privacy Controls
To complement strong encryption and compliance measures, Role-Based Access Control (RBAC) ensures users only see the data they need. For example, finance teams access financial metrics, sales managers view pipeline details, and executives focus on high-level KPIs - nothing more. This Zero Trust architecture operates on the principle that no user or system is automatically trusted.
Protecting personally identifiable information (PII) is another key priority. Techniques like data masking and anonymization safeguard sensitive details. Tokenization replaces critical data with random tokens, while pseudonymization and differential privacy introduce controlled noise to datasets. These methods not only comply with GDPR and CCPA but also allow for meaningful analysis without compromising privacy.
To further enhance security, rules for data aggregation ensure individual records can’t be reverse-engineered. When combined with real-time anomaly detection, these measures can slash response times from hours to seconds, stopping potential breaches before they escalate.
Getting Started with Querio for Customer Analytics
Step 1: Connect Your Data Warehouse
To kick things off, you'll need to set up a secure, read-only connection to your existing data warehouse, whether you're using Snowflake, BigQuery, or Postgres. It's best to create a dedicated service account with minimal privileges to ensure no data can be modified. This setup keeps your original data safe while enabling real-time analytics.
Querio connects directly to your data warehouse using encrypted credentials, so there's no need to replicate data. This means your dashboards always show the most up-to-date information without requiring extra ETL processes. Plus, you stay in control of who can access what data at all times.
Step 2: Define Your Metrics and Business Logic
After connecting your data, the next step is setting up Querio's semantic layer, which acts as the backbone for consistent and accurate data across your organization. Here, you’ll define table joins, business metrics, and glossary terms in one central location. This ensures that when someone asks about metrics like "monthly recurring revenue" or "churn rate", they get the same answer every time because the logic is standardized at the source.
This centralized approach eliminates confusion caused by different teams calculating metrics in their own ways. By defining your business logic once, it applies universally to every dashboard, query, or embedded view your customers use. With this foundation in place, you're ready to bring these insights directly into your application.
Step 3: Embed Analytics and Scale to Users
Once your connection and metrics are set, embedding dashboards with Querio allows you to deliver fast, secure insights directly within your application. Using Querio’s Headlines APIs and theme tokens, you can seamlessly align analytics with your app’s design, ensuring everything looks and feels integrated.
Querio’s pricing model is designed to grow with you. It includes unlimited viewer access, so scaling to thousands of users won’t result in unexpected fees. The Core Platform starts at $14,000 per year, covering one database connection, 4,000 prompts each month, and unlimited viewers. For an additional $6,000, you can add the Dashboards feature, which provides drag-and-drop builders and scheduled reporting capabilities.
Agentic Analytics Summit. AI Agents for Customer-Facing Analytics to Improve Outcomes in Education
Conclusion: The Path Forward for Customer Analytics
AI-powered customer analytics is changing the game when it comes to making decisions quickly. With AI-driven insights, decisions that used to take days - or even weeks - can now be made in mere minutes. Jennifer Leidich, Co-Founder & CEO of Mercury, puts it best: "What used to be a week-long process now takes minutes." This kind of speed gives businesses a competitive edge, setting industry leaders apart from the rest.
Querio makes this transformation possible by breaking down the technical walls that often keep analytics confined to IT departments. Now, anyone - whether they're on the product team, in customer service, or part of the executive suite - can ask questions in plain English and get answers in seconds. No need for complicated SQL queries. Plus, Querio’s cost-effective scalability allows you to bring in thousands of users without worrying about per-seat fees eating into your budget. This approach not only makes analytics more accessible but also ensures secure, actionable insights are available to everyone.
Security is a top priority, too. Querio meets SOC 2 Type II standards and offers role-based access controls, so you don’t have to trade security for efficiency. As Enver Melih Sorkun, Co-Founder & CTO of Growdash, explains, "It's not just about saving time and money, it's about unlocking data." And unlocking data is exactly what allows businesses to act faster and smarter.
With the foundation set, it's time to put these insights to work. Start with a pilot project focusing on a high-priority goal, like reducing customer churn or improving inventory management. Querio’s semantic layer ensures everyone speaks the same language - when you define "monthly recurring revenue", it means the same thing across the board. From there, embed these insights directly into your product using Querio's APIs and theme tokens, creating a seamless, integrated experience for your users.
AI-powered, real-time insights aren’t just a futuristic concept - they’re here, and they’re driving measurable results. Companies that embrace AI-native platforms today will spend less time buried in reports and more time taking action, turning insights into real growth. The future of customer analytics isn’t just on the horizon - it’s already happening.
FAQs
How do natural language queries enhance user engagement in customer-facing analytics?
Natural language queries (NLQs) transform how people interact with data, making analytics more user-friendly and engaging. Instead of wrestling with complex dashboards or mastering query languages, users can simply type or say questions like, “What were our top-selling products last quarter?” and get clear, instant answers. This conversational approach simplifies data exploration, freeing users to focus on solving business problems rather than struggling with the tool itself.
What’s more, NLQs provide insights tailored to individual roles. For example, marketers can quickly check campaign performance, CFOs can review financial metrics, and product teams can monitor feature adoption - all in plain English. This personalization, paired with real-time responses, helps teams gain a deeper understanding, make decisions faster, and embrace data-driven practices. By cutting down on the need for IT or data analysts, NLQs put the power of information directly into the hands of every team member, encouraging collaboration and smarter decision-making across the board.
How does Querio ensure data security in customer-facing analytics?
Querio takes data security seriously, employing a multi-layered security framework to protect customer-facing analytics at every step. The platform holds a SOC 2 Type II certification, meeting rigorous standards for maintaining data confidentiality, integrity, and availability. To keep data safe, Querio encrypts it both at rest and during transit, effectively blocking unauthorized access.
Access control is managed through role-based access controls (RBAC), limiting users to only the data they need for their specific roles. For added transparency and accountability, all user activities are recorded in immutable audit trails, making it easier to track actions and meet compliance requirements. Querio also follows robust data governance practices, which include centralized data catalogs, defined ownership policies, and automated compliance checks. These efforts align with U.S. regulations like GDPR and CCPA, ensuring that sensitive information stays secure while enabling real-time, compliant insights.
How can businesses effectively generate revenue from customer-facing analytics?
To turn customer-facing analytics into a profitable venture, businesses need to focus on delivering clear and measurable benefits to their users. One effective method is offering analytics as a premium feature within tiered subscription plans. For instance, a basic plan might include standard dashboards, while higher-tier options could unlock advanced tools like real-time AI insights, predictive analytics, or enhanced security. Pricing these features at an accessible rate - say, $2.99 per user per month - can generate steady revenue while staying affordable for customers.
Another approach involves embedding analytics as a white-label solution that partners can rebrand and resell. By providing API access and customizable dashboards, businesses can implement flexible pricing models, such as usage-based fees (e.g., $0.01 per query) or flat annual licenses for larger-scale deployments. This strategy transforms analytics into a scalable product that partners can integrate into their own offerings.
Lastly, adopting a data-as-a-service model can be a game-changer. Businesses can deliver industry-specific benchmark dashboards through subscription plans, such as $49.99 per month. These dashboards provide actionable metrics tailored to customer needs, enabling smarter decision-making. By tying pricing to tangible outcomes - like improved efficiency or reduced customer churn - companies can justify higher price points and secure long-term revenue from their analytics solutions.
Related Blog Posts


