Business Intelligence
How SaaS companies use Querio to answer product questions without pinging the data team
Let product teams query live warehouse data in plain English to get instant insights and reduce reliance on the data team.
SaaS companies often face frustrating delays waiting for data insights, which can stall key decisions. Querio solves this by letting non-technical users query live data in plain English - no SQL or coding needed. Product managers can instantly access insights like churn drivers or feature adoption rates, cutting reporting times from weeks to minutes.
Key Benefits of Querio:
Instant Insights: Ask questions like, "Which user cohorts are churning?" and get real-time answers.
Live Data Access: Connects directly to [data warehouses like Snowflake, BigQuery, or Redshift](https://querio.ai/articles/warehouse-native-data-analysis-tools-for-snowflake-bigquery-and-databricks).
Self-Service Analytics: Empowers non-technical teams to analyze data without relying on engineers.
Governance Controls: Ensures consistent metrics and secure access with role-based permissions.
Querio transforms how SaaS teams work by reducing data bottlenecks, improving decision-making speed, and freeing up data teams for high-priority tasks.
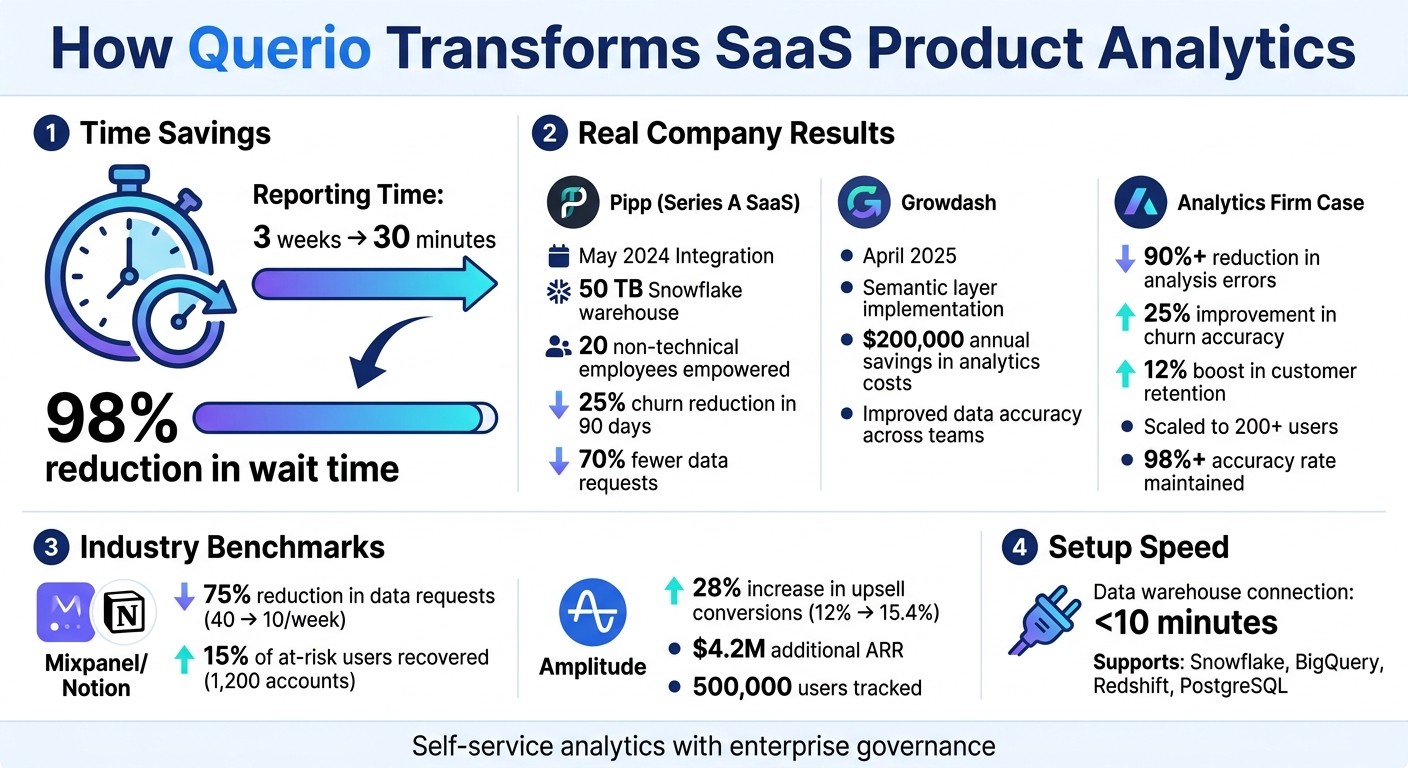
Querio Impact: Key Metrics and Results from SaaS Companies
How we're approaching self-service analytics with AI
Connecting Querio to Your Data Warehouse
Querio integrates directly with your existing data warehouse, eliminating the need for data copying, ETL processes, or redundant storage. It establishes secure, read-only connections to query live data right where it resides - whether that's Snowflake, BigQuery, Redshift, or PostgreSQL. This direct approach ensures product managers can access real-time insights without waiting for batch jobs or relying on outdated exports. The result? A quick, secure setup that simplifies the process.
Most data warehouses can be connected in under 10 minutes. For example, Snowflake uses OAuth, while BigQuery connects via a SELECT-only service account. Since Querio operates with read-only access, it aligns well with SOC 2-compliant environments.
Setting Up Data Warehouse Integration
To start, log into Querio and head to the integration settings. From there, select your warehouse type and enter the required credentials. For Snowflake, this means providing your account URL, username, and warehouse details before authenticating through OAuth. For BigQuery, you'll need a service account with SELECT-only permissions. Querio will automatically verify the connection's read-only status before allowing you to save the settings.
For added security, it’s a good idea to have your database administrator create a dedicated service account for Querio. Following the principle of least privilege, grant SELECT permissions only on the datasets your team needs - like user events, subscription data, or feature usage tables. This approach keeps the connection secure while ensuring product managers have access to the metrics that matter most.
Creating Shared Context for Consistent Results
Once the connection is established, configure Querio’s semantic layer to join tables, define key metrics, and standardize business definitions. This step creates a shared framework for self-service analytics, helping teams make faster, more consistent product decisions.
Asking Product Questions in Plain English
Once your data warehouse is integrated and the semantic layer is in place, product managers can ask questions in plain English. Querio’s AI engine takes these natural-language questions, interprets the business intent behind them, and translates them into precise SQL or Python queries. This removes the bottleneck of relying on data teams and empowers non-technical staff to get immediate insights. For example, you can simply ask, "Which features have the highest adoption rates among our enterprise customers?" or "Why did our monthly churn increase by 15% last quarter?", and get answers straight from live data.
Querio achieves this by mapping your plain English phrases to specific database columns and values through the configured semantic layer. This ensures everyone in the organization works with the same metrics, eliminating the inconsistencies that often arise when different teams calculate metrics in different ways.
Take the Series A SaaS company Pipp, for instance. In May 2024, they integrated Querio with their 50 TB Snowflake warehouse and BigQuery instance. This enabled 20 non-technical employees to query data about feature adoption and user behavior, reducing churn by 25% in just 90 days while cutting data requests by 70%.
Common Product Questions Querio Answers
Product managers often need insights into areas like feature adoption, user engagement, churn drivers, and revenue trends. With Querio, they can ask highly specific questions, such as:
"What is the feature adoption rate for our top 10 customers over the last 30 days?"
"Which user cohorts had the lowest retention rates in Q2 2026?"
When investigating churn, you might start broadly with "What is our monthly churn rate for the last quarter?" and then dig deeper with questions like:
"Which customer segments have the highest churn rates?"
"What is the average feature adoption rate for churned customers versus retained customers?"
"How many days after signup did churned customers last log in?"
By asking sequential questions, you can uncover patterns. For instance, customers who delay feature adoption might experience churn rates three times higher than others.
Querio also supports comparative analyses across customer segments or cohorts. For example:
"What is the feature adoption rate for customers acquired in Q1 2026 versus Q4 2025?"
"How does retention differ between customers who started with a free trial versus those who began with a paid plan?"
These insights help identify which customer segments derive the most value from your product, guiding your development priorities.
Reviewing the Generated SQL and Python Code
Querio doesn’t just provide answers - it also shows the SQL or Python code it generates to query your data. This transparency allows you to verify that the query aligns with your business question. For example, if you’re asking about "feature adoption rate," you can check that the code correctly defines "adoption" (such as users performing the feature action at least once) and references the right data sources.
By reviewing the code, you can refine your future questions. If the query misses certain data or makes incorrect assumptions, you can adjust by adding more specific parameters. This feedback loop helps improve your data literacy and ensures your analyses remain accurate and aligned with your goals.
For example, in April 2025, Growdash Co-Founder Enver Melih Sorkun used Querio’s semantic layer to document and clean data for natural language querying. This initiative improved data accuracy across teams, saving the company over $200,000 annually in analytics costs.
For more advanced needs, such as statistical modeling or predictive analysis, Querio supports Python notebooks within the same framework. You can begin with a plain English question, review the generated code, and then extend your analysis with custom Python scripts. This approach ensures consistency with your semantic layer while giving you the flexibility to dive deeper into complex analyses. With clear, verifiable code and the ability to collaborate in reactive notebooks, Querio sets the stage for more advanced, team-driven insights.
Working with Reactive Notebooks
Reactive notebooks are a powerful tool for extending your analysis after reviewing generated code. Think of them like spreadsheets - when data or business logic changes, the cells automatically update. This feature ensures that analyses remain consistent and collaborative across teams without extra effort.
Querio's notebooks work with both SQL and Python, making it easy to dive into advanced modeling or visualizations without switching tools. Each notebook starts with ctx = querio.context(), which loads your shared context. This ensures everyone uses the same business definitions for metrics, such as monthly recurring revenue or churn rate. Since these notebooks are saved as standard .py files, they can be versioned in Git, allowing you to track changes, reuse them as standalone scripts, or even turn them into interactive apps.
Collaborating on Analysis Across Teams
Reactive updates make it simple to collaborate across different teams. To avoid conflicting analyses, define 3–5 key metrics in your semantic layer. This centralization ensures that everyone - from product managers to marketers - works from the same foundation.
For instance, imagine your product team defines "feature adoption" as users performing an action at least once, while your marketing team defines it as users performing the action three times. Without a shared definition, these analyses would conflict. By centralizing these definitions, you eliminate confusion and ensure that every notebook aligns. Versioning semantic models in Git further strengthens this by maintaining a single source of truth.
Reusing Notebooks as Data Changes
One of the standout benefits of reactive notebooks is their ability to adapt as your data and business logic evolve. If your data team updates a metric definition in the semantic layer - like redefining "churned customer" - every notebook referencing that metric will automatically reflect the updated logic. This saves the hassle of manually revising dozens of reports or dashboards.
Since notebooks are stored as .py files, they’re portable and reusable. A notebook analyzing Q1 2026 feature adoption can be reused for Q2 2026 without needing changes, provided the data structure remains consistent. However, it’s crucial to verify and approve critical notebooks to differentiate between exploratory reports and those relied upon for key decisions.
This dynamic and flexible setup aligns with Querio’s focus on enabling product teams to access real-time, self-serve analytics, fostering consistent and agile decision-making.
Creating Dashboards and Reports from Your Analysis
Once you've pulled insights from reactive notebooks, the next step is creating live dashboards. This process is quick and efficient, taking just minutes. Since Querio connects directly to your data warehouse, dashboards automatically refresh as new data flows in - no need for manual exports or juggling multiple tools. The result? Your product metrics stay up-to-date without adding extra tasks for your team.
Another advantage is the automatic application of your predefined semantic logic. For instance, if you've defined a "churned customer" as one inactive for 30 days in your shared context, every dashboard using this metric will stick to that same definition. This ensures consistent and reliable reporting across the board. Now, let’s dive into how to visualize your product metrics effectively.
Building Dashboards for Product Metrics
Start by focusing on your key product KPIs - things like monthly recurring revenue (MRR), feature adoption rates, or churn segmented by customer groups. Querio’s dashboard builder allows you to visualize these metrics using the same queries you’ve already crafted in your notebook analyses. For example:
An MRR dashboard might feature a line chart pulling data from Stripe.
A feature adoption dashboard could use heatmaps to track user cohort behavior.
Here’s a real-world example: In February 2026, Mixpanel helped Notion’s product team embed churn dashboards into their internal tools. According to project manager Alex Rivera, this reduced data requests by 75% (from 40 to 10 per week) and uncovered a churn factor that helped recover 15% of at-risk users - a total of 1,200 accounts - all through API-enabled metrics governance [mixpanel.com/blog/notion-case-study].
And Querio doesn’t stop at internal dashboards - it also makes integrating analytics into customer-facing applications seamless.
Embedding Analytics in Your Applications
Querio offers RESTful APIs and iframe embeds to bring dashboards directly into your customer applications. Iframes are a quick solution: simply paste <iframe src="querio.app/embed/{dashboard-id}"> into your app. If you need more customization, Querio’s JavaScript SDK works with frameworks like React or Vue, allowing you to design charts that match your app's look and feel.
Security is baked in, with row-level controls ensuring customers only see their own data. Meanwhile, the semantic layer maintains uniform metric definitions. A great example of this in action: In Q4 2025, Amplitude integrated product usage metrics into their customer success tools. This allowed them to track feature adoption across 500,000 users, boosting upsell conversions by 28% (from 12% to 15.4%) and adding $4.2 million in ARR. Priya Patel, Amplitude’s Head of Analytics, credited this success to embedding governed metrics directly into their customer workflows [amplitude.com/customers].
Maintaining Accuracy with Governance Controls
For self-service analytics to work effectively, you need consistent metric definitions and secure access controls. Querio tackles this challenge with a semantic layer that standardizes business logic and role-based access controls to protect sensitive data. Together, these features create a solid governance framework, ensuring every team can rely on accurate, self-service analytics.
The semantic layer acts as a single source of truth. For example, if your data team defines "monthly active users" as those who logged in within the past 30 days, that definition applies universally - whether in plain English queries, dashboards, notebooks, or embedded analytics. This consistency is critical, especially when you consider that 85% of BI projects fail due to inaccurate data, as noted by Gartner [3]. Semantic layers help reduce this risk by enforcing uniform definitions across all analyses.
Role-based permissions add another layer of security, allowing teams to analyze key metrics like churn while safeguarding sensitive customer information. Querio’s row-level security and column masking automatically filter data based on user roles. This approach not only supports SOC 2 compliance but also ensures that self-service analytics remain secure. These tools are essential for maintaining accurate and reliable dashboards as your product evolves.
Setting Up Business Logic in the Semantic Layer
Centralizing your business logic is key to maintaining consistency. Define metrics, table joins, and business terms in one place. For instance, to calculate feature adoption, you might write a logic expression like this:
Label the metric as "Feature Adoption Rate" and include a clear description so everyone understands what it represents.
You can also use Querio’s visual builder to configure table joins. For example, link your users table to your events table using user_id, and enforce primary keys to avoid double-counting. To further standardize language, build a business glossary that maps terms like "churned customer" to specific metrics, complete with examples.
This approach pays off. One SaaS company reduced analysis errors by over 90% and improved churn accuracy by 25%, leading to a 12% boost in customer retention [2].
Managing Access and Tracking Changes
Querio’s granular role-based access controls ensure that data visibility is tightly managed. Assign roles such as Admin (full access), Analyst (query and notebook editing), or Viewer (read-only dashboards). For added security, implement row-level policies to restrict users to data relevant to their role.
Every change to your semantic layer is versioned, providing a complete history. For example, if the definition of churn shifts from 30 days to 28 days, Querio logs who made the change and when. You can compare versions, require approval from the data team before publishing updates, and even roll back to earlier versions if needed. This feature helped one SaaS analytics firm correct a 5% metric inaccuracy while scaling to over 200 users [2].
The version control system integrates seamlessly with Git, so you can treat business logic like code. Use peer reviews, CI/CD validation, and automated tests to catch issues before they reach production. Querio experts recommend reviewing top metrics quarterly to ensure definitions stay aligned with your business goals. This practice has helped organizations maintain accuracy rates above 98% over time [1][2].
With these governance controls in place, your analytics can adapt and grow without compromising on accuracy or trust.
Conclusion
Querio is changing the way product analytics works by giving product managers, marketers, and other non-technical teams the ability to access real-time insights without relying on data teams. Instead of waiting days - or even weeks - for answers, users can simply ask questions in plain English and get results in just minutes. This eliminates the delays that often hold back product decisions.
The results speak for themselves. Querio cuts reporting time from three weeks down to just 30 minutes - a massive time saver [1]. This shift allows companies to move from being dependent on data teams to becoming more self-reliant, enabling faster and smarter decision-making. At the same time, Querio ensures consistency with a governance framework that standardizes metrics organization-wide.
This unified approach to governance helps build a stronger data-driven culture. With a semantic layer vs. traditional data models comparison in mind, everyone - from product managers to marketers - works with the same metric definitions. Whether they’re analyzing churn rates, monitoring feature adoption, or creating dashboards, teams avoid conflicting reports and enjoy seamless self-service analytics.
The outcome? Data becomes the backbone of decision-making across the organization. Product managers can validate ideas quicker, catch engagement drops before they lead to churn, and refine strategies without needing constant engineering support. Meanwhile, data teams are freed up to focus on more strategic projects that scale with the business.
FAQs
How do I set up Querio with my warehouse safely?
Here’s how you can securely connect Querio to your data warehouse while maintaining control and ensuring safety:
Establish a secure connection: Set up a direct, read-only link to your data warehouse (such as Snowflake, BigQuery, or Postgres). This allows real-time access to your data without the need to duplicate it.
Implement governance tools: Use features like row-level security (RLS) to manage data visibility and single sign-on (SSO) for streamlined and secure user authentication.
Set user permissions: Define roles and permissions so that each user only sees the data they need.
These steps create a secure environment for seamless integration and empower users with self-service analytics.
What do I need in the semantic layer before teams can self-serve?
A well-designed semantic layer plays a key role in making self-service analytics successful. It helps by standardizing important metrics, ensuring consistent data across the board, and enforcing governance rules like row-level security and column masking. On top of that, it boosts query performance through features like caching and pre-aggregations.
This setup empowers non-technical users to easily access precise, real-time insights. The result? A thriving self-service analytics environment that minimizes confusion and keeps data reliable.
How do we prevent inconsistent metrics as more people use Querio?
As your data usage scales, inconsistent metrics can quickly become a headache. The solution? Set up a governed metrics layer. This creates a single source of truth for standardized definitions, formulas, and usage across all teams. When everyone relies on the same trusted data, it minimizes errors and prevents misalignment, ensuring your organization stays on the same page.
Related Blog Posts


