Business Intelligence
How to set up a BI tool at a Series A startup before you hire a data engineer
Setup live BI and self-service analytics at a Series A startup without hiring a data engineer.
You don’t need a data engineer to set up a BI tool at your Series A startup. With tools like Querio, you can connect your data warehouse, define key metrics, and empower your team with self-service analytics - all without technical expertise. Here’s how to do it:
Step 1: Prepare your data. Use a data warehouse like Snowflake, BigQuery, or Redshift. Identify key data sources (e.g., Stripe, HubSpot) and metrics (e.g., MRR, CAC, LTV). Define access levels for your team.
Step 2: Set up Querio. Connect it to your data warehouse, create a business context layer to simplify data terminology, and test queries to ensure accuracy.
Step 3: Build dashboards. Focus on 5–7 core metrics and create role-specific dashboards. Enable team-wide data access with AI-driven queries while maintaining security.
This approach saves time, avoids manual errors, and helps you make better decisions with reliable, live data - all without needing to hire a data engineer upfront.
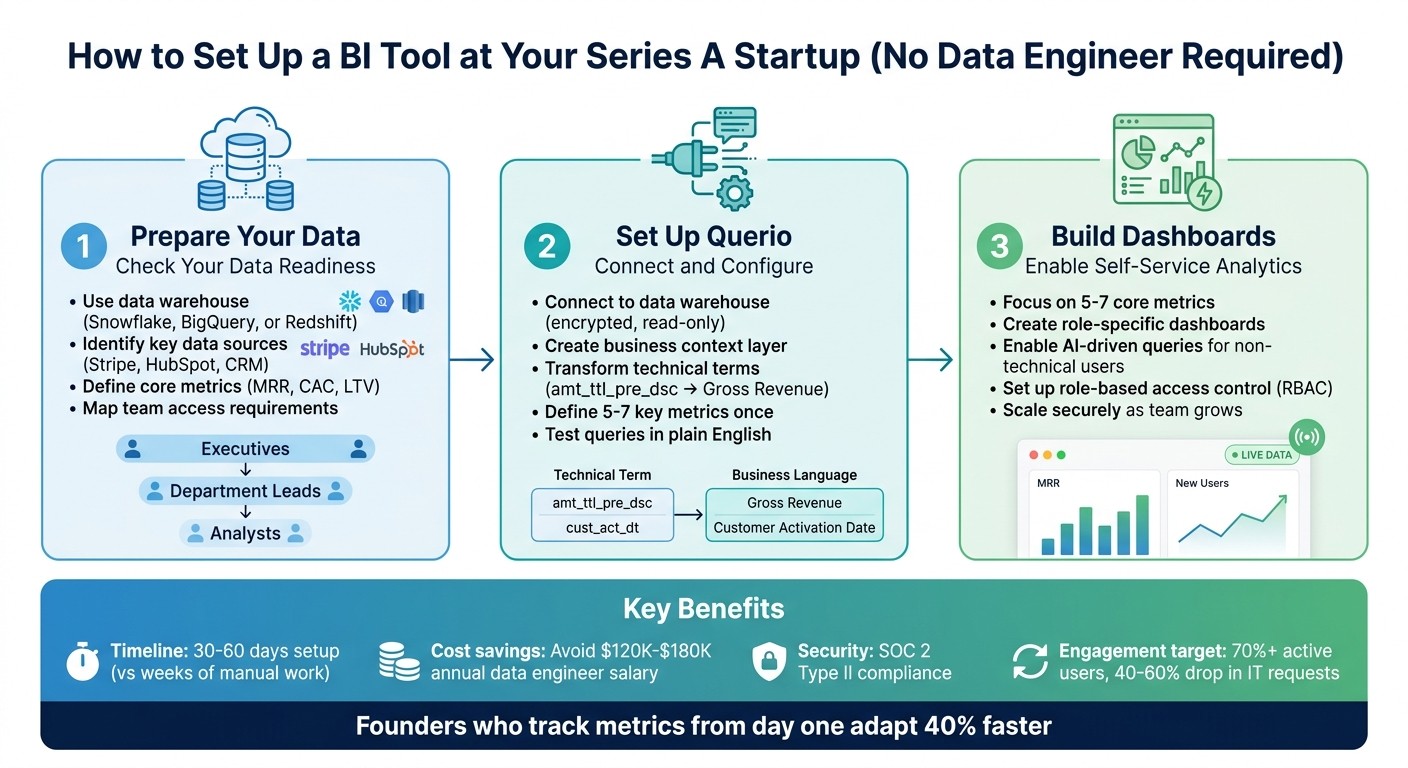
3-Step Process to Set Up BI Tool at Series A Startup Without Data Engineer
How to Choose a BI Tool For Your Business
Step 1: Check Your Data Readiness
Before diving in, make sure your data infrastructure is ready to handle live queries and deliver the insights your team needs. Here's how to align your setup with your team's requirements for a smooth process.
Review Your Data Warehouse Setup
Your data warehouse is the backbone of your analytics. Many Series A startups rely on platforms like Snowflake, BigQuery, or Redshift. If you're already using one of these, you're off to a solid start. Be sure to encrypt credentials and whitelist necessary IP addresses to avoid connection issues later on [4].
If you're currently using a production database like Postgres, MySQL, or MongoDB instead of a warehouse, it can work temporarily. However, as your data volume grows, plan to transition to a dedicated warehouse.
List Your Key Data Sources and Metrics
Start with your most critical data sources: your production database, payment processor (e.g., Stripe), and CRM system (such as HubSpot, Salesforce, or Attio) [3][4]. These will help you track the metrics investors care about most, like revenue, customer acquisition, and your sales pipeline.
Secondary sources - like marketing platforms (Google Ads, Facebook Ads) and customer support tools (Intercom, Zendesk) - add valuable context for understanding unit economics. Together, these tools help you monitor key metrics like MRR, CAC, LTV, and conversion rates.
Fun fact: Founders who start tracking these metrics from day one adapt 40% faster than those who delay setting up their data systems [2].
Map Out Team Data Access Requirements
Not everyone on your team needs the same level of access to data. Here's a breakdown:
Executives need high-level dashboards that show metrics like MRR, burn rate, and growth trends.
Department leads in sales, marketing, or product benefit from more detailed insights, such as cohort analyses, funnel breakdowns, and attribution data.
Analysts or operations team members (if you have them) need the ability to run custom queries and explore raw data.
Clearly define who needs access to what. This avoids giving too much or too little access and ensures your setup is secure and efficient. By mapping out these access levels beforehand, you'll streamline your configuration process with tools like Querio. You can even make your data warehouse conversational to simplify access for non-technical users.
Step 2: Connect and Configure Querio
Once your data is ready, the next step is connecting Querio to your data warehouse. This process is straightforward, letting you focus on defining your business's data language without getting bogged down by technicalities.
Connect Querio to Your Data Warehouse
Querio integrates seamlessly with platforms like Snowflake, BigQuery, Amazon Redshift, ClickHouse, and PostgreSQL through secure, encrypted connections. To get started, you'll need read-only credentials and your warehouse's connection details, such as the host, port, and database name. If your warehouse has IP restrictions, make sure to whitelist Querio’s IP addresses to avoid any connection issues.
The setup is as easy as pasting your credentials into Querio’s connection interface. Once you test the connection and confirm it works, you're good to go. Importantly, your data remains secure - Querio queries it directly without moving it outside your warehouse. After connecting, you’ll move on to defining your business language to make data accessible to your team.
Set Up Your Business Context Layer
This is where Querio shines for non-technical users. The context layer transforms technical column names (like amt_ttl_pre_dsc) into terms that make sense for your team, such as "Gross Revenue." It also allows you to define relationships between tables and standardize metric calculations, ensuring consistency across the board.
Start by identifying 5–7 key metrics that are most important to your leadership team, such as MRR (Monthly Recurring Revenue), CAC (Customer Acquisition Cost), LTV (Lifetime Value), conversion rates, and churn. Map these metrics to your warehouse tables and define them just once. From that point on, when someone asks a question like, "What’s our MRR?" Querio will generate the correct SQL query based on the logic you’ve established. Assign a data steward - whether it's an analyst, operations lead, or even a founder - to oversee these definitions and ensure they stay accurate as your team grows.
Test and Adjust Your Queries
Test your setup by running queries in plain English and refining them with follow-up commands like "Break it down by region" or "Show only the top 5 products." For example, you could ask: "What’s the monthly retention rate for customers who signed up in the last six months, sorted by acquisition channel?" Querio helps you validate your setup by highlighting recognized terms in blue and flagging uncertain ones in orange, so you can confirm everything is working as intended.
Before rolling out Querio company-wide, run a pilot with 5–10 non-technical users from teams like sales, marketing, or operations. Their feedback will be invaluable for identifying any areas of confusion and refining your metric definitions or context layer as needed.
Step 3: Create Dashboards and Enable Self-Service Analytics
Once your context layer is verified, it’s time to put those insights to work. By setting up real-time dashboards, Querio becomes more than just a setup tool - it turns into a daily driver for smarter, data-backed decisions across your startup.
Build Dashboards for Key Metrics
Focus your dashboards on the 5–7 core metrics you identified earlier. For example, SaaS startups often prioritize metrics like MRR (Monthly Recurring Revenue), churn rate, LTV (Lifetime Value), and CAC (Customer Acquisition Cost). On the other hand, e-commerce businesses typically track conversion rates, AOV (Average Order Value), retention, and cart abandonment. Tailor your dashboards to match your business model - subscription-based companies thrive by emphasizing growth and retention metrics, while transactional businesses focus on conversion rates and customer loyalty[1].
Pull these dashboards directly from the queries you’ve already tested. Since Querio connects live to your data warehouse, the dashboards update automatically, eliminating the need for manual exports or refreshes. You can even create customized views for different teams. For instance, executives might need a high-level overview, while department managers could benefit from more detailed, operational dashboards specific to their areas.
Empower Non-Technical Users with AI-Driven Queries
Once your metrics are in place, make it easy for every team member to explore data independently. For example, a marketing manager could type, “Compare sales across regions for Q1 2026,” and instantly get accurate results. Querio’s AI translates plain English into SQL or Python, and users can inspect the query to see how it was built, ensuring transparency and alignment with the business context.
Encourage users to ask precise questions. Instead of a vague query like, “Show me customer data,” they could ask, “What’s the monthly retention rate for customers who signed up in the last six months, sorted by acquisition channel?” Breaking complex questions into smaller, manageable steps reduces errors and makes validation easier. Start by rolling out this capability to a group of 5–10 eager "data champions" in each department. These champions can gather feedback, drive adoption, and support their teams through regular sessions like "Data Coffee Hours" or weekly office hours.
Scale Data Access Securely as Your Team Grows
As more people use the dashboards, maintaining data security becomes even more important. Use role-based access control (RBAC) to ensure teams only see what they need. For example, marketing might have access to acquisition metrics but not sensitive financial data. Querio’s context layer acts as the single source of truth - any updates to metric definitions automatically apply across all dashboards, reducing confusion and ensuring consistency.
Keep an eye on engagement metrics like monthly active users and template reuse rates to identify teams that may need additional training or support. Aim for over 70% active user engagement, a 40–60% drop in IT data requests, and a 50% faster time-to-insight[1]. Assign ownership of the context layer to your data team to ensure definitions stay accurate and relevant as your business evolves.
Conclusion
Key Takeaways
Getting a BI tool up and running before hiring a data engineer isn’t just doable - it’s a smart move for Series A startups. With Querio connecting directly to your existing data warehouse, you can bypass technical hurdles and give your team immediate access to live data. Plus, the standardized context layer ensures everyone works with consistent and reliable metrics.
Querio speeds up the setup process, reducing it from weeks to just 30–60 days. On top of that, you avoid the steep costs of hiring a data engineer, which typically range between $120,000 and $180,000 annually. You also skip the per-user licensing fees that can quickly add up to thousands of dollars each month. Instead, Querio offers enterprise-grade SOC 2 Type II security and unlimited access - all for a flat annual fee, making it a cost-effective solution as your team scales.
This approach allows your early team members to focus on strategic growth initiatives rather than spending time wrestling with data. With self-service analytics in place, you’re setting the stage for a truly data-driven culture without needing to build out a full-fledged data team right away.
These advantages set you up for the next phase of growth.
Next Steps for Your Startup
To put these insights into action, start by auditing your current data setup. Ensure your data resides in a supported warehouse like Snowflake, BigQuery, or Postgres, and identify the 5–7 key metrics that align closely with your business goals. Begin with a pilot program involving 5–10 users who focus on 1–2 critical metrics to quickly demonstrate the value of the tool.
Set up billing alerts at 75% and 90% of your warehouse budget during the first 90 days to prevent unexpected expenses. As you roll out dashboards and self-service analytics, appoint data champions in each department to encourage adoption and collect feedback. Querio’s streamlined setup process supports these steps, making it easy to implement. With Querio’s free trial and money-back guarantee, you can explore the entire setup risk-free and see how AI-powered analytics can transform decision-making at your startup.
FAQs
Do I need a data warehouse before using Querio?
No, you don’t need a data warehouse to use Querio. While Querio can integrate with data warehouses like Snowflake, BigQuery, or Postgres, it’s also designed to work directly with live data sources. This flexibility makes it a great option for startups that want to dive into business intelligence (BI) without dealing with the complexity of setting up a full data warehouse right away.
Which 5–7 metrics should I start with for my dashboards?
Start by focusing on 5–7 key metrics that can guide your business decisions effectively. Here are some commonly used options:
Revenue or Monthly Recurring Revenue (MRR): A clear indicator of income and growth trends over time.
Customer Churn Rate: Helps you understand how well you're retaining customers.
Customer Acquisition Cost (CAC): Measures how efficiently you're acquiring new customers through marketing and sales efforts.
Lifetime Value (LTV): Shows the total value a customer brings to your business over their relationship with you.
Conversion Rate: Tracks how well your sales funnel is performing, from leads to customers.
Operational Metrics: Examples include active users or engagement rates, which highlight how your product or service is being used.
Cash Burn Rate or Runway: Keeps you informed about your financial standing and how long your funds will last.
These metrics give you a solid foundation for understanding your business’s performance and where to focus your efforts.
How do I keep data secure while giving the whole team access?
To keep data secure while allowing team access, leverage your BI platform's governance features. Tools like role-based access controls and automated compliance checks help restrict access to only those who need it. Choose platforms such as Querio that offer secure integrations, encrypted connections, and read-only access options. These steps maintain data accuracy, meet compliance standards, and guard against unauthorized access - making it possible for teams to collaborate safely without exposing sensitive information.
Related Blog Posts


