Business Intelligence
best dashboard software
Compare eight dashboard platforms by AI features, real-time access, integrations, and deployment to find the right BI tool for your team's needs.
In a world flooded with data, choosing the right dashboard software can make or break your ability to gain clear insights and make better decisions. With AI-driven tools leading the charge, today's platforms simplify data analysis, deliver real-time visual insights, and enable teams to act faster. Here's a look at eight top dashboard platforms:
Querio: transforms plain-English questions into SQL queries for real-time visuals, connects to live data warehouses, and scales with your organization.
Microsoft Power BI: Integrates seamlessly with Microsoft tools, offers AI-powered features like Copilot, and provides affordable pricing options.
Tableau with Tableau GPT: Excels in visualizations and AI-driven insights, with seamless integration into Salesforce.
Qlik Sense: Allows dynamic data exploration with its associative engine and robust real-time capabilities.
Oracle Analytics Cloud: Offers AI tools for natural language queries and integrates with Oracle Cloud for large-scale operations.
IBM Cognos Analytics: Combines AI assistance with strong governance tools, ideal for enterprise-level users.
TIBCO Spotfire: Focuses on real-time operational insights and industry-specific analytics.
Sisense: Embeds AI-powered analytics into workflows, with strong integration and deployment flexibility.
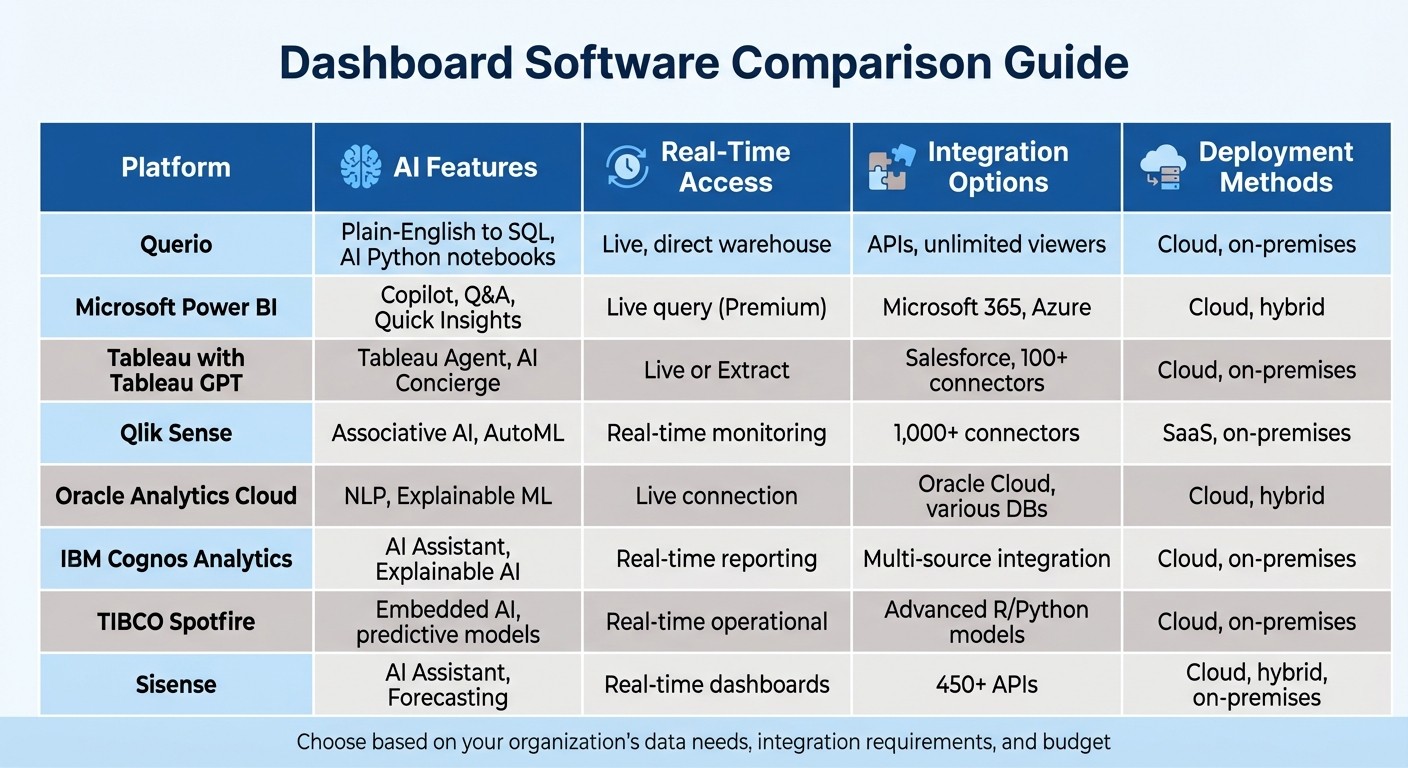
These tools vary in AI capabilities, real-time data handling, integration options, and deployment methods. Below is a quick comparison to help you decide which platform suits your needs.
Quick Comparison
Platform | AI Features | Real-Time Access | Integration Options | Deployment Methods |
|---|---|---|---|---|
Querio | Plain-English to SQL, AI Python notebooks | Live, direct warehouse | APIs, unlimited viewers | Cloud, on-premises |
Microsoft Power BI | Copilot, Q&A, Quick Insights | Live query (Premium) | Cloud, hybrid | |
Tableau with GPT | Tableau Agent, AI Concierge | Live or Extract | Salesforce, 100+ connectors | Cloud, on-premises |
Qlik Sense | Associative AI, AutoML | Real-time monitoring | 1,000+ connectors | SaaS, on-premises |
Oracle Analytics Cloud | NLP, Explainable ML | Live connection | Oracle Cloud, various DBs | Cloud, hybrid |
IBM Cognos Analytics | AI Assistant, Explainable AI | Real-time reporting | Multi-source integration | Cloud, on-premises |
TIBCO Spotfire | Embedded AI, predictive models | Real-time operational | Advanced R/Python models | Cloud, on-premises |
Sisense | AI Assistant, Forecasting | Real-time dashboards | 450+ APIs | Cloud, hybrid, on-premises |
Each platform offers unique strengths and essential features. Power BI is ideal for Microsoft ecosystems, Tableau shines in visualizations, and Querio simplifies SQL-heavy workflows. For enterprise needs, Oracle and IBM Cognos stand out, while TIBCO and Sisense cater to specialized use cases. Consider your organization's data needs, integration requirements, and budget to choose the right tool.
Dashboard Software Comparison: AI Features, Real-Time Access, Integration & Deployment
7 Best Data Visualization Tools 2025 (Full Software Demo & Comparsion)
1. Querio
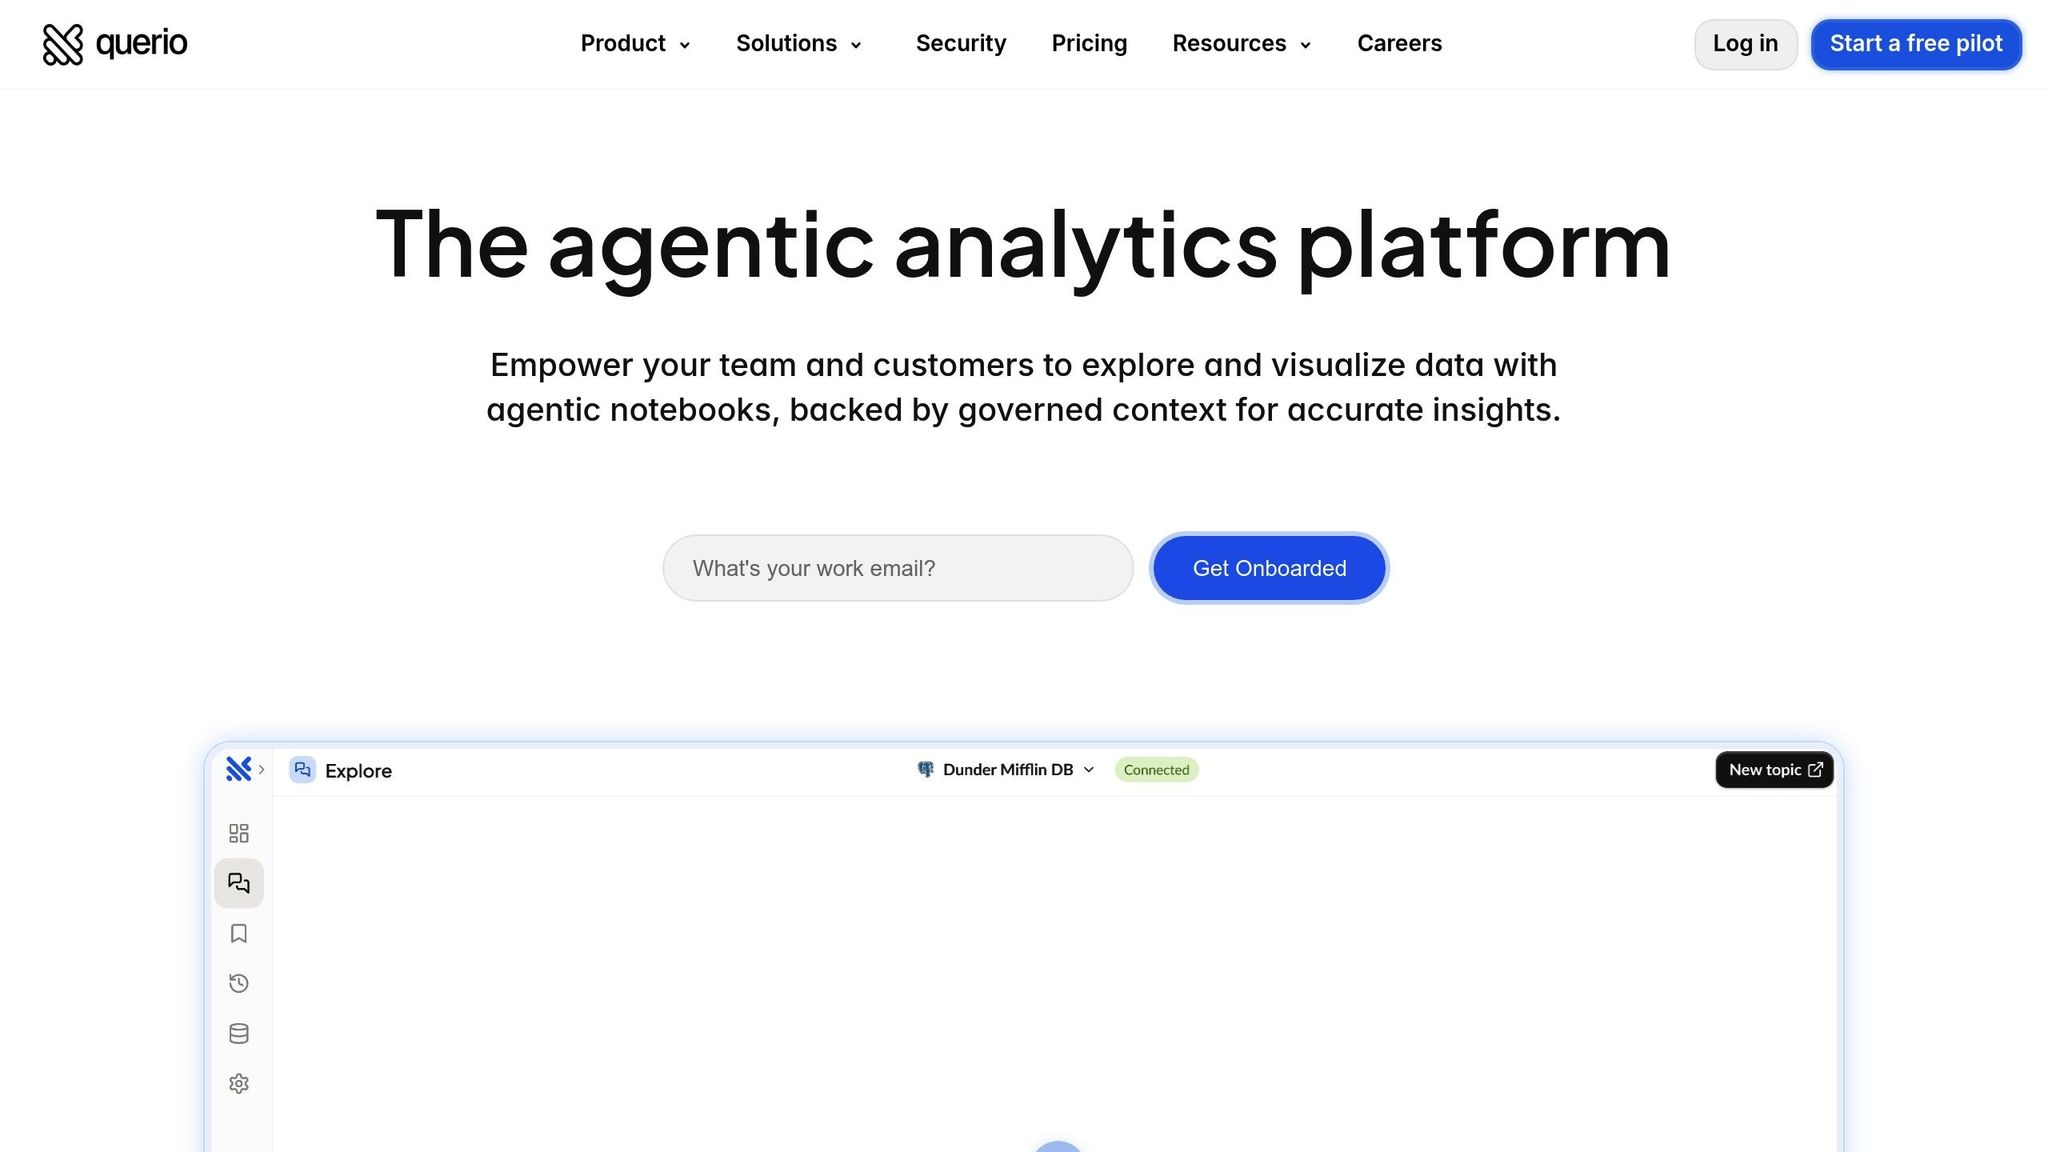
Querio is an AI-powered analytics workspace that connects directly to your existing data warehouse - whether you're using Snowflake, BigQuery, or Postgres. It allows teams to ask questions in plain English and provides transparent SQL and Python code as output, removing the need to rely on data teams for every query.
AI and Natural Language Features
Querio transforms conversational questions into precise SQL queries, making coding optional for data analysis. Its context layer lets data teams define business logic, table relationships, and glossaries just once. This ensures consistent answers across all queries - so when someone asks about "revenue", the response aligns with your organization’s specific definition.
Real-Time Insights
With live, read-only connections, Querio delivers analytics based on your most current data. This eliminates data duplication and ensures dashboards, scheduled reports, and ad-hoc queries all pull from the same trusted source. Teams can create dashboards for ongoing monitoring and set up automated alerts that integrate with tools like Slack or email, keeping everyone updated without needing to switch platforms. These real-time capabilities seamlessly integrate into existing systems, supporting growth as your needs evolve.
Integration and Scalability
Querio is built to grow with your organization. It uses direct warehouse queries, native connectors, and APIs to enable embedded analytics tools and platforms, offering the same consistent experience in customer-facing applications or internal tools. Its unlimited viewer model eliminates per-user licensing fees, making it easier to provide data access across large teams without worrying about costs. Additionally, Querio meets enterprise-grade security standards with SOC 2 Type II certification, ensuring your proprietary data stays protected.
Flexible Deployment Options
Businesses can start small by piloting Querio within a single department to quickly demonstrate value before expanding across the organization. The platform also includes AI Python notebooks, combining business queries with advanced data science capabilities. By integrating querying, visualization, and reporting into one interface, Querio simplifies workflows and positions itself as an essential tool for modern, AI-driven analytics.
2. Microsoft Power BI
Microsoft Power BI is a platform designed to blend data visualization with AI-powered analytics. As part of the Microsoft Fabric ecosystem, it connects to a wide variety of data sources - including Azure SQL Database, Salesforce, Excel, and SharePoint - to create interactive dashboards. This extensive connectivity makes Power BI a strong player in the world of AI-focused analytics.
AI and Natural Language Capabilities
Power BI's Copilot leverages generative AI to assist with building reports, calculating DAX, and summarizing data. Its generative BI Q&A feature allows users to ask questions like "What were our top-selling products last quarter?" and instantly receive visualized answers, all without needing to write code. Other tools like quick measures, forecasting, and clustering automatically identify trends, while narrative visuals provide text-based summaries of reports. Jerod Ridge, Director of Data Engineering at Lumen, highlighted its efficiency:
"In the last year alone, we've eliminated almost 10,000 manual hours through Microsoft-powered automation. That's time we now spend creating business value."
Real-Time Analytics and Insights
Power BI enables real-time dashboards and streaming data through its Power BI service. With Direct Lake Mode, it can query data directly in OneLake, bypassing caching delays. The mobile app ensures users can access live dashboards on iOS, Android, and Windows devices. As one industry leader remarked:
"With the new platform and Power BI, we've democratized customer insights across the company. Insights are no longer siloed but available to all relevant teams..."
Integration and Scalability
Power BI integrates seamlessly with Microsoft 365 apps like Teams, Excel, PowerPoint, and Outlook, embedding insights directly into workflows. Micah Dail, Director of Finance Data & Analytics at Walmart, emphasized its importance:
"At Walmart, we use multiple vendors in our technology stack, so having a tool like Power BI that can bring everything together was critical."
The platform is built to handle massive data volumes, scaling up to petabytes. It was ranked highest for "Ability to Execute" in the June 2025 Gartner Magic Quadrant for AI business intelligence platforms. Additionally, a 2024 Forrester Consulting study reported that Microsoft Fabric - which includes Power BI - delivered a 379% ROI for organizations. These capabilities help businesses make faster, more informed decisions by linking AI tools directly to large-scale data infrastructures. Power BI's integrations also adapt easily to various deployment needs.
Deployment Options
Power BI offers flexible deployment options, including Power BI Desktop (a Windows application), Power BI Service (cloud-based), Power BI Mobile, and Power BI Report Server. For personal use, a free version is available, while Power BI Pro costs $14.00 per user/month, and Power BI Premium Per User is priced at $24.00 per user/month. Organizations with strict data residency requirements can also opt for hybrid models, combining cloud services with on-premises reporting.
3. Tableau with Tableau GPT
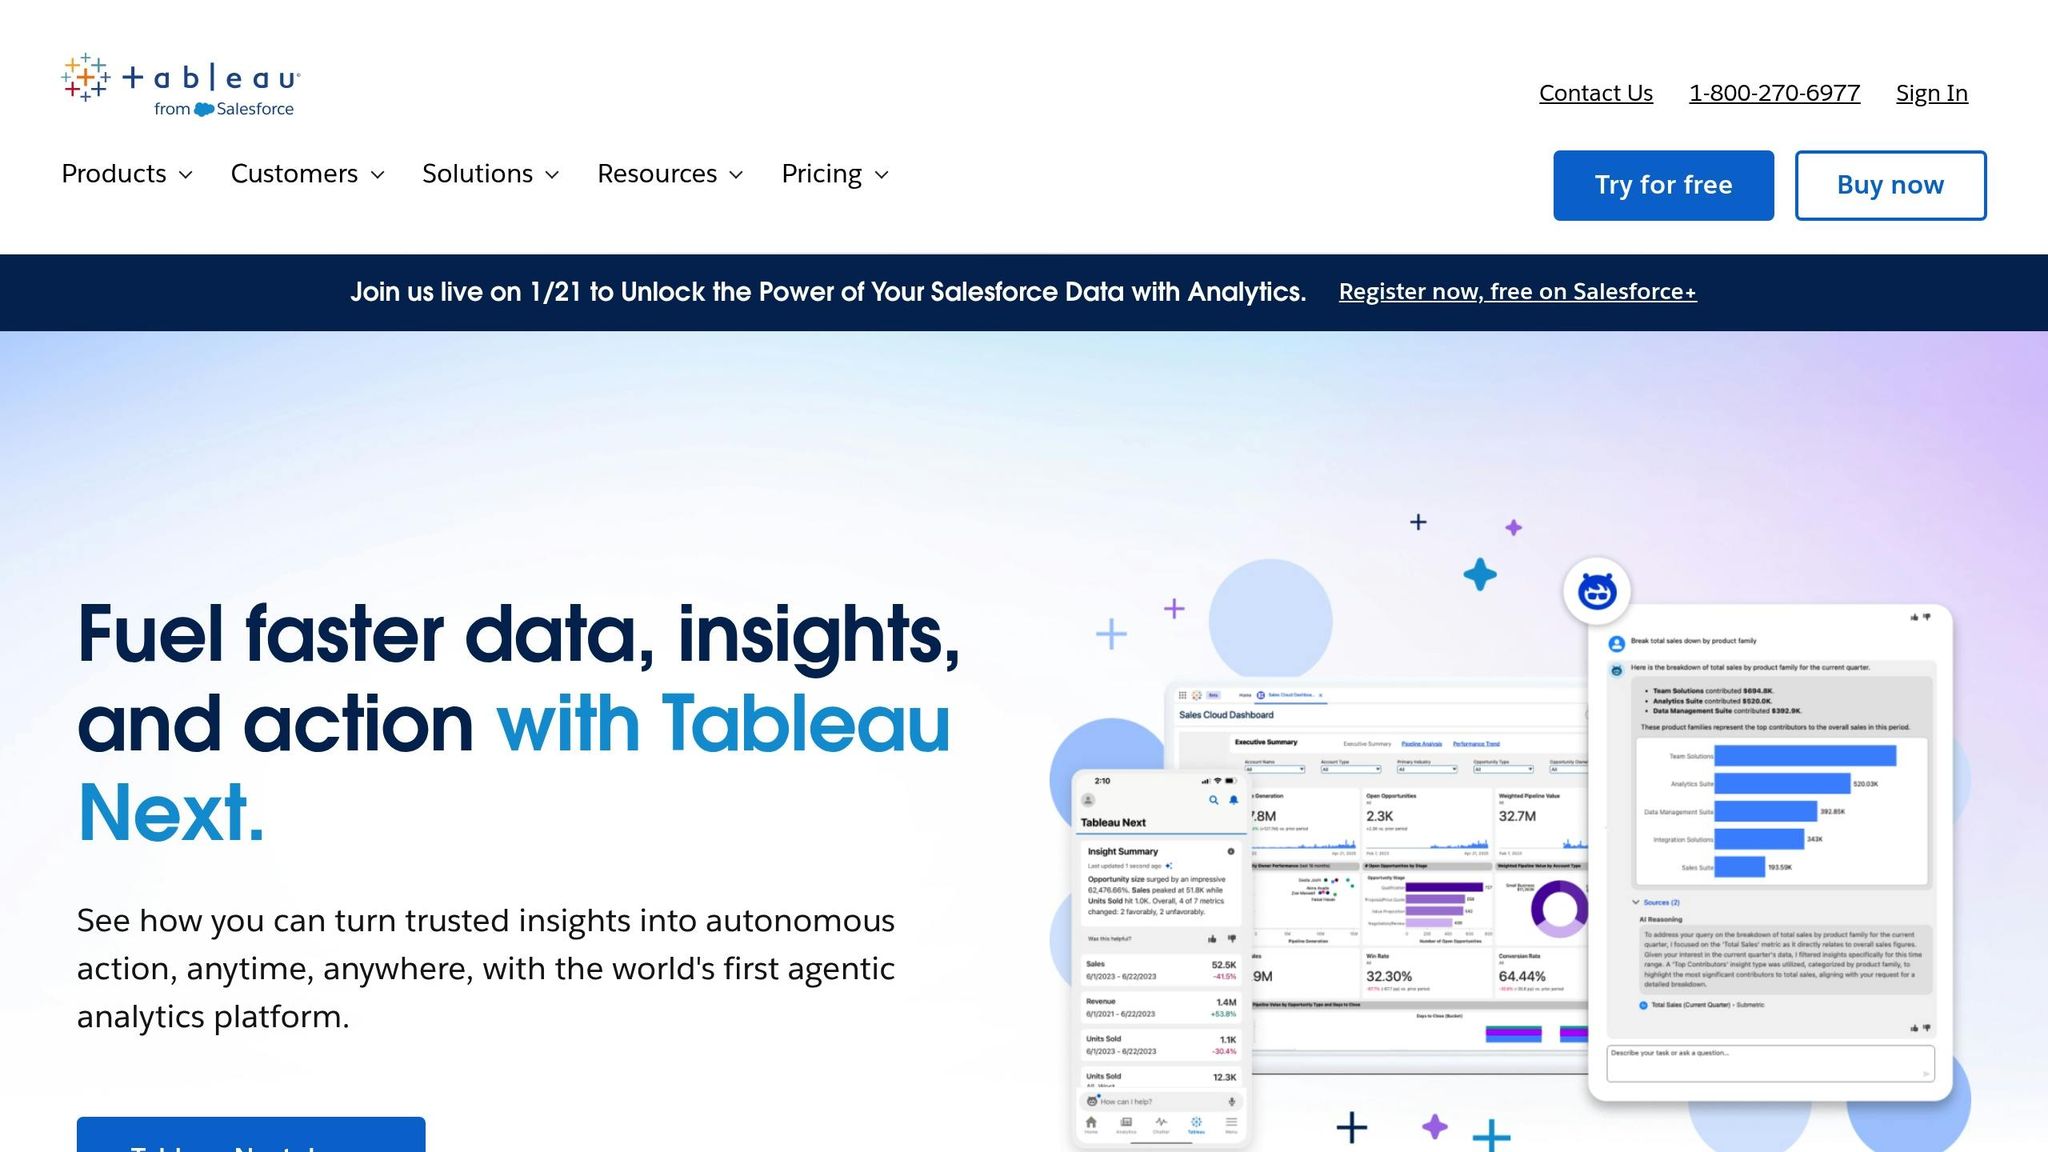
Tableau has taken a big step forward by integrating generative AI into its platform through Tableau AI, reshaping the evolution of business intelligence and how teams visualize data. This integration blends traditional AI-enhanced dashboards with intelligent AI agents, enabling advanced analysis and delivering insights straight into tools like Slack and email. Let’s dive into the key features that make this possible.
AI and Natural Language Capabilities
With Tableau Agent, users can turn natural language prompts into visualizations instantly. Simply ask a question in plain language, and the platform provides visual answers on the spot. Added to this are tools like the Concierge skill, which digs into root causes through conversational prompts, and the Inspector skill, which keeps tabs on key metrics and alerts users when trends change or thresholds are crossed [3].
The impact of these tools is clear. Businesses using Tableau have reported a 33% boost in insights-driven decision-making and a 32% increase in productivity among business users [6]. Tableau’s excellence has also been recognized, earning it a spot as a Leader in the 2025 Gartner Magic Quadrant for Analytics and Business Intelligence Platforms [4]. To ensure security, all AI interactions are safeguarded by the Einstein Trust Layer, which prevents sensitive data from being used to train AI models [5].
Real-Time Analytics and Insights
Taking AI capabilities even further, Tableau Pulse delivers personalized metric updates directly into communication tools, eliminating the need to log into dashboards. These updates are AI-summarized, offering plain-language explanations of patterns, outliers, and trends. This way, users can quickly grasp the reasons behind data changes without spending time on manual analysis [5].
The platform also introduces a Metrics Layer, which allows organizations to define KPIs once and distribute them consistently across teams. This ensures everyone works from a single source of truth, making real-time tracking more reliable and efficient [5].
Integration and Scalability
Tableau’s flexibility shines in its deployment options, working seamlessly on Windows, Linux, on-premises setups, or any major cloud platform like AWS, Azure, and GCP [6]. It integrates directly with Salesforce CRM, using pre-built models and no-code embedding to enable live queries across platforms [6]. Tableau also supports live queries with Snowflake, Databricks, and AWS without requiring data migration [6][7].
This adaptability has real benefits - organizations have seen a 27% improvement in IT system agility and flexibility after adopting Tableau [6]. For developers, the Tableau MCP (Model Context Protocol) opens up opportunities to integrate analytics into custom AI agents, allowing for conversational analysis powered by trusted data [3].
4. Qlik Sense
Qlik Sense is known for its associative engine, which offers a fresh way to explore data. Instead of being restricted by predefined queries, users can freely navigate their data, uncovering hidden patterns through real-time connections. This means you can click through your data in any direction and instantly see both relationships and exclusions. This dynamic approach forms the backbone of its advanced AI and natural language tools.
AI and Natural Language Capabilities
Qlik Sense includes AI-driven features that let users ask questions in plain English and get immediate visual answers through natural language BI. This eliminates technical hurdles, making it easier for anyone - regardless of expertise - to dive into data analysis.
Integration and Scalability
The platform connects seamlessly with various business systems, pulling data from multiple sources without requiring custom coding. Whether your organization operates in the cloud, on-premises, or a mix of both, Qlik Sense’s architecture supports it. This flexibility allows businesses of all sizes, from small teams to large enterprises managing massive datasets, to integrate it into their operations.
Deployment Options
Qlik Sense offers deployment models that cater to different needs, including cloud-based, on-premises, and hybrid setups. Organizations can choose the option that aligns with their security and IT infrastructure requirements. However, some users note a steep learning curve and limited offline functionality [8].
5. Oracle Analytics Cloud
Oracle Analytics Cloud simplifies the process of creating data visualizations through its AI-powered tools. From generating visuals to organizing metadata and renaming columns for clarity, it handles many tasks automatically [10]. Let’s dive into its standout features, including AI capabilities, real-time analytics, seamless integration, and flexible deployment options.
AI and Natural Language Capabilities
Oracle Analytics Cloud supports natural language queries (NLQ) in 28 languages, allowing users to type or speak their questions and receive both visual and spoken responses. Its Auto Insights feature takes it a step further by suggesting the best visualizations automatically, cutting down the need for manual data exploration, empowering non-technical teams to find answers independently [9][10]. Additionally, its Explainable Machine Learning feature, called Explain, pinpoints the factors driving data trends and lets users tweak variables to refine outcomes [9].
The platform also integrates with Oracle Cloud Infrastructure (OCI) AI services, such as Document Understanding, which can process unstructured data like invoices and contracts [9].
"The capabilities of Oracle Analytics Cloud are wonderful." - Risk Management Officer, Finance Industry [9]
Real-Time Analytics and Insights
With Oracle Analytics Cloud, analytics are delivered and monitored in real time, ensuring users have access to insights on the go [11]. Its mobile app leverages machine learning to understand user behavior and provide tailored recommendations [9]. According to research, 78% of companies report that faster decision-making is a key advantage of integrating AI into their data dashboards [12].
Integration and Scalability
Built on Oracle Cloud Infrastructure, the platform scales effortlessly to meet varying business needs. It features over 35 native connectors to both Oracle and non-Oracle sources, including Microsoft Azure and Google Cloud Platform. For businesses relying on older systems, JDBC support ensures compatibility, while a shared semantic layer keeps metrics consistent across the organization [9].
A real-world example: Clopay Garage Doors adopted the Oracle AI Data Platform to move away from manual spreadsheet analysis. This shift allowed them to predict dealer churn and spot market trends ahead of time, ultimately boosting profitability [13].
Deployment Options
Oracle Analytics Cloud offers several deployment models to suit different needs. Businesses can choose a native cloud service managed on OCI, a private hosted cloud managed on platforms like Microsoft Azure, or access it through the Oracle Cloud Marketplace [9]. Pricing is flexible, with the Professional Edition starting at $162.30 per month for ten users. Options include OCPU-based or per-user pricing, and existing OBIEE customers can bring their own licenses via BYOL [9].
6. IBM Cognos Analytics
IBM Cognos Analytics combines AI-driven insights with strong governance tools in a single platform. Its AI Assistant allows users to ask questions in plain English - like "show Q4 2022 revenue by product line" - and receive answers in the form of charts or narrative insights [14][17]. The platform can instantly create dashboards and visualizations based on natural language inputs [14][15].
AI and Natural Language Capabilities
The AI Assistant is integrated throughout the application, helping users shift from simply reacting to data to making informed, proactive decisions. With features like predictive forecasting and time series modeling, users can uncover trends without needing specialized skills [14][16]. IBM's Explainable AI ensures transparency by showing how insights and predictions are generated [17].
According to an IDC report, around 68% of business data remains unused, and only about 15% of employees in most organizations actively use BI tools [17]. IBM Cognos Analytics aims to close this gap with self-service data preparation tools that make analytics accessible, even for non-technical users [15][17].
"IBM Cognos Analytics is an all-in-one tool in which you can be a data analyst, visual storyteller, and a report writer all rolled out in a single software package." - Finance Reviewer, Education Industry [18]
Real-Time Analytics and Insights
Organizations have reported impressive results with IBM Cognos Analytics. For example, ULMA improved reporting speed and accuracy by 86%, while Elkjøp saw a 9% increase in total sales revenue using real-time data [15]. The UK Ministry of Defence consolidated four outdated platforms into one Cognos Analytics instance, breaking down data silos. Similarly, Mohegan Sun saved supervisors nearly one hour per day by leveraging near real-time data [15]. The platform also integrates with Slack, enabling teams to share AI-generated insights directly within their collaboration channels [14].
Integration and Scalability
IBM Cognos Analytics is designed to scale from individual users to enterprise-wide deployments, offering centralized governance and detailed access controls [15]. It integrates seamlessly with IBM SPSS for advanced predictive modeling and IBM Planning Analytics for unified reporting and planning [14]. The Data Connector Pack supports connections to modern data platforms like SAP BW/4HANA and Microsoft Fabric [15]. Unlike many self-service tools, Cognos emphasizes "governed BI", ensuring data security and trust through features like audit trails and access controls, even for non-expert users [15].
Deployment Options
IBM Cognos Analytics offers flexible deployment options, including on-premises, cloud, and hybrid environments. Pricing starts with the Standard Plan at $11.25 per user per month, which includes dashboards, visualizations, the AI Assistant, and mobile app access. The Premium Plan begins at $44.90 per user per month, adding enterprise reporting, data exploration, and advanced administration features [15]. Deployment choices include on-premises for full control, a cloud-hosted option managed by IBM, or containerized deployment via IBM Cloud Pak for Data on platforms like AWS, Azure, GCP, or IBM Cloud [15].
7. TIBCO Spotfire
TIBCO Spotfire presents itself as a Visual Data Science Platform designed to tackle industry-specific challenges efficiently [20][21]. Now part of Cloud Software Group, Inc., the platform blends in-depth data exploration with advanced analytics and AI-driven tools, making it a strong fit for industries like manufacturing, infrastructure, and agriculture [22][23].
AI and Natural Language Capabilities
Spotfire takes AI integration seriously, allowing predictive models to be embedded directly into its dashboards. This means users can work with AI-driven algorithms without needing to jump between tools, making workflows smoother and more efficient. Beyond just visualizing data, Spotfire supports predictive maintenance and delivers real-time operational insights. A practical example? Autostrade per l'Italia uses these capabilities to predict traffic delays with an impressive 97.5% accuracy, improving road safety [23].
Real-Time Analytics and Insights
Spotfire’s real-time analytics translate into measurable benefits. Here are some standout examples: Hemlock Semiconductor saves $300,000 each month on electricity costs; AA Ireland boosts revenue by 22% through AI-powered pricing and fraud detection; Norfolk Southern accelerates analytics delivery by 25%; and 80% of the Scottish Environment Protection Agency’s staff rely on the platform for decision-making [23]. These results highlight the platform's ability to deliver immediate and impactful insights.
Integration and Scalability
Spotfire is built with enterprise-level operations in mind, offering scalability to support thousands of users worldwide. For instance, Bayer Crop Sciences equips 14,000 users with precision agriculture analytics through the platform. The TIBCO Analytics suite, which includes Spotfire Server, Statistics Services, and Automation Services, integrates advanced R or Python models into visual dashboards. It also simplifies data workflows and automates repetitive tasks, ensuring governance is maintained even at scale [22][23].
8. Sisense
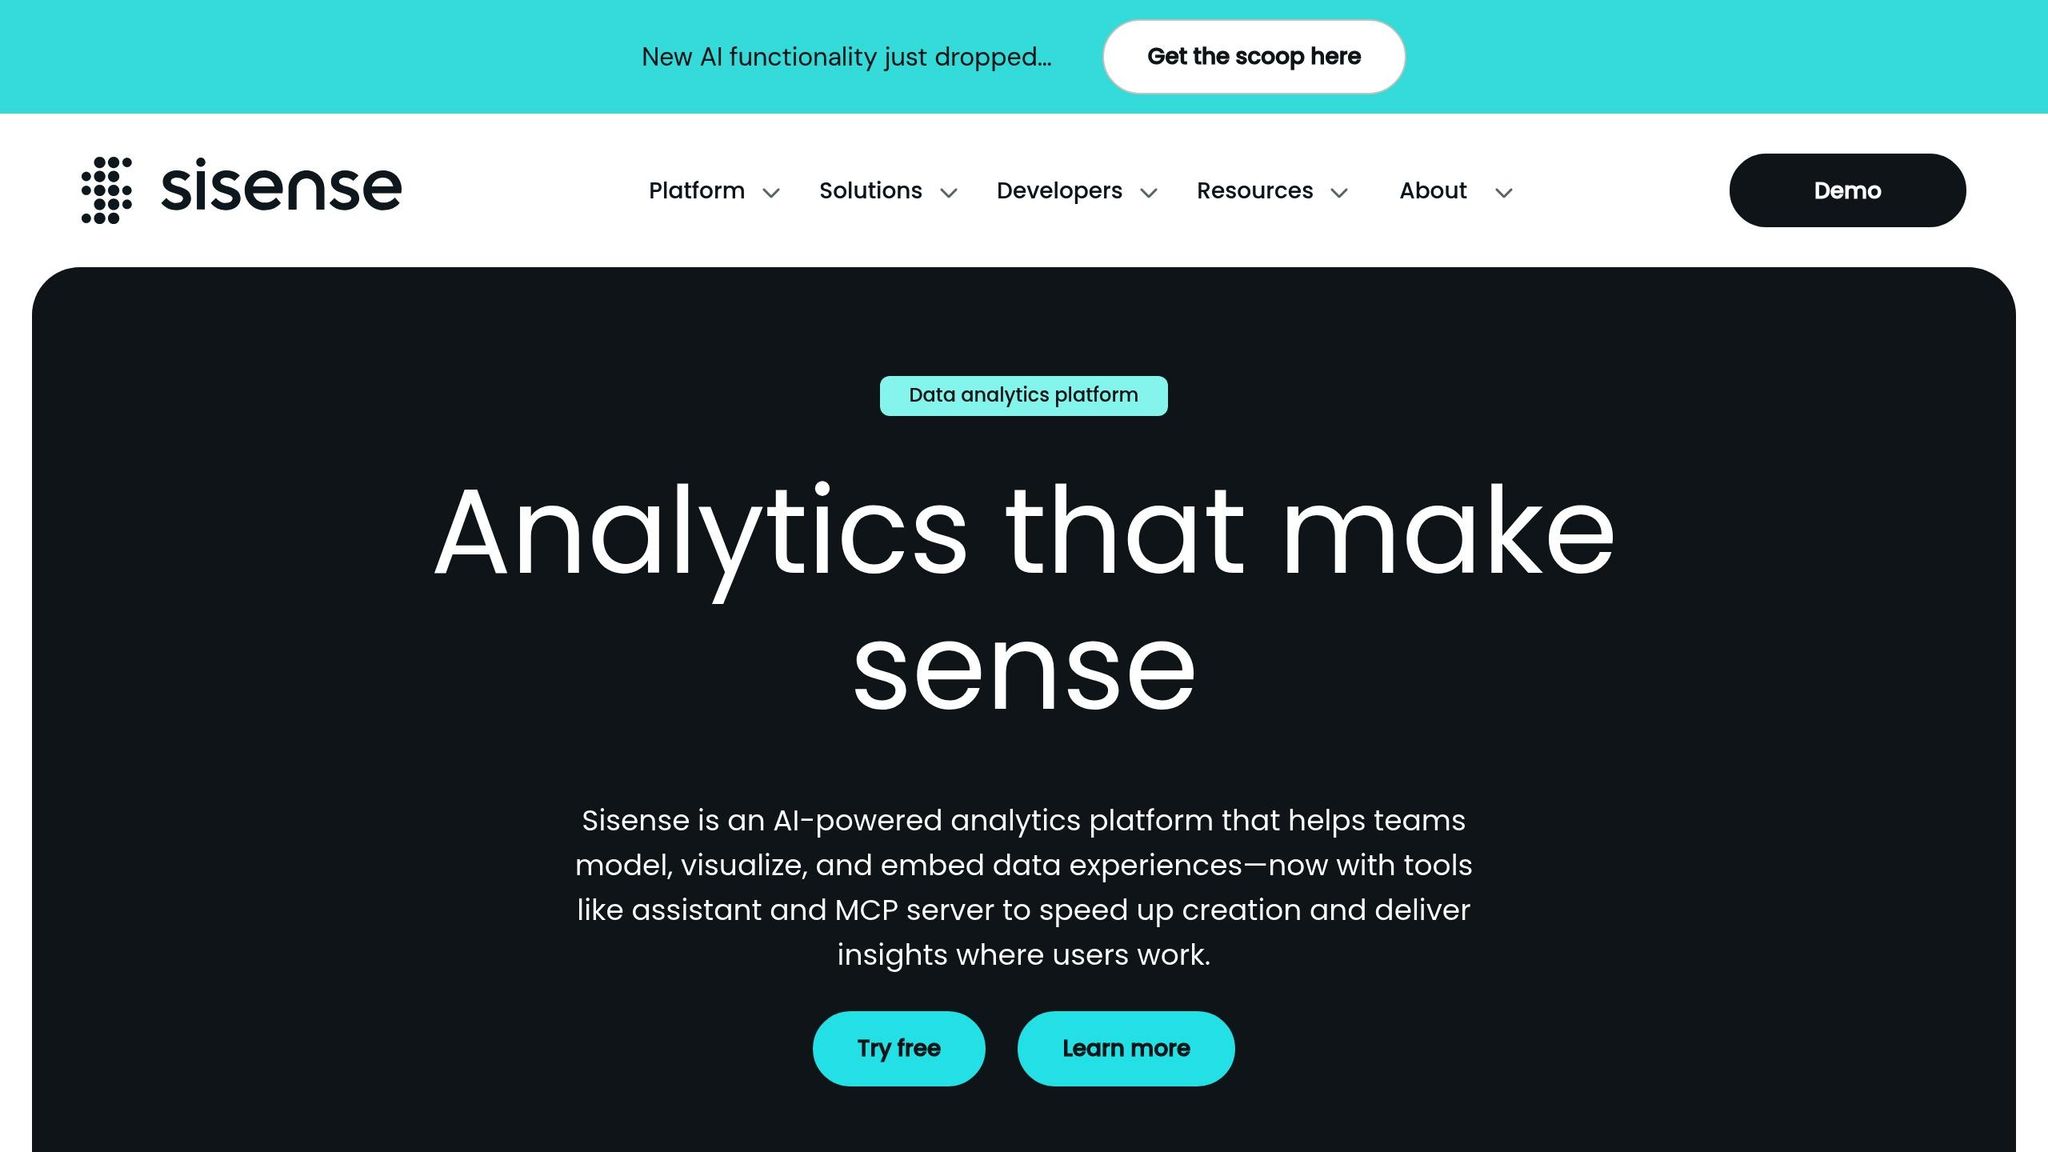
Sisense stands out in today’s fast-paced world of AI-driven analytics by enhancing data dashboards with AI-powered embedded analytics. This analytics platform combines AI-powered tools with embedded capabilities to streamline workflows. In May 2025, Sisense introduced the Sisense Intelligence Suite, a comprehensive set of AI features aimed at speeding up analytics processes - from data modeling to delivering actionable insights [27]. With over 500 five-star reviews and a solid 4.0/5 rating from PCMag, it has gained significant recognition [40,44].
AI and Natural Language Capabilities
Sisense’s AI Assistant and Analytics Chatbot simplify dashboard creation and allow users to interact with data through conversational queries. These tools leverage Generative AI Narratives to produce plain-language summaries and insights [40,42,43]. The platform also includes advanced predictive and diagnostic tools like Sisense Forecast for future value predictions, Trends for spotting statistical patterns, and Explanations for identifying key drivers behind data changes [42,43]. Tanya du Plessis, Chief Data Strategist at Bioforum, emphasizes its real-world impact:
"With Sisense's AI capabilities, we are able to easily translate complex data, streamline interpretation (identifying gaps and trends in the data), and identify key impacts with speed that is changing the way we can react... during clinical trials" [25].
These AI features integrate seamlessly with real-time monitoring functions, ensuring insights are both timely and actionable.
Real-Time Analytics and Insights
Sisense builds on its AI tools with Sisense Pulse, a feature that continuously monitors key performance indicators (KPIs) and alerts users to anomalies, enabling quick responses [26]. The platform connects to live data warehouses through more than 400 connectors, ensuring dashboards always reflect the latest information [24]. Devin Vyain, Senior Solutions Architect at Barrios, points out the operational advantages:
"We went from custom application development to the ability to rapidly change something on the dashboard and then publish it again in real‑time within the production environment - without sacrificing any of the security" [25].
Integration and Scalability
Built on an API-first architecture, Sisense offers over 450 APIs, making it easy to integrate with internal business systems or customer-facing applications [29]. It supports environments with 25+ tables and can handle up to 500 GB of data per server, scaling effortlessly to accommodate thousands of users [29]. The platform also meets rigorous security standards, holding certifications like SOC 2 Type II, ISO 27001, and ISO 27701 [24].
Deployment Options
Sisense provides flexible deployment options, including cloud, on-premises, and hybrid setups. Its embedded analytics can be integrated using iFrames or the Embed SDK [29]. The Pro plan even allows for full white-labeling to align with a company’s branding [24]. Pricing is based on a subscription model, with custom quotes tailored to factors like user count, data size, and hosting preferences. Estimated annual costs range from $40,600 for the Essential Plan to $327,000 for the Pro Plan [28]. This versatility makes Sisense a valuable option for organizations needing real-time insights across different environments.
Platform Comparison
Building on the platform reviews above, this section highlights the unique strengths of each tool in areas like AI capabilities, real-time data handling, integration, and deployment flexibility. These comparisons aim to help you evaluate which solution aligns best with your specific needs.
When it comes to AI features, platforms range from reactive tools that respond to natural language queries to proactive systems offering narrative insights when data patterns shift. For example, Tableau Pulse is designed to automatically surface metrics and suggest relevant questions when changes in data are detected [1].
Real-time data access is another key factor. Some platforms excel at connecting directly to live data warehouses without requiring data duplication, while others rely on scheduled extracts or face performance challenges with large datasets. For instance, Power BI's live query functionality is capped at 1GB per dataset in standard plans. In contrast, platforms with associative engines and live warehouse connections can handle larger data volumes more efficiently.
Integration options also play a significant role. Some platforms, like Power BI, are deeply tied to ecosystems such as Microsoft 365 and Azure, while others, like Qlik Sense, boast over 1,000 connectors to integrate seamlessly with diverse data sources. The ease of integration often determines how well a platform fits into an existing tech stack and its ability to pull data from multiple sources effectively.
Platform | AI Features | Real-Time Access | Integration Options | Deployment Methods |
|---|---|---|---|---|
Microsoft Power BI | Copilot, Quick Insights | Live query (Premium) | Microsoft 365, Azure, SQL | Azure only |
Tableau | Tableau GPT / Agent | Live or Extract | Salesforce, 100+ sources | Cloud, On-prem, Public Cloud |
Qlik Sense | Associative AI, AutoML | Real-time monitoring | 1,000+ connectors | SaaS, On-prem, Private Cloud |
Oracle Analytics Cloud | ML insights, NLP | Live connection | Oracle Cloud, various DBs | Oracle Cloud, Hybrid |
IBM Cognos Analytics | GenAI, AI Assistant | Real-time reporting | Multi-source integration | Cloud, On-prem |
Deployment flexibility also plays a critical role in meeting organizational requirements, particularly for security, compliance, or infrastructure needs. While some platforms are cloud-only, others support on-premises or hybrid configurations. Pricing can vary significantly, from $10/user/month for Power BI to $75/user/month for Tableau's advanced analytics features. Additionally, many modern tools emphasize no-code BI platforms, making analytics more accessible across organizations [19].
Conclusion
Choosing the right dashboard software requires a clear understanding of your organization's specific needs. For teams deeply embedded in the Microsoft ecosystem, Power BI offers seamless integration with Azure and Microsoft 365. If advanced visualizations are a priority, Tableau stands out as a great choice for data analysts. Meanwhile, Qlik Sense provides flexible, non-linear data exploration, making it ideal for organizations that need adaptability. For enterprises with complex governance and hybrid deployment needs, Oracle Analytics Cloud and IBM Cognos Analytics are reliable options. Each platform has its strengths, so aligning these with your organization's demands is key.
Compatibility with your existing IT infrastructure is another critical factor. Whether your organization requires a cloud-only, on-premises, or hybrid solution will often depend on security needs and current investments in data warehouses. Ensuring direct connections to data warehouses is essential for maintaining live, accurate dashboards.
Ease of use is equally important. Tools like Tableau and Power BI often come with a steeper learning curve, making them better suited for data analysts. In contrast, AI-driven platforms allow business users to create dashboards using natural language, reducing the need for technical expertise. Testing the tool with non-technical users during your evaluation phase can reveal whether it truly supports self-service analytics platforms. If basic tasks require significant training, the tool may not meet your accessibility goals.
Starting with a pilot project focused on high-impact KPIs can help demonstrate the tool's value. As Jerod Ridge, Director of Data Engineering at Lumen, shared:
"In the last year alone, we've eliminated almost 10,000 manual hours through Microsoft-powered automation. That's time we now spend creating business value" [2].
This kind of pilot not only showcases ROI but also builds momentum for broader adoption.
Lastly, governance is a cornerstone of effective dashboard implementation. From the outset, establish clear naming conventions, metric definitions, and update schedules. Creating a centralized semantic layer ensures consistency - avoiding confusion over metrics like "Active Users" - and builds trust in your analytics. By selecting a dashboard solution that aligns with your technical setup and organizational culture, you empower your team to make smarter, faster decisions.
FAQs
What should I look for when selecting dashboard software for my business?
When selecting dashboard software, it's important to ensure it fits your business needs seamlessly. Features like AI-driven analytics, including automated insights and anomaly detection, can make decision-making faster and reduce the need for technical expertise. Additionally, tools that offer customizable visualizations and real-time data updates allow you to monitor key metrics effectively and present data in a clear, impactful way.
Another critical aspect is a robust integration ecosystem. This ensures the software connects easily with your existing data sources - whether that's cloud services or ERP systems - helping you avoid data silos. Usability matters too. Look for features such as drag-and-drop design, collaboration tools, and an intuitive interface, which make the platform accessible to everyone, regardless of technical skill.
Finally, don't overlook scalability, security, and dependable support. These ensure the software can grow alongside your business while keeping your data safe and providing the assistance you need when challenges arise.
How does AI in dashboard software improve data analysis and decision-making?
AI-powered dashboard software takes raw data and turns it into insights you can actually use, thanks to machine learning and natural language processing. Imagine typing a simple question like, "What were our sales last week?" - and instantly getting charts, tables, or key metrics, no technical know-how required. This means no more tedious manual reports. Teams can dive into data on their own and make decisions faster.
But it doesn’t stop there. AI boosts decision-making with predictive analytics and real-time anomaly detection. It helps forecast trends so teams can plan ahead and sends alerts when something unexpected happens, allowing for quick responses. Plus, the system gets smarter over time, learning what users care about most. It suggests relevant insights, cutting through the noise and helping decision-makers zero in on what’s truly important. The result? A more efficient, strategic approach to tackling challenges.
What deployment options are available for modern dashboard software?
Modern dashboard software provides various deployment options to suit the unique needs of organizations. The most common setups include:
Cloud-based SaaS: Fully hosted online and accessible through a web browser, offering convenience and scalability.
On-premises installations: Deployed within a company’s own infrastructure, ideal for organizations with strict compliance or data security requirements.
Hybrid models: A mix of cloud and on-premises components, offering a balance between flexibility and control.
Platforms like Querio take it a step further by offering embedded analytics. This feature lets businesses integrate dashboards and AI-powered visualizations directly into their applications. The result? Users can access real-time insights without leaving their existing tools, all while ensuring strong security and governance.
Related Blog Posts


