Business Intelligence
AI-powered analytics workspace
Explore how AI-powered analytics workspaces enhance data analysis, streamline reporting, and improve decision-making across businesses.
AI-powered analytics workspaces are transforming how businesses handle data. These platforms combine artificial intelligence with user-friendly tools, enabling teams to analyze, visualize, and report data effortlessly. They allow users to ask questions in plain language, automate visualizations, and offer predictive insights - all while maintaining strict data security and compliance standards.
Key Features:
Natural language data querying tools: Ask questions like "What were last quarter's sales?" and get instant answers.
Predictive Modeling: Forecast trends and detect anomalies using machine learning.
Automated Dashboards: Real-time updates and alerts for significant changes.
Data Security: Role-based access, encryption, and audit trails ensure compliance with regulations like SOC 2 Type II.
Why It Matters: Businesses face increasing data complexity and demand for faster insights. AI-powered platforms address these challenges by simplifying analytics, reducing reliance on IT teams, and enabling faster decision-making. For industries like SaaS, fintech, and e-commerce, this is especially critical for maintaining competitiveness while ensuring regulatory compliance.
Querio, an AI-native platform, stands out with features like conversational data analysis, integration with major data platforms, and customizable dashboards. Starting at $14,000/year, Querio offers a scalable, secure solution for U.S. businesses looking to modernize their analytics.
Next Steps: To implement an AI-powered workspace, start by connecting data sources securely, create tailored dashboards for teams, and leverage AI tools for deeper insights. This approach ensures faster, more accurate decisions across your organization.
Modern Analytics, AI, and Governance at Scale with Microsoft Fabric
Core Features of AI-Powered Analytics Workspaces
AI-powered analytics workspaces bring a level of capability that traditional BI tools simply can't match. They combine accessibility, actionability, and security to create a seamless experience, even for those without technical expertise. Let’s break down the essential features of modern business intelligence tools that set these workspaces apart.
Natural Language Querying and Predictive Modeling
One of the standout features is the ability to ask questions in plain English and get immediate, accurate answers. Forget about complicated SQL queries or hunting through endless menus. Users can type or speak queries like, "What was our customer churn rate in Q3?" or "Which marketing campaigns generated the most revenue last month?" and instantly receive detailed visualizations and insights.
These systems go beyond simple queries. Advanced AI models understand context, handle follow-up questions, and interpret ambiguous requests. For instance, if you ask about "last quarter's performance", the platform knows you’re likely looking for a mix of revenue figures, key metrics, and comparisons - not just one isolated number.
Predictive modeling adds another layer of value. By analyzing historical data, machine learning algorithms can forecast future trends. Sales teams can identify which leads are most likely to convert, while operations teams can plan for inventory needs or staffing adjustments. What’s more, the AI continuously refines its predictions as new data becomes available.
For businesses in fast-moving industries like e-commerce or fintech, the real-time processing trends capabilities are a game-changer. With predictive insights that update automatically as new data flows in, companies can adapt quickly to shifting market conditions and stay ahead of the competition.
Automated Data Visualization and Dashboards
Building on natural language capabilities, automated visualization tools take the guesswork out of creating charts and graphs. These platforms automatically pick the best visual format for your data and questions, making insights easier to understand.
Dashboard automation is another leap forward. These systems monitor data in real time and update dashboards automatically. They can even spot significant changes - like a sudden increase in customer acquisition costs or a drop in website conversion rates - and flag them for attention. In some cases, they’ll even suggest possible causes for the changes.
This is especially useful for executive reporting. C-suite leaders need high-level summaries without getting buried in the details. AI-powered workspaces can generate concise reports that highlight key performance indicators, identify problem areas, and propose strategic actions based on data trends.
The customization options are also worth noting. Different roles within a company require different views of the same data. For example, sales managers might focus on pipeline metrics, while CFOs prioritize financial performance. These systems can tailor dashboards to match each user’s role, ensuring everyone sees the most relevant information for their needs.
Data Governance and Security
Beyond intelligence and visuals, these workspaces excel in data governance and security, which are critical for protecting sensitive information. For US businesses handling customer data, financial details, or proprietary insights, these platforms offer a comprehensive approach to data protection.
Role-based access controls ensure users only access data relevant to their roles. A marketing analyst might see campaign performance metrics but not sensitive financial data. Permissions can be fine-tuned down to specific fields or timeframes, offering precise control.
Audit trails log every interaction with the data - who accessed it, when, and what they did. This creates a full record for compliance purposes and helps identify any unusual or unauthorized activity.
Encryption standards safeguard data both in transit and at rest, meeting strict regulatory requirements. For industries with stringent compliance needs, these platforms come with built-in support for frameworks like SOC 2 Type II, GDPR, HIPAA, and PCI DSS.
Data lineage tracking adds another layer of transparency by showing where information originates and how it’s been processed. This is essential for maintaining data quality and meeting regulatory demands for clear documentation of data sources and transformations.
These security measures, combined with intuitive interfaces, strike a balance between usability and protection. Teams can confidently analyze and act on data, knowing that robust safeguards are working quietly in the background.
How Querio Changes Business Intelligence
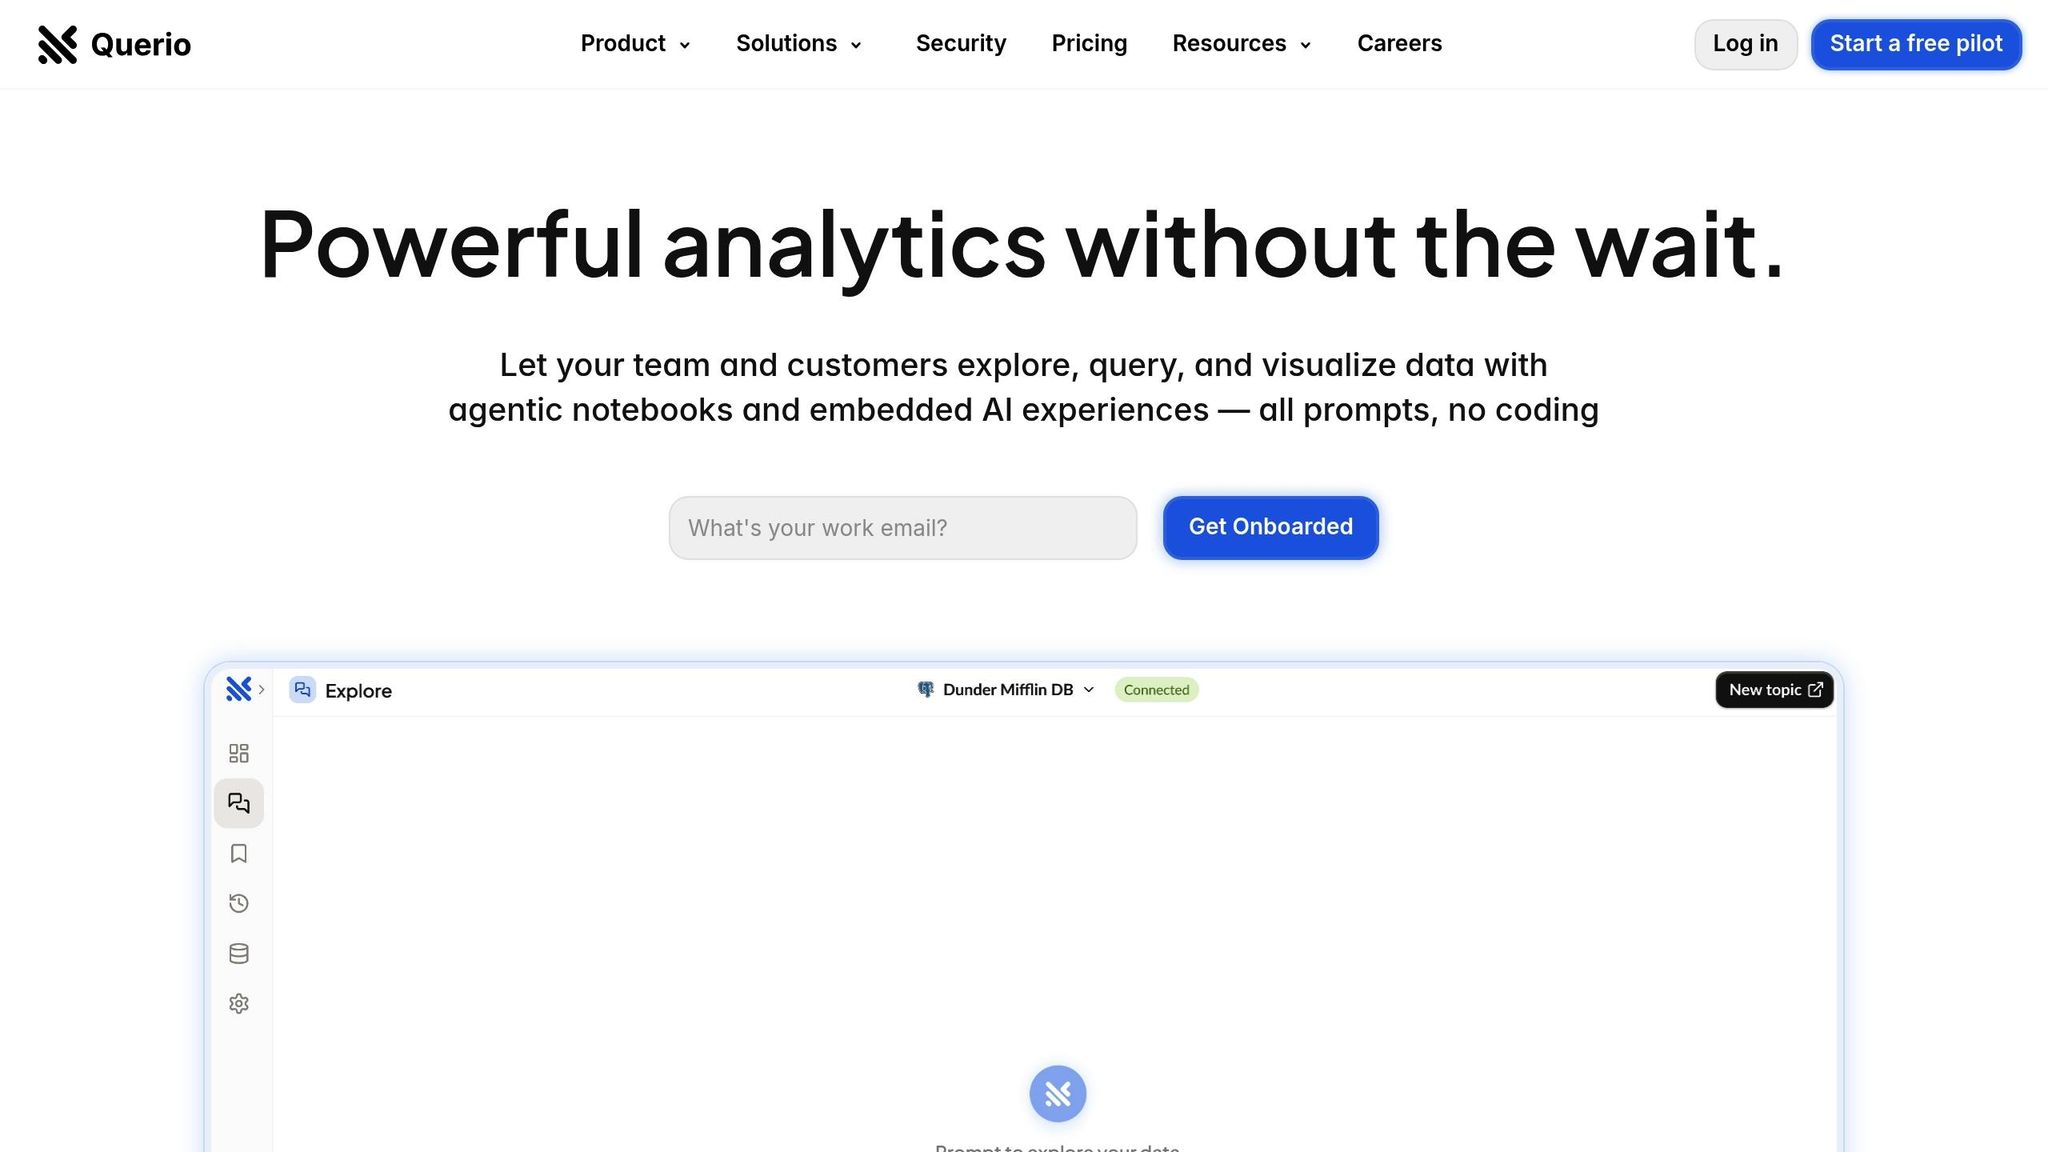
Querio takes business intelligence to a whole new level by focusing on conversational data analysis. By doing so, it reshapes how teams work with data, making advanced analytics easy to use for everyone - from marketing managers to top executives.
With seamless connections to live data warehouses and instant insights powered by natural language processing, Querio removes the typical delays in decision-making. For example, some U.S. companies have reduced their routine reporting time by as much as 90%. These advancements pave the way for the more detailed features described below.
Key Capabilities of Querio's AI-Native Workspace
Querio stands out with its direct integration into major data platforms like Snowflake, BigQuery, and Postgres. These read-only connections ensure data stays up-to-date and secure without needing to be duplicated or moved.
The conversational AI agent transforms how users interact with data, enabling even non-technical team members to conduct analyses that once required specialized skills.
For those who need more advanced tools, Querio offers AI Python notebooks. These allow users to handle both simple queries and complex data science tasks directly within the platform, making it versatile for various analytical needs.
Another standout feature is the Centralized Context Layer. This lets data teams define business logic, metrics, and table relationships just once, ensuring consistency across the organization. For instance, a financial services company using this feature cut the time needed for sales summaries from 4 hours per seller to just 15 minutes - a 93.75% reduction [1]. This freed up their sales team to focus on client relationships and revenue growth.
Simplified Reporting and Executive Dashboards
Querio’s features naturally extend to creating simplified reports and dashboards for executives. The platform’s drag-and-drop dashboard builder makes it easy to design and schedule reports, ensuring stakeholders get regular updates without needing heavy technical support. Users can save visualizations, arrange them logically, and add context to create detailed, user-friendly reports.
Executives benefit from dashboards that not only highlight key performance indicators but also flag significant changes and provide the necessary context for making strategic decisions.
Querio also supports embedded analytics tools, which allows businesses to include customer-facing insights directly in their products. This is especially useful for SaaS companies and consulting firms that rely on data to enhance their services.
In fact, financial services firms using Querio have reported annual savings of around $45,000 by enabling non-technical teams to handle their analytics independently [1].
US-Localized Compliance and Pricing
For organizations in the U.S., Querio ensures compliance with key standards like SOC 2 Type II certification. It also includes enterprise-grade security features such as granular access controls and detailed audit trails, helping businesses make decisions securely and efficiently.
Querio’s pricing model is designed to be predictable. The Core Platform starts at $14,000 per year, which includes one database connection, 4,000 prompts per month, and unlimited viewer users. Add-ons are available for additional features: the Dashboards Add-On costs $6,000 per year, each extra database connection is $4,000 per year, and the Data-Pipelines subscription is $10,000 per year for up to three pipelines. Monthly billing options start at $1,100 per month [1].
This straightforward pricing structure helps U.S. businesses plan their budgets confidently. By avoiding usage-based fees that can grow unpredictably, Querio makes analytics accessible across all levels of an organization.
How to Implement AI-Powered Analytics
Implementing an AI-powered analytics workspace isn't just about adopting new technology - it's about taking a thoughtful, step-by-step approach to ensure success. The process typically unfolds in three key phases, each critical to transforming how your organization handles data.
Connecting Data Sources and Ensuring Security
The backbone of any AI-powered analytics platform is its ability to securely connect to your existing data systems. For many U.S. businesses, data is scattered across cloud storage, traditional databases, and hybrid environments, making integration the first challenge to tackle.
Start by auditing your current data sources. List out where critical data resides - whether in cloud warehouses, on-premise systems, or elsewhere. This inventory will help you prioritize which connections to establish first, focusing on those with the biggest business impact.
When setting up these connections, always prioritize security. Use secure, read-only access to ensure your source systems remain unaffected while still enabling real-time data updates. For sensitive data, such as financial or healthcare information, consider using VPNs or private network access. Dedicated service accounts with minimal permissions often strike the right balance between functionality and security.
Encryption is non-negotiable. Ensure all data is encrypted both in transit and at rest, especially when dealing with customer information or proprietary metrics that could affect competitive positioning. Once your data connections are secure, you can move on to turning that raw data into actionable insights.
Building Dashboards and Automating Reports
With your data connections in place, the next step is creating dashboards that provide immediate value to different parts of your organization. Start small, focusing on specific business functions to help teams quickly see the platform’s potential.
Executive dashboards should spotlight key performance indicators (KPIs) that influence high-level decisions. Metrics like revenue growth, customer acquisition costs, and operational efficiency are ideal here. Automate these dashboards to refresh regularly and include alerts for any significant changes.
For operational teams, tailor dashboards to their daily workflows. For example, sales teams might need tools to track pipeline health and conversion rates, while marketing teams benefit from insights into campaign performance and lead quality. Make sure these dashboards are actionable - users should be able to take immediate steps based on the data they see.
Automating reports can save countless hours of manual work. Schedule these reports strategically: daily reports should be ready before the workday begins, weekly summaries should arrive on Monday mornings, and monthly executive reports should be ready by the second business day of the month. This ensures decision-makers always have up-to-date information at the right time.
If you’re in the SaaS space, consider embedded analytics for customer-facing applications. Providing clients with real-time insights into their usage or performance directly within your product can add significant value.
Modern platforms with drag-and-drop functionality make dashboard creation accessible even to non-technical users. Train key team members to build and modify dashboards themselves, avoiding bottlenecks caused by reliance on IT departments.
Using AI for Faster Insights
Once your dashboards and reports are up and running, it’s time to tap into AI features to accelerate decision-making. This phase shifts the focus from static reporting to more dynamic, data-driven exploration.
Natural language querying is one of the most transformative tools available. Instead of relying on technical skills like SQL, team members can simply type or ask questions like, “What caused the 15% increase in customer churn last quarter?” The platform responds with detailed analyses and visualizations, making data exploration more intuitive and accessible.
Encourage teams to dig deeper by asking follow-up questions. AI-powered platforms excel at maintaining context, enabling users to uncover insights through an iterative process.
Predictive modeling is another game-changer. Use it for forecasts that directly impact your business, such as revenue projections, demand planning, or customer lifetime value estimates. Start with straightforward models that have clear metrics for success - this makes it easier to demonstrate value early on.
Leverage built-in AI tools for both simple and advanced analyses. While data analysts can dive into complex statistical work, business users can stick to conversational queries, all within the same platform. This flexibility ensures everyone can engage with the data at their own level.
Keep an eye on usage patterns to see which AI features are driving the most value. Teams that embrace conversational analysis often experience the biggest productivity boosts, while those relying solely on traditional dashboards may miss out on the platform’s full potential.
The goal of AI-powered analytics isn’t to replace human judgment but to enhance it. By empowering more people to work with data effectively, you create a culture of informed decision-making that benefits the entire organization.
Old BI vs. AI-Powered Analytics Workspaces
Taking a closer look at traditional BI tools compared to AI-powered analytics workspaces reveals just how much the landscape of data management and analysis has shifted. This evolution reflects the growing need for faster, more flexible systems that can keep up with today’s complex data environments. For U.S. organizations navigating these challenges, understanding the differences between these approaches is essential for staying competitive in an increasingly data-driven world.
Key Differences in Features and Benefits
Traditional BI tools were built for simpler times - when data environments were smaller and less dynamic. These systems often depended on IT specialists to generate reports, requiring long implementation cycles and significant technical expertise to manage dashboards and visualizations.
AI-powered analytics platforms, on the other hand, have redefined the game. They deliver insights at lightning speed, using natural language queries that allow users to interact with data as if they were having a conversation. This means teams can get the answers they need quickly, making it easier to respond to time-sensitive decisions.
The user experience has also evolved dramatically. Traditional BI systems often required extensive training, which limited their use to a select group of specialists. Modern AI tools, in contrast, are designed to be user-friendly, enabling professionals like marketers, sales leaders, and executives to explore data independently - no technical background required.
Automation is another game-changer. Older systems relied on manual updates for reports and visualizations, which could be both time-consuming and error-prone. AI-powered platforms not only automate these processes but also learn from user interactions, surfacing insights proactively and even suggesting next steps.
Predictive analytics is now a standard feature in AI-powered workspaces. These platforms can forecast trends, detect anomalies, and recommend actions - all without needing a dedicated data science team. For organizations, this capability is invaluable in anticipating challenges and seizing opportunities.
Governance has also seen a major upgrade. Modern platforms come equipped with built-in tools for tracking data sources, documenting transformations, and managing user access. These features are particularly important for companies adhering to strict regulations like GDPR or CCPA.
Cost is another area where the two approaches diverge. Traditional BI systems often required hefty upfront investments in software licenses, hardware, and maintenance. In contrast, most AI-powered platforms operate on a subscription basis, offering scalable pricing that makes advanced analytics more accessible to organizations of all sizes.
Data integration is far less cumbersome with AI-powered tools. Traditional systems often relied on complex ETL (Extract, Transform, Load) processes, which could be slow and labor-intensive. Modern platforms simplify this step by connecting directly to data sources through APIs and pre-built connectors.
Visualization capabilities have also taken a leap forward. While older systems were limited to basic charts and tables, AI-powered platforms can recommend the best visualization formats based on the data and user intent. They also provide interactive dashboards that adapt seamlessly to different screen sizes and user preferences.
For businesses still relying on traditional BI, these limitations become increasingly evident as data volumes grow and demands evolve. In fast-paced industries like e-commerce, fintech, and healthcare, the inability to adapt quickly to market changes or new regulations can be a serious disadvantage.
AI-powered analytics workspaces are changing the game by democratizing data access and enabling faster, more informed decision-making across entire organizations. The table below summarizes the key differences between these two approaches.
Comparison Table: Traditional BI vs. AI-Powered Analytics Workspaces
Feature | Traditional BI | AI-Powered Analytics Workspaces |
|---|---|---|
Query Method | SQL or proprietary query languages | Natural language with conversational interface |
Implementation Time | Longer deployment cycles | Rapid deployment |
User Training | Extensive technical training required | Minimal training with intuitive interface |
Report Creation | IT-dependent, slower turnaround | Self-service reporting, quick turnaround |
Data Refresh | Scheduled updates | Near real-time updates |
Predictive Analytics | Often required separate tools | Built-in machine learning capabilities |
Mobile Access | Limited functionality | Full functionality with responsive design |
Collaboration | Email-based sharing | Real-time, integrated collaboration features |
Governance | Manual processes, limited automation | Automated data lineage and audit trails |
Scalability | On-premise hardware dependent | Cloud-native with auto-scaling |
Cost Model | High upfront and maintenance fees | Scalable, subscription-based pricing |
Customization | Requires development resources | Drag-and-drop, no-code configuration |
Conclusion: Transforming Business Intelligence with Querio
Switching from traditional business intelligence (BI) to AI-powered analytics marks a major shift in how organizations make decisions. Querio's user-friendly natural language interface and automated reporting make it easier than ever for businesses to move away from outdated BI systems.
Key Takeaways for Business Leaders
AI-powered analytics workspaces bring real, measurable benefits, cutting the time it takes to generate insights from days to just seconds. Querio simplifies this transition with a subscription model starting at $14,000 per year. It also offers unlimited viewer access and ensures strong governance with SOC 2 Type II compliance.
This shift toward data democratization changes how decisions are made across organizations. Imagine marketing teams diving into customer behavior data without waiting on IT, finance teams generating detailed reports on their own, and executives exploring KPIs through simple conversational queries. With Querio, every department becomes more agile and better equipped to act on data.
Next Steps for Integrating Querio
Ready to bring Querio into your operations? Start with a pilot program involving key stakeholders from multiple departments. This allows teams to experience natural language querying tools firsthand. Querio connects directly to your existing data warehouses with read-only access, eliminating the need for data duplication or complex ETL processes.
The context layer is key - it’s where joins, metrics, and business definitions are set up once and used consistently across the organization. If executive reporting and KPI tracking are priorities, consider adding the dashboard feature early in the process. This enables drag-and-drop visualizations that update automatically with live data.
FAQs
How does natural language querying make data analysis easier for non-technical users in AI-powered analytics workspaces?
Natural language querying makes data analysis more accessible by letting users ask questions in plain, everyday language - no need for complicated codes or technical know-how. This means anyone, even without a technical background, can dive into data and uncover insights without waiting for IT or data experts to step in.
By connecting human language with technical systems, this approach speeds up the process of gaining insights and encourages broader participation in decision-making. It allows teams, regardless of their technical expertise, to tap into the power of data with ease.
How does an AI-powered analytics workspace ensure data security and regulatory compliance?
An AI-powered analytics workspace prioritizes data protection and regulatory compliance through a combination of advanced security measures. These include end-to-end encryption, which ensures data remains secure during both transfer and storage, role-based access controls that limit access strictly to authorized users, and data masking to shield sensitive information from exposure. On top of that, the platform actively monitors system activity to quickly identify and respond to any unusual behavior.
To meet regulatory requirements, the workspace aligns with major standards like GDPR, HIPAA, and CCPA. It also leverages automated security protocols to minimize risks, prevent configuration errors, and maintain centralized oversight of data governance. These capabilities allow businesses to analyze their data securely while keeping privacy at the forefront.
How can businesses evaluate if investing in an AI-powered analytics workspace like Querio is the right choice for their needs?
To determine if an AI-powered analytics workspace like Querio is worth the investment, businesses should begin by pinpointing specific challenges or opportunities where AI could deliver measurable results. These could range from simplifying workflows to enhancing decision-making or speeding up data-driven insights. Connecting these potential gains to your company’s strategic goals is a critical first step.
Once that’s clear, set well-defined objectives and key performance indicators (KPIs) to track success. These might include metrics like increased revenue, lower operational costs, or higher customer satisfaction. Compare your current performance data with the expected outcomes after implementing AI tools to estimate the potential return on investment (ROI). Don’t forget to factor in elements such as how prepared your team is to embrace AI solutions and the long-term effects on productivity and efficiency.
By zeroing in on tangible improvements and ensuring AI aligns with your business goals, you’ll be better equipped to decide if a platform like Querio is the right fit.
Related Blog Posts


