Business Intelligence
best AI BI tools 2026
Compare 2026 AI-powered BI platforms: features, pricing, governance, and best fits for startups to enterprise teams.

AI-powered business intelligence (BI) tools are transforming how teams interact with data. In 2026, the focus is on tools that combine speed, accuracy, and governed logic, allowing users to ask questions in plain English and receive actionable insights instantly. Here’s a quick overview of the top contenders:
- Querio: Offers live data querying, inspectable SQL/Python generation, and strong governance features. It has a free plan, and Core is $2,499/month.
- Microsoft Power BI with Copilot: Integrates with the Microsoft ecosystem, generates DAX formulas, and provides AI-driven summaries. Starts at $24/user/month for Premium Per User.
- Tableau with AI Features: Known for visual storytelling, it introduces AI tools like Tableau Agent and Tableau Pulse. Pricing begins at $15/user/month.
- ThoughtSpot: Focuses on non-technical users with its search-first interface and Spotter AI assistant. Costs range from $25/user/month to custom enterprise pricing.
- Metabase: A budget-friendly option for startups, featuring Metabot for natural language queries. Free open-source tier available, with cloud plans starting at $85/month.
Quick Comparison
| Tool | Key Features | Pricing | Best For |
|---|---|---|---|
| Querio | Governed SQL, live data querying | Free plan; Core $2,499/mo | Teams needing trusted analytics |
| Power BI | DAX generation, Microsoft integration | $24/user/month (PPU) | Microsoft-focused organizations |
| Tableau | AI tools (Agent, Pulse), visual dashboards | $15/user/month | Visual storytelling |
| ThoughtSpot | Search-first AI, Spotter assistant | $25–$50/user/month | Non-technical users, enterprises |
| Metabase | Natural language SQL, budget-friendly | Free–$85/month | Startups, small teams |
Each tool has strengths tailored to specific needs, from startups to enterprise-level organizations. Keep reading for a deeper dive into features, pricing, and use cases.
::: @figure 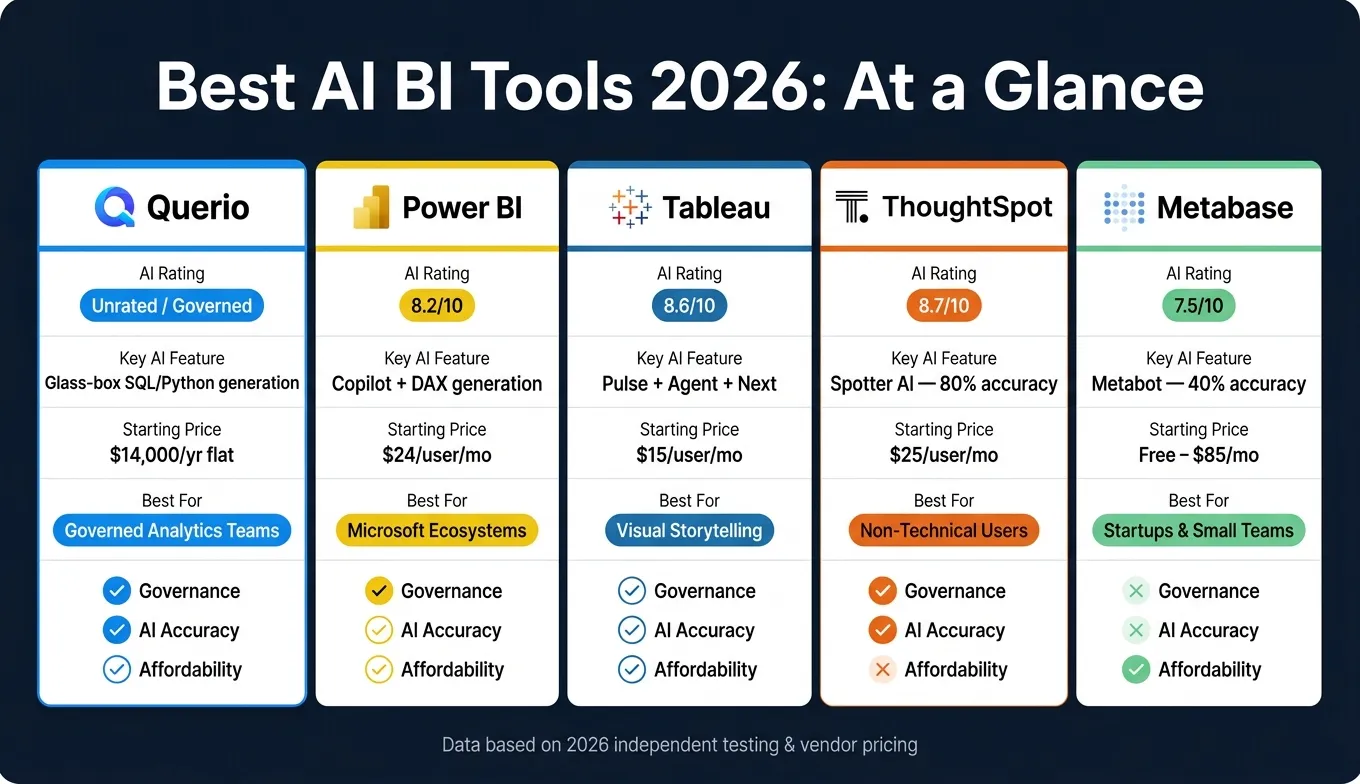 {Best AI BI Tools 2026: Side-by-Side Comparison}
:::
{Best AI BI Tools 2026: Side-by-Side Comparison}
:::
1. Querio
Querio is an AI-powered analytics workspace designed for teams that need quick, precise insights from their data - without the hassle of writing SQL. It connects directly to your existing data warehouse and generates real, inspectable SQL and Python code for every query. This approach ensures transparency and flexibility, laying the groundwork for its advanced analytics features.
AI Capabilities
Querio stands out by offering a "glass box" approach, unlike typical AI tools that work as a "black box." This means every result is accompanied by the underlying SQL or Python code, giving analysts the ability to review, edit, and repurpose the logic. Its AI Python Agents go beyond basic queries, handling complex multi-step analyses. For instance, they can automatically trace the root cause of a KPI drop by analyzing changes across dimensions and time periods. Plus, any manual code edits are immediately reflected in the platform's visualizations, thanks to its responsive interface.
Data Connectivity
Querio's architecture eliminates the need for ETL pipelines by querying your data live, using a zero-copy, read-only model. This ensures your data stays in place, untouched. It supports a wide range of warehouses, including:
- Snowflake
- Google BigQuery
- Amazon Redshift
- ClickHouse
- PostgreSQL
- MySQL
- MariaDB
- Microsoft SQL Server
For product teams, Querio also offers an SDK and signed embeds, making it possible to integrate "Ask your data" functionality directly into SaaS applications [6].
Governance and Trust
With Querio's Shared Context Layer, teams can define key metrics (like "Net Sales" or "Churn") and establish consistent business logic and table joins. This ensures that every query aligns with a unified set of definitions, fostering trust in the data.
Querio also prioritizes data privacy: customer data is never used to train external AI models [6]. On top of that, it meets SOC 2 Type II compliance standards, providing a secure analytics environment.
Scalability and Performance
Querio's pricing is simple and predictable, with no per-seat licensing. Here's the breakdown:
- Free plan: $0, with unlimited users, unlimited data connections, dashboards and 500 AI credits a month.
- Core plan: $2,499 per month (or $25,000 per year billed annually), with 10,000 AI credits a month, SSO and API access.
- Enterprise plan: Custom pricing with a custom AI credit allowance.
For teams with strict infrastructure needs, Querio also offers on-prem deployment as an Enterprise add-on. Spending caps and usage alerts help teams scale without unexpected costs.
sbb-itb-284a532
2. Microsoft Power BI with Copilot
Microsoft Power BI with Copilot is an excellent option for businesses already using the Microsoft ecosystem. Powered by GPT-4o, it brings generative AI into the reporting process, enabling users to create dashboards, write DAX formulas, and summarize data in plain English. By early 2026, Microsoft expanded the Copilot prompt limit from 500 to 10,000 characters [8][10], allowing for more detailed and nuanced queries. Let’s dive into how its AI features make report creation smoother and more efficient.
AI Capabilities
Copilot simplifies tasks that typically require technical expertise. It can generate DAX formulas, create complete report pages based on text input, and produce executive summaries of up to 10,000 characters using the Narrative visual [8][11]. In independent tests, Copilot achieved an 80% success rate on its first attempt at DAX generation (12 out of 15 cases) [1].
"The DAX generation is the real time-saver. Instead of memorizing complex DAX... you describe the calculation you want." - ToolsRadar [1]
However, while Copilot is efficient, AI-generated layouts may need 20–30 minutes of manual adjustments [1], which users should consider when planning their workflow.
Data Connectivity
Power BI’s data connectivity complements its AI capabilities by offering extensive access to various data sources. It connects seamlessly to hundreds of platforms, including SQL Server, PostgreSQL, MySQL, Salesforce, Azure services, and SharePoint [12]. Its integration with Microsoft Fabric and OneLake is particularly noteworthy. The Direct Lake storage mode allows Power BI to query data directly from OneLake without requiring traditional refresh cycles, combining the speed of Import mode with the freshness of DirectQuery [13][10].
As of March 2026, Translytical Task Flows became generally available, enabling users to write data back to Fabric SQL databases and lakehouses directly from within reports [13][10]. This feature adds a layer of interactivity and efficiency to data workflows.
Governance and Trust
Power BI equips model owners with robust control over how Copilot interacts with their data. Using the "Prep data for AI" toolset, authors can define AI schemas, set verified answers for recurring queries, and provide instructions to guide Copilot’s interpretation of models [7][8]. The "Approved for Copilot" feature highlights trusted models in search results and removes friction warnings for end-users [9].
Microsoft also assures users that customer data is not used to train its underlying LLMs [14], and the platform adheres to strict compliance standards, including SOC 2, HIPAA, and GDPR. These governance features ensure that Power BI meets enterprise-level demands with confidence.
Scalability and Performance
To use Copilot, organizations need a paid capacity tier - either Fabric F2 or higher or Power BI Premium P1 or higher [8]. Here’s a breakdown of the pricing tiers:
| License Tier | Price | Copilot Access |
|---|---|---|
| Power BI Pro | $14/user/month | No |
| Power BI Premium Per User (PPU) | $24/user/month | Yes |
| Fabric/Premium Capacity (F2/P1+) | From $4,995/month | Yes (org-wide) |
Performance remains reliable for most standard workloads. However, complex DAX calculations on large datasets - such as those with 2.3 million rows - can take 15–20 seconds to render [1]. For teams handling massive data volumes, the Direct Lake mode in OneLake significantly reduces processing time, making it a practical choice for scaling AI-enhanced reporting across large organizations.
3. Tableau with AI Features
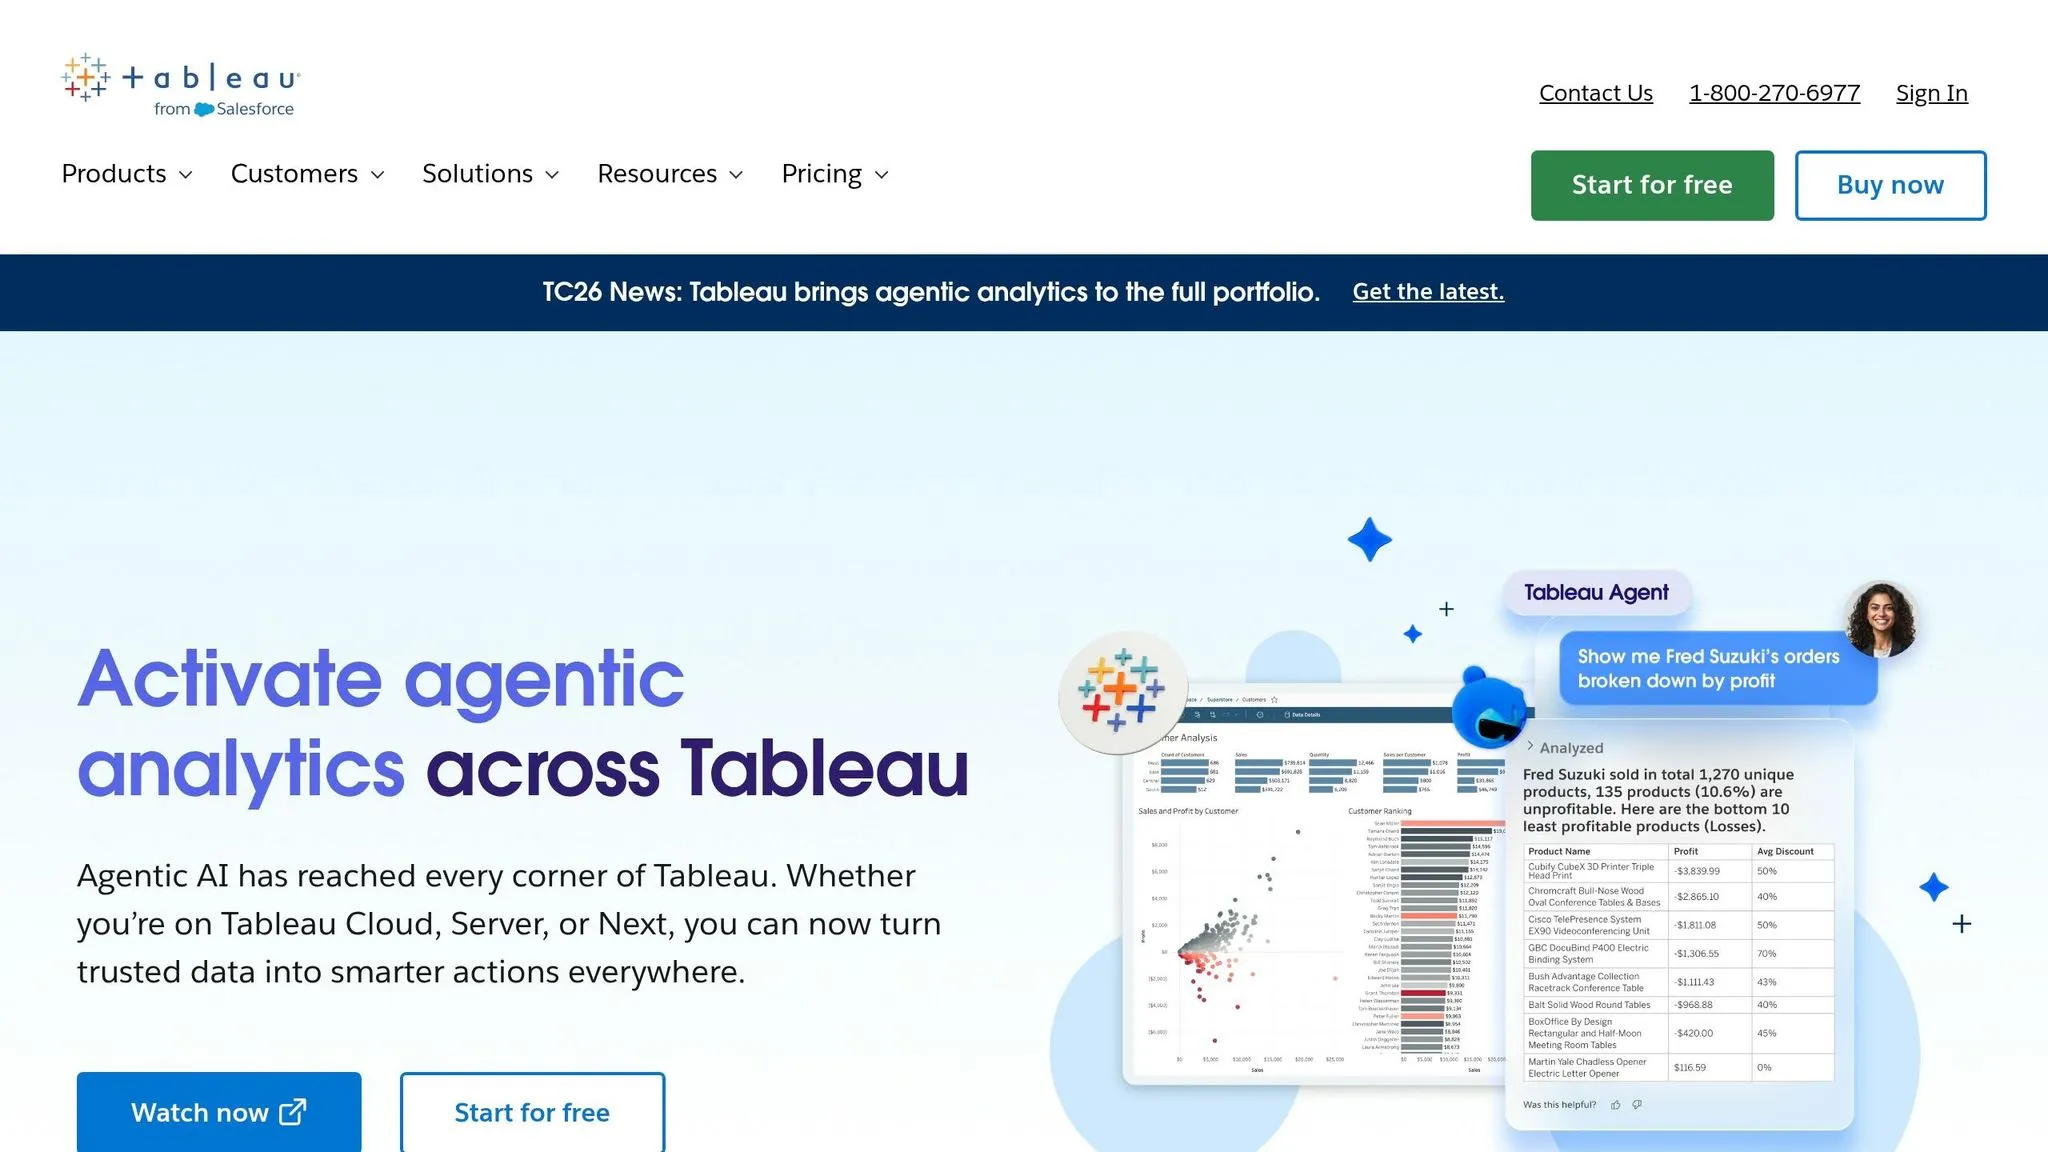
Tableau, long recognized as a leader in data visualization, is stepping up its game in 2026 by diving deeper into AI-driven analytics. With an impressive 8.6/10 rating from Technova Partners in May 2026 and a 16-year streak in the Gartner Magic Quadrant [3], Tableau is evolving beyond its traditional role. It's transforming into what’s being called an "agentic analytics platform", aiming to deliver faster and more dependable insights in an increasingly AI-focused landscape.
AI Capabilities
Tableau now offers three standout AI tools: Tableau Agent, Tableau Pulse, and Tableau Next. Here's a closer look at what they bring to the table:
- Tableau Agent: Enables conversational data exploration, making it easier to interact with data using natural language.
- Tableau Pulse: Focused on real-time alerts, it monitors key performance indicators (KPIs) and sends personalized notifications through platforms like Slack, Teams, or email. During testing, it flagged a 23% week-over-week revenue drop within just four hours of the data being uploaded to a warehouse [1].
- Tableau Next: This tool handles automated data tasks with features like Concierge for root cause analysis, Inspector for spotting anomalies, and Data Pro for preparing data automatically.
These tools aim to simplify decision-making by cutting down the time and effort needed to analyze complex data. However, some challenges remain. For instance, Tableau's natural language interface successfully answered only 11 out of 20 complex queries during testing [1], struggling with tasks like intricate date calculations and nested comparisons.
"The Agentic Analytics Platform builds on Tableau's established functionality for existing users but evolves Tableau into a knowledge engine that can provide trusted context to enable human and agentic decisions." - Matt Aslett, Analyst, ISG Software Research [15]
Data Connectivity
Tableau continues to shine with its ability to connect to over 100 native data sources, ranging from cloud warehouses to spreadsheets and on-premises databases [3]. The introduction of Tableau MCP (Model Context Protocol) in 2026 allows external AI agents to query Tableau's governed data. Additionally, integration with Salesforce Data Cloud enables Tableau Next to unify siloed data into real-time, conversational visualizations [16]. This level of connectivity ensures that Tableau can provide consistent and reliable data, backed by strong governance.
Governance and Trust
Governance has been a key focus for Tableau in 2026. The platform now includes Tableau Semantics, a governed semantic layer that ensures every metric has a single, consistent definition [17]. Agentic workflows operate through the Agentforce Trust Layer, which secures data and enforces compliance. Later this year, Tableau plans to roll out a Command Center to help organizations manage AI agent deployments at scale [15].
Scalability and Performance
Tableau's pricing structure is designed to support businesses of all sizes, offering flexibility and scalability:
| License Tier | Price |
|---|---|
| Viewer | $15/user/month |
| Explorer | $42/user/month |
| Creator | $75/user/month |
| Tableau+ (Enterprise Creator) | $115/user/month |
To access Tableau Agent and agentic workflows, users will need the Tableau+ tier at $115 per user, per month [16]. The full knowledge engine is set to launch in June 2026, with the Command Center arriving in the fall [15].
4. ThoughtSpot
ThoughtSpot stands out as a business intelligence (BI) tool tailored for users who need quick, insightful answers without requiring SQL expertise or data science know-how. In 2026, it continues to make waves in the AI BI space, earning an impressive 8.7/10 rating for AI Business Intelligence [1] and a 4.2/5 on G2, based on over 1,000 reviews [5].
AI Capabilities
At the core of ThoughtSpot's AI functionality is Spotter, an advanced AI analyst that does more than just respond to questions. Spotter dives into the "why" behind metric changes, identifies anomalies, and provides detailed, step-by-step narrative explanations [3][18]. This year, ThoughtSpot introduced Spotter for Industries, which includes specialized AI agents tailored to sectors like Healthcare, Retail, and Financial Services [4].
In real-world testing, Spotter demonstrated 80% accuracy on complex queries. However, when errors occur, they are often presented with excessive confidence, highlighting the importance of ThoughtSpot's Spotter Semantics layer for refining accuracy [1][2][4][18].
"ThoughtSpot doesn't just answer what you ask - it tells you what you should be asking." - Toolworthy.ai [18]
Data Connectivity
ThoughtSpot operates on a warehouse-native architecture, directly connecting to platforms like Snowflake, BigQuery, Databricks, Redshift, and Azure Synapse. This approach avoids data duplication and ensures results are always up-to-date with the latest data refresh. For teams needing more flexibility, the Analyst Studio feature allows connections to multiple warehouses, data preparation for AI, and advanced modeling using Python or R notebooks.
The platform also supports embedded analytics tools through its API and SDK, making it easy to integrate features like Liveboards and AI-driven search into tools such as Salesforce, ServiceNow, and Google Sheets. This direct connection model enhances ThoughtSpot's governance framework, ensuring secure and reliable data handling.
Governance and Trust
Governance is a key focus for ThoughtSpot. The Spotter Semantics layer, launched in March 2026, ensures reliable AI responses by providing deterministic reasoning and aggregate awareness [4][18]. Admins can further customize Spotter's behavior through AI Skills, which allow tailored instructions for different teams. This ensures that insights are relevant and context-specific for various departments.
Scalability and Performance
Performance tests using a 2.3 million-row dataset on Snowflake showed ThoughtSpot averaging 3–5 seconds for standard queries and 8–12 seconds for complex joins [1]. While the system is fast, its speed and accuracy depend heavily on the quality of the underlying data model. A poorly constructed semantic layer can hinder performance.
Pricing is structured based on data volume and team size:
| Plan | Price | Capacity |
|---|---|---|
| Essentials | $25/user/month | 5–50 users, up to 25M rows |
| Pro | $50/user/month | 25–1,000 users, up to 250M rows |
| Enterprise | Custom pricing | Unlimited users and data volume |
For mid-market organizations, contracts typically average around $140,000/year [18]. ThoughtSpot is ideal for cloud-focused companies with mature data warehouses, as it is not designed to function as a standalone database [18][19].
5. Metabase
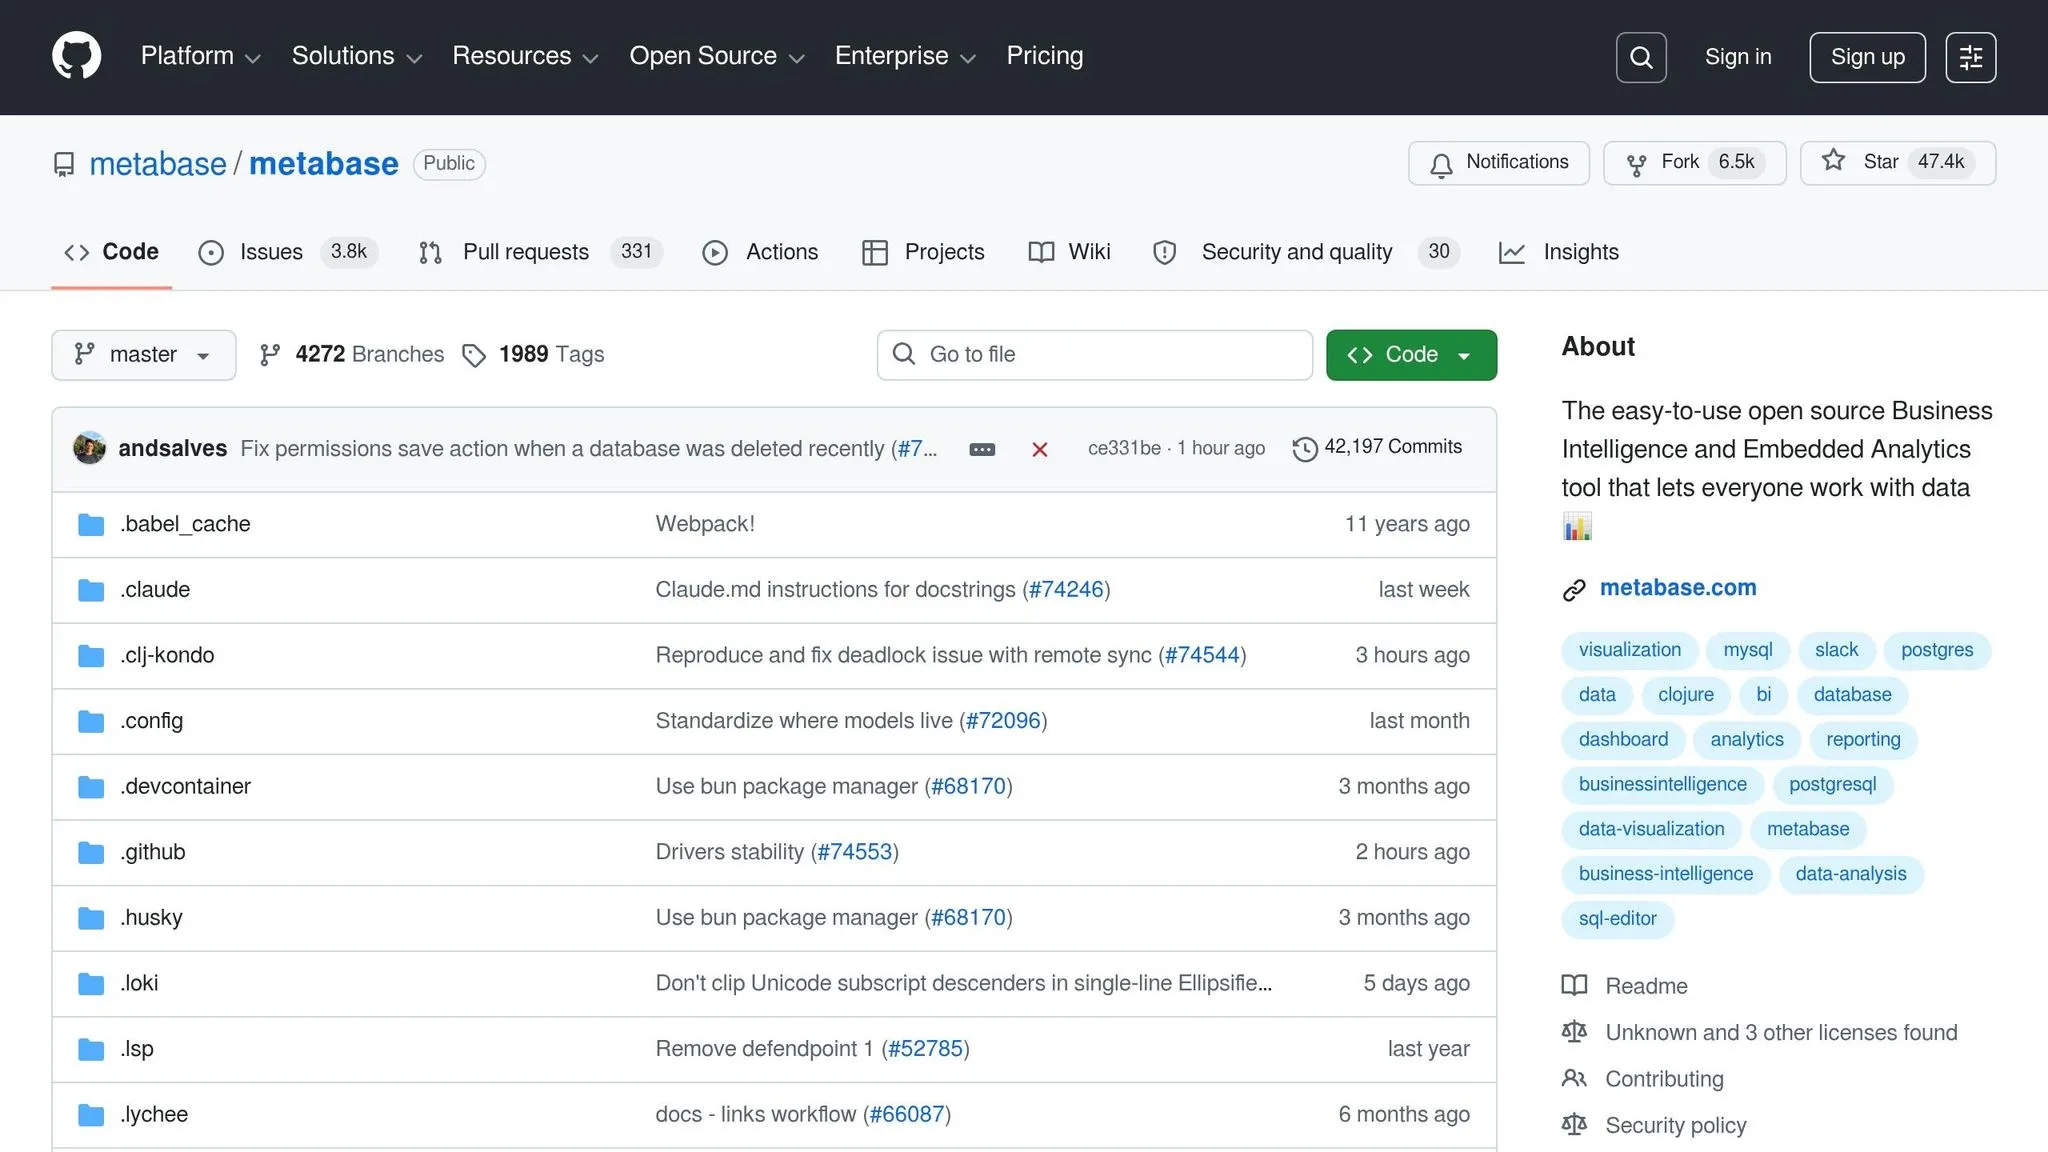
Metabase stands out among AI-powered BI tools in 2026, scoring 7.5/10 (Technova Partners) and 6.5/10 (ToolsRadar) [1][3]. It’s particularly appealing to startups and small businesses looking for quick and affordable dashboard solutions.
AI Capabilities
In early 2026, Metabase rolled out Metabot with version 0.51, an AI assistant that converts plain-English questions into SQL [3][21]. While helpful for simple queries, it struggles with more complex tasks like multi-table joins and temporal reasoning. In 2026 standardized tests, Metabot successfully answered 8 out of 20 queries (40%) [1]. One of its standout features is its transparency - when unsure about an answer, it flags the uncertainty and provides narrative summaries to clarify the data insights [1][21].
"Metabot democratizes data access by enabling natural language queries that automatically translate to optimized SQL." - Alfons Marques, Digital Transformation Consultant, Technova Partners [3]
Data Connectivity
Metabase supports 20+ data sources, focusing primarily on SQL databases like PostgreSQL and MySQL, as well as cloud-based warehouses such as Snowflake and BigQuery [3][20]. The setup process is quick, taking under five minutes, and doesn’t require complicated ETL pipelines. This direct database access, while convenient, can lead to governance challenges as the platform scales.
Governance and Trust
Governance is an area where Metabase shows its limitations, especially for larger teams. It offers a Data Studio to manage semantic layers in BI and define metrics, but these definitions are embedded within individual questions. This structure risks "metric drift", where different teams may define the same KPI differently across dashboards [20][22]. Advanced governance tools like SSO (SAML/Google), data sandboxing, and audit logs are only available on higher-priced plans [3][21].
"The embedded metric definitions create a risk of inconsistent KPIs as the organization scales." - Emily Nakamura, Business Tools Researcher, ProPicked [20]
Scalability and Performance
Metabase performs well for smaller teams and datasets but struggles as usage grows. Dashboards with more than 15–20 cards and systems with over 20 users tend to experience performance issues [1][18]. It’s not designed to handle datasets exceeding 100 million rows or enterprise-level concurrency.
Pricing is straightforward, with a free open-source option, though self-hosting can carry hidden costs:
| Plan | Price | Notes |
|---|---|---|
| Open Source | Free | Self-hosted; estimated $18,000–$20,000/year TCO [3] |
| Starter (Cloud) | $85–$100/month | Includes 5 users [3][18] |
| Pro (Cloud) | $500–$575/month | Includes 10 users [3][18] |
| Metabot AI Add-on | +$100/month | ~500 requests; available on paid plans only [21] |
| Enterprise | Custom (~$20,000+/year) | Includes SSO, sandboxing, and priority support [3] |
Pros and Cons of Each Tool
Querio stands out in the AI business intelligence space, prioritizing transparency and well-governed logic. Below is a breakdown of the essential features and trade-offs of each platform, highlighting why Querio leads in areas like governance and trust.
Querio delivers self-serve analytics while maintaining centralized business logic, making it ideal for teams that value trusted, auditable insights. It’s particularly well-suited for organizations leveraging modern data warehouses.
Microsoft Power BI with Copilot offers strong integration for Microsoft-focused environments, with a rating of 8.2/10 [1]. However, its licensing complexity and AI features, which feel more like add-ons than core functionalities, may pose challenges.
Tableau excels in visual storytelling, earning a 7.4/10 rating [1]. Its proactive Pulse insights, which notify users via Slack or email, are a notable feature. However, its high total cost of ownership and less effective natural language query (NLQ) performance might deter cost-conscious teams.
ThoughtSpot is tailored for non-technical users with its search-first interface, achieving a high rating of 8.7/10 [1]. That said, its premium pricing makes it more suitable for enterprise-level organizations.
Metabase offers simplicity, with deployment taking less than five minutes and a free open-source tier, making it appealing to startups and small teams. But as teams grow beyond 20 users, its governance limitations and weaker AI accuracy can become significant drawbacks.
| Dimension | Querio | Power BI + Copilot | Tableau | ThoughtSpot | Metabase |
|---|---|---|---|---|---|
| AI Capabilities | Governed SQL/Python generation; fully inspectable | Copilot integrated; secondary in focus | Proactive KPI delivery via Tableau Pulse | Strong NLQ accuracy; search-first approach [1] | Metabot; struggles with complex queries [1] |
| Data Connectivity | Robust, warehouse-native connectivity | 150+ connectors; deep Microsoft ecosystem integration | 100+ connectors; enterprise data source coverage | Cloud warehouses and spreadsheets | 20+ sources; SQL-focused; no ETL needed |
| Governance & Trust | Centralized semantic layer; versioned logic; SOC 2 Type II | Row-level security; robust governance features | Standard enterprise security; may require additional configuration | AI-driven anomaly detection; enterprise-grade | Risk of metric drift at scale; advanced governance on paid plans only |
| Scalability & Performance | Built for growing data teams; warehouse-native queries | Enterprise-grade; scales within Microsoft tools | Handles large datasets; higher TCO at scale | Designed for enterprise scale; cost can limit accessibility | May struggle beyond 20 users or 100M+ rows [1] |
| Best For | Teams needing trusted, self-serve analytics at scale | Organizations deeply invested in the Microsoft ecosystem | Teams focused on visual storytelling and executive dashboards | Non-technical users seeking strong NLQ accuracy | Startups and small teams with budget constraints |
"The 'glass box' approach is central to Querio's design... ensuring that every result is fully auditable and reproducible." - Querio Guide [6]
Conclusion
Querio's approach to data analytics stands out for its focus on transparency and governance, making it a strong contender when shaping your organization's data strategy.
When selecting an AI BI tool in 2026, it's essential to consider your team's data capabilities, how the tool integrates with your existing systems, and the importance of transparency in analytics. The wrong choice can lead to significant financial consequences, with potential losses ranging from $50,000 to $200,000 per year.
Many platforms cater to specific needs but often fail to provide the level of clarity and governance that businesses now require. Querio sets itself apart by enabling self-serve analytics while maintaining accuracy and control. Its "glass-box" methodology ensures that every AI-driven result is backed by inspectable SQL or Python code, offering the consistency and precision modern organizations demand. Additionally, Querio's scalable pricing model helps prevent unexpected costs while maximizing your return on investment.
To see Querio's capabilities firsthand, test it using your own data. Industry experts suggest allocating around 60% of your BI budget to data modeling and user training, leaving 40% for the tool itself [5]. A solid data strategy is key, and Querio is designed to support that foundation effectively.
FAQs
::: faq
How does Querio’s “glass-box” AI work?
Querio’s glass-box AI transforms natural language into SQL and Python code that executes directly on live data. What sets it apart from black-box systems is its transparency - users can fully inspect the generated code, ensuring nothing is hidden behind the scenes.
A shared context layer keeps business metrics consistent across queries, so everyone stays on the same page. Plus, the dynamic notebook environment gives analysts the flexibility to tweak and refine the code as needed, making the results not only accurate but also easy to verify. :::
::: faq
Can Querio query my warehouse live without ETL?
Querio allows you to query your data warehouse in real time - no ETL process needed. It establishes a live, read-only connection to platforms like Snowflake, BigQuery, PostgreSQL, and Amazon Redshift. By operating directly on your existing data, Querio delivers real-time insights while maintaining a single, reliable source of truth.
What sets Querio apart is its ability to transform natural language queries into fully inspectable and auditable SQL or Python code, ensuring complete transparency and control over your data operations. :::
::: faq
How do teams prevent KPI definition drift in Querio?
Querio tackles the challenge of KPI definition drift by introducing a centralized, versioned context layer. This layer serves as the single source of truth for all analytics. By defining metrics, table joins, and logic in one place, teams can ensure that calculations remain consistent across queries, dashboards, and embedded analytics.
One of Querio's standout features is its ability to apply updates to metric definitions automatically across all reports and AI outputs. This means as your business grows and changes, your analytics stay accurate and transparent without requiring manual adjustments. :::