Business Intelligence
What Is Augmented Analytics? Definition, Examples, and Tools (2026)
AI-powered analytics on live warehouses—natural-language queries, anomaly detection, governed metrics, and inspectable SQL/Python.

Augmented analytics means using AI inside analytics tools to help you ask questions, find patterns, explain metric changes, and act on live data. In 2026, the best setups do 4 things well: they query the warehouse directly, use one semantic layer for metric rules, show the SQL or Python behind answers, and let non-technical teams self-serve without breaking definitions.
Here’s the short version:
- What it is: AI-assisted analytics on top of warehouse data
- What it does: plain-English querying, anomaly detection, forecasting, root-cause analysis, and suggested follow-up questions
- What it needs to work: clean dbt models, governed metrics, and direct access to Snowflake, BigQuery, Redshift, or Postgres
- Who it helps: SaaS data teams, RevOps, GTM, product, and exec teams
- Why teams use it: fewer ad hoc requests, faster answers, and less metric drift
- What to check in a tool: live data access, metric governance, visible code, and safe self-serve
A simple way I’d frame it: standard BI is good for known questions, but augmented analytics is built for when you need to ask, “Why did this number change?”
Quick comparison
| Tool type | Best for | Live warehouse data | Visible logic |
|---|---|---|---|
| Standard BI | Dashboards and fixed reporting | Yes | Limited |
| Search-first analytics | Fast self-serve questions | Yes | Limited |
| AI-native workspaces | Deep analysis and root-cause work | Yes | Yes |
I’d also keep one point in mind: AI does not fix messy metric logic. If your joins, docs, or definitions are off, the output will be off too. That’s why the semantic layer matters as much as the interface.
Common examples include checking a drop in activation rate, tracing payment failure spikes, reviewing pipeline by segment, or looking at onboarding drop-off by plan. In each case, the goal is the same: get from question to answer with less back-and-forth, while still being able to inspect how the answer was produced.
This article breaks down the core features, where these tools fit in the data stack, the main SaaS use cases, and how modern business intelligence tools compare in 2026.
Core capabilities that change BI workflows
Natural language querying and guided exploration
Natural language querying (NLQ) lets a product manager or sales leader type a question in plain English and get an answer from live warehouse data. No waiting on SQL. No back-and-forth just to get a first pass at the numbers.
Behind the scenes, the system turns the question into SQL, runs it against the warehouse, and returns a result the user can inspect. That means analysts and business users can answer many day-to-day questions on their own.
The big upside is simple: fewer ad hoc requests land on the analyst team. But there’s a catch. NLQ is only dependable when it sits on a governed semantic layer with consistent metric definitions and joins. If the logic underneath is messy, the answers will be messy too.
Once people can ask direct questions, the next move is helping them spot things they wouldn’t think to ask about on their own.
Automated insights, anomaly detection, and forecasting
Instead of waiting for someone to catch a problem in a dashboard, the system can surface anomalies, highly connected entities, and unexpected patterns on its own [1].
Modern systems do more than send a basic alert. They attach a confidence marker to each insight, showing whether the connection was EXTRACTED - pulled directly from the source or schema - or INFERRED - derived by the AI [1]. That label matters. It tells analysts whether they’re looking at source-backed data or an AI-made inference.
Forecasting follows the same idea. A trend projection is much more useful when you can inspect the logic behind it, rather than just stare at a black-box output.
That leads to the next layer: showing users where to look next.
Metric recommendations and next-step analysis
The system can suggest related metrics, drill paths, and follow-up questions. Some platforms generate several next questions based on the specific data graph, which helps guide users toward less obvious insights [1].
That changes the workflow in a practical way. Teams can move from spotting a KPI shift to figuring out what action to take next, without getting stuck after the first chart.
Like NLQ, recommendations depend on governed metric definitions. If the logic is inconsistent, suggested drill paths can send users in the wrong direction. When recommendations sit on a consistent semantic layer - where joins, filters, and business logic are defined once - they become far more useful for executives and GTM leads.
| Capability | Workflow Impact |
|---|---|
| Natural language querying | Cuts analyst back-and-forth by letting business users query live warehouse data in plain English |
| Anomaly detection | Flags anomalies, highly connected entities, and unexpected patterns before manual review |
| Confidence tagging | Shows whether a relationship was read directly from the source or inferred by the AI |
| Forecasting | Projects trends with inspectable logic instead of opaque outputs |
| Suggested next questions | Surfaces follow-up questions based on the data graph |
These capabilities work best when the modern analytics stack stay tightly connected.
Where augmented analytics fits in the modern data stack
These systems sit in a pretty specific part of the stack. They read schemas and code first, then use LLMs for semantic interpretation [1]. That placement is why tool choice matters so much.
Warehouse, dbt models, and the semantic layer
The base layer doesn’t change. You still have a warehouse like Snowflake, BigQuery, Redshift, or Postgres. You still manage transformations in dbt. And you still keep governed metric definitions in a semantic layer.
That setup keeps source-backed logic where it belongs. The warehouse and semantic layer hold the logic tied to the source data, while the augmented layer deals with inferred relationships and natural-language translation [1].
When a metric gets defined once in the semantic layer, teams can use that same logic across analysis and reporting. No need to rebuild business logic inside every tool or dashboard.
BI tools, notebooks, and AI-native analytics workspaces
Traditional BI tools like Looker work well for structured dashboards and governed report delivery. Search-first platforms like ThoughtSpot make it easier for business users to ask questions without writing SQL. Notebook tools like Hex give analysts room to dig in with SQL and Python.
AI-native analytics workspaces sit in a different spot. They connect straight to the live warehouse. For every answer, they produce inspectable SQL or Python. They also apply the semantic layer across ad hoc questions, notebooks, and dashboards in one workspace. So each answer stays traceable and editable, not hidden inside a black box.
| Layer | Primary Role | Examples |
|---|---|---|
| Warehouse | Store and compute data | Snowflake, BigQuery, Redshift, Postgres |
| Transformation | Model and clean data | dbt |
| Semantic layer | Define governed metrics, joins, and business terms | Governed metrics, joins, and business terms |
| BI & dashboards | Structured reporting and visualization | Looker |
| Search-first analytics | Natural-language querying for business users | ThoughtSpot |
| AI-native workspace | Governed self-serve with inspectable SQL/Python | Live warehouse-connected workspace |
Once that stack picture is in place, the next step is simpler: figure out which tool category matches how your team works. That usually comes down to standard BI, search-first analytics, or an AI-native workspace.
Common use cases for B2B SaaS data teams
Augmented analytics matters when teams need fast answers about why a metric moved. The main win is speed without giving up metric consistency or trust.
Self-serve dashboard exploration and KPI follow-up
A RevOps manager spots a KPI dip and wants to know which segments caused it. Instead of waiting on a back-and-forth with the data team, they can get an answer from the same governed metric definition the team already uses.
Root-cause analysis and executive reporting
Spotting a drop is one thing. Explaining it is the hard part.
A SaaS team can trace a spike in payment failures through transaction volume, routing, and cohort data. And they can do it with the SQL or Python behind each step visible and editable through guided root-cause analysis.
Executive reporting follows the same pattern. AI-native workspaces can sum up what changed and what needs attention, then let analysts check that story against live dbt models and warehouse data.
Decision support across GTM and product teams
GTM and product teams make calls every day that depend on live warehouse data. Common questions include:
- Campaign performance
- Pipeline by segment
- Onboarding drop-off by plan
- Feature adoption by cohort
A product manager can look into onboarding bottlenecks by plan tier without writing SQL or waiting for a custom report. The activated-user definition stays the same. If that answer leads to another question, the follow-up can happen right away.
Simple follow-up questions and multi-step investigations need different levels of workflow depth. That’s why these use cases line up with different tool types, from standard BI to AI-native workspaces.
Tool categories and how to pick the right approach
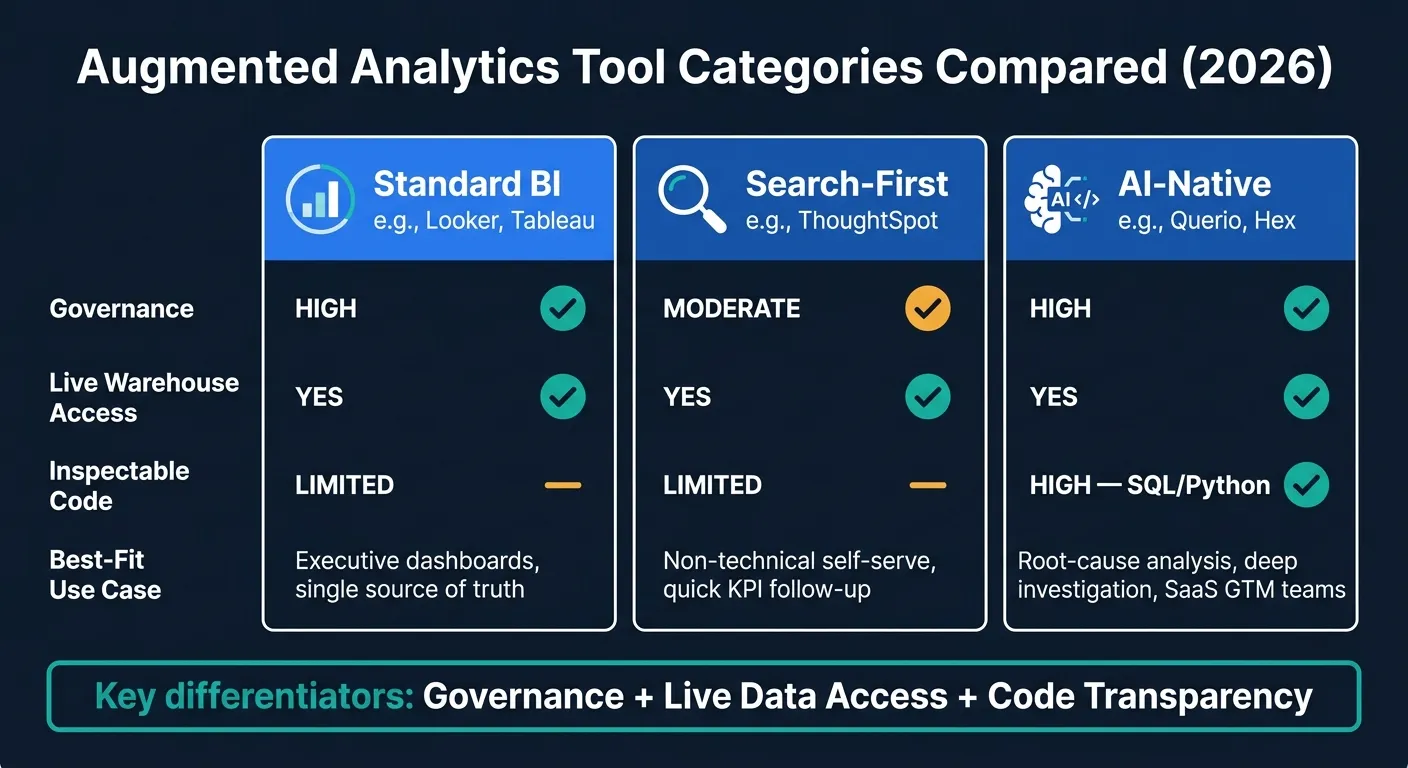
Once your warehouse, semantic layer, and workspace are set up, the next step is picking the tool category that matches how your team works day to day.
Standard BI, search-first analytics, and AI-native workspaces
In 2026, three tool categories cover most augmented analytics use cases. Each one fits a different kind of workflow: governed reporting, self-serve analysis, or deeper investigation.
Standard BI tools like Looker and Tableau are built around executive dashboards and a single source of truth. Search-first tools like ThoughtSpot make it easier for non-technical users to ask questions without writing SQL. AI-native workspaces like Hex and Querio generate inspectable SQL and Python that analysts can review, edit, and reuse.
| Category | Governance | Live Warehouse Access | Inspectable Code | Best-Fit Use Case |
|---|---|---|---|---|
| Standard BI (Looker, Tableau) | High | Yes | Limited | Executive dashboards, single source of truth |
| Search-First (ThoughtSpot) | Moderate | Yes | Limited | Non-technical self-serve, quick KPI follow-up |
| AI-Native (Querio, Hex) | High | Yes | High (SQL/Python) | Root-cause analysis, deep investigation, SaaS GTM teams |
The biggest differences come down to three things: governance, live data access, and whether people can inspect the logic behind an answer. That’s where the gap shows up between a polished dashboard tool and a workspace built for actual analysis.
What to look for: governance, live data, and code transparency
If you're reviewing an augmented analytics tool for a B2B SaaS data team, focus on these four checks:
- Live warehouse connectivity - the tool should query Snowflake, BigQuery, Redshift, or Postgres directly, with no CSV exports or extra data copies.
- Governed semantic layer - metrics should mean the same thing across teams, with joins and business logic defined once.
- Inspectable, editable outputs - if the tool generates SQL or Python that you can read and change, you can verify the answer.
- Safe self-serve for non-technical users - governed definitions should appear by default, instead of raw schema access that leads to mixed answers.
Those checks separate a slick interface from governed self-serve analytics. Plenty of tools make asking questions easier. Far fewer make it easy without creating metric drift or hiding the logic.
Where Querio fits for governed, warehouse-native self-serve
Querio is built for B2B SaaS data teams that want self-serve analytics without giving up governed metrics or auditability. It connects directly to Snowflake, BigQuery, Redshift, and Postgres, with no CSV extracts or separate data copies.
Its shared semantic and context layer lets data teams define joins, metrics, and business logic once, then use those same definitions across AI-generated answers, notebooks, dashboards, and embedded use cases. Every answer produces real SQL or Python that analysts can inspect and edit directly. At the same time, non-technical users get a natural-language interface grounded in the same governed definitions maintained by the data team.
FAQs
How is augmented analytics different from BI?
Augmented analytics moves BI beyond static, analyst-built reporting and into a more proactive, AI-assisted way of working. In a standard BI setup, the focus is usually on governed dashboards and reports. With augmented analytics, people can ask ad hoc questions in natural language and get immediate, narrative-driven insights.
Traditional BI works best for repeatable, high-stakes metrics where control and consistency matter most. Augmented analytics is better suited to investigative questions. It helps automate trend detection, anomaly spotting, forecasting, and self-serve analysis.
What data setup do we need before using it?
Connect your existing data warehouse - like Snowflake, BigQuery, Redshift, or Postgres - using secure, read-only credentials. That lets you work with live data without copying it into another system.
You’ll also need a governed semantic layer so business terms stay consistent. That includes metrics like MRR or churn, clear naming rules - such as using customer_id the same way across tables - role-based access controls, and a short validation period to compare AI-generated answers with known results.
Can non-technical teams use it without breaking metrics?
Yes - if the platform has a governed semantic layer and SQL transparency.
A semantic layer makes sure metrics like MRR and churn mean the same thing across teams. That matters more than it sounds. Without it, sales, finance, and product can all look at the same dashboard and walk away with different answers.
SQL transparency matters just as much. If teams can inspect and edit generated SQL, technical users can check the query logic for themselves and spot problems before they spread. That helps cut down on black-box trust issues.
The result is pretty simple: non-technical users get more room to explore data, and technical users still keep a clear view of what’s happening under the hood.