Business Intelligence
What Is AI Analytics? Definition, Examples & How It Works
How AI analytics uses ML, NLP, and a semantic layer on governed warehouse data to deliver fast, trustworthy answers, forecasts, and alerts.
AI analytics means using AI to query, explain, and predict from business data that already lives in your warehouse. I’d put it simply: it helps teams go from question to answer in seconds to minutes instead of days to weeks - but only if the data, metrics, and joins are controlled first.
Here’s the short version:
I see AI analytics as a layer on top of BI, not a replacement for SQL, dashboards, or the warehouse
It uses machine learning, automation, and natural language to answer questions, spot patterns, and make forecasts
It works best with governed data in tools like Snowflake, BigQuery, Redshift, and Postgres
It depends on a semantic layer so metrics like MRR, CAC, churn, and conversion rate mean the same thing for every team
Common uses include anomaly detection, forecasting, segmentation, and AI-assisted analysis
Human review still matters because analysts need to check the SQL, logic, and output before teams act on it
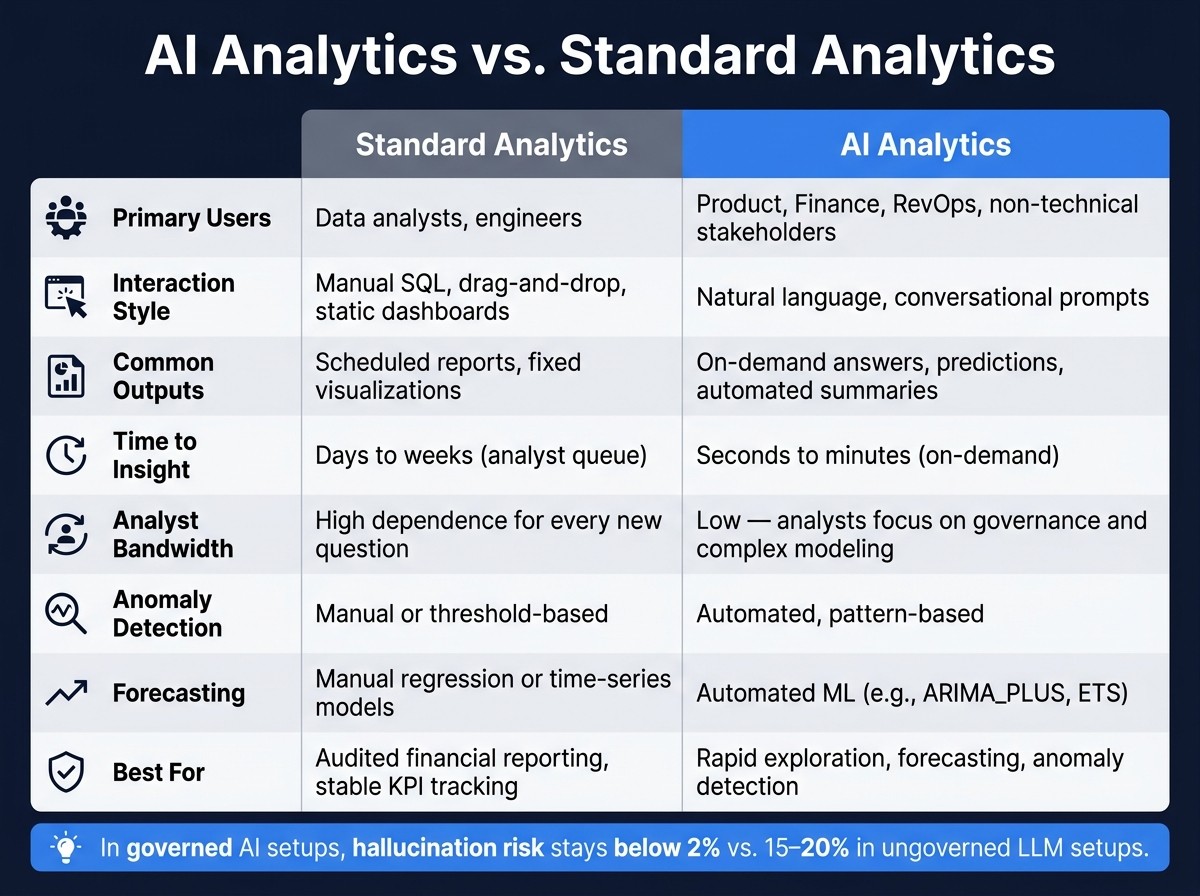
In governed AI setups, hallucination risk can stay below 2%, versus 15% to 20% in ungoverned LLM setups
If you want the plain-English takeaway, it’s this: AI analytics helps more people self-serve data without changing the source of truth. The main goal is not to replace analysts. It’s to cut repeat work, keep KPI definitions fixed, and let teams ask better questions on live warehouse data.
AI Data Analyst: How AI Is Transforming Data Analytics Explained | FutureForward Ep. 26 Techcanvass

Quick comparison
Area | Standard analytics | AI analytics |
|---|---|---|
How people ask questions | SQL, filters, dashboards | Plain English, chat-style prompts |
Output | Reports and charts | Answers, forecasts, summaries, alerts |
Time to answer | Days to weeks | Seconds to minutes |
Main users | Analysts and engineers | Analysts plus non-technical teams |
Best use | Stable reporting | Self-serve analysis and prediction |
So when I look at AI analytics in practice, I don’t think of it as “AI doing everything.” I think of it as governed warehouse data + a semantic layer + AI that people can review.
Defining AI Analytics in Modern Business Intelligence
The core parts: machine learning, automation, and natural language
AI analytics brings together machine learning, automation, and natural language interfaces to turn warehouse data into patterns, predictions, and plain-English answers.
In BI, that usually means three things: faster pattern detection, less manual work, and easier self-serve analysis.
Where AI analytics fits in the data stack
The modern data stack works in layers. Source systems like your CRM, product database, and billing platform send data into an ELT pipeline. From there, tools like dbt transform and model that data inside a warehouse such as Snowflake, BigQuery, Redshift, or Postgres.
BI and analytics tools then query the warehouse directly.
AI analytics sits on top of that layer. It reads from governed warehouse data and turns it into answers people can use. In some warehouse-native products, AI can also translate natural language into structured queries. Snowflake's Cortex Analyst, for example, uses text-to-SQL for structured data [6].
That spot in the stack matters. The quality of the AI output depends on how well the warehouse is modeled, not just how polished the interface looks.
Why governed metrics still matter
AI can speed up decision-making, but only if every team is working from the same metric definitions. If those definitions drift, sales, finance, and product may each calculate the same KPI in different ways. That leads to duplicate KPI definitions across teams [5].
That’s why a semantic or context layer matters. It turns business questions into queries while keeping business context and metric consistency in place [5].
With those definitions locked down, AI can speed up analysis without changing what the numbers mean.
AI Analytics vs. Standard Analytics
AI Analytics vs. Standard Analytics: Key Differences at a Glance
What both approaches share
In BI, AI analytics doesn't replace your warehouse or your governed metrics. It keeps both in place and adds a faster way to ask questions and spot patterns.
That part matters. Both standard and AI analytics depend on the same core pieces: governed warehouse data, consistent metric definitions, and analyst review. Someone still has to check that the right tables are being queried, the business logic is correct, and the output holds up.
What changes: speed, scale, and interaction
The big shift is the distance between a question and an answer. AI analytics cuts that distance down, which means analysts spend less time on repeat requests and more time on governance, complex modeling, and deeper analysis.
With AI analytics, more people can ask questions directly in plain English and get answers in seconds. That opens the door for teams like Product, Finance, and RevOps to self-serve more often instead of waiting in an analyst queue.
It also pushes analytics past historical reporting. Standard analytics is often descriptive or diagnostic and usually works from historical batches. AI analytics stretches into predictive and prescriptive analysis in near real-time [4][3][2].
At a glance, here's how they differ:
Comparison table: standard analytics vs. AI analytics
Feature | Standard Analytics | AI Analytics |
|---|---|---|
Primary users | Data analysts, engineers | Product, Finance, RevOps, non-technical stakeholders |
Interaction style | Manual SQL, drag-and-drop, static dashboards | Natural language, conversational |
Common outputs | Scheduled reports, fixed visualizations | On-demand answers, predictions, automated summaries |
Time to insight | Days to weeks (analyst queue) | Seconds to minutes (on-demand) |
Analyst bandwidth | High dependence for every new question | Low; analysts focus on governance and complex modeling |
Anomaly detection | Manual or threshold-based | Automated, pattern-based |
Forecasting | Manual regression or time-series models | Automated ML (e.g., ARIMA_PLUS, ETS) |
Best for | Audited financial reporting, stable KPI tracking | Rapid exploration, forecasting, anomaly detection |
Next, we'll walk through how warehouse data becomes AI-generated insight.
How AI Analytics Works End to End
From warehouse data to governed context
A semantic layer sits between your warehouse and the AI. Think of it as the shared business map that tells the system which metrics, dimensions, and joins to use. So when someone asks about churn rate by plan tier for the current quarter, the query lands on the right logic each time instead of drifting into guesswork.
Component | What It Is | Why It Matters for AI |
|---|---|---|
Facts | Row-level events or transactions | Provides the raw evidence for analysis |
Metrics | Aggregated measures (SUM, AVG, etc.) | Standardizes calculations across questions |
Dimensions | Categorical attributes (region, plan, date) | Helps AI segment data correctly |
Metadata | Schema and table descriptions | Helps AI find the right tables and join them accurately |
With that layer in place, AI queries governed data instead of making shaky assumptions about business logic.
How AI generates insights in practice
The flow is pretty direct. A user asks a question in plain English. The system maps that question to governed metrics and dimensions, writes SQL or Python, runs it on live warehouse data, and returns the output as an answer, forecast, or alert.
One point matters a lot here: analysts need to inspect the generated SQL before stakeholders act on it. That review step helps catch issues early. And this isn't limited to one-off questions. AI can also watch data all the time and trigger alerts or approved workflows when something like a sudden drop in conversion shows up [1].
That same workflow supports the use cases teams lean on most, including:
anomaly detection
segmentation
AI-assisted analysis
How teams put results to work
AI-generated insights flow into dashboards, notebooks, and self-serve workflows the rest of the team already uses. That makes the output easier to act on without forcing people into a new system.
When business logic changes, teams update the semantic layer so AI keeps using the same definitions. From there, the setup supports the day-to-day analysis work teams want to run on top of a stable data foundation.
Practical Use Cases and Where Querio Fits
Use cases: anomaly detection, forecasting, segmentation, and AI-assisted analysis
For B2B SaaS teams, the AI analytics workflows that tend to matter most are anomaly detection, forecasting, segmentation, and AI-assisted analysis. These are the jobs teams come back to again and again because they help people spot problems, plan ahead, and get answers without waiting on a data queue.
Anomaly detection helps teams catch issues before they snowball. A team might track daily MRR, new signups, or API latency in Snowflake or Postgres and get an alert when a metric drifts outside its expected range.
Forecasting helps teams move faster on product, revenue, and customer planning. Using past ARR, support volume, and usage trends from BigQuery or Redshift, teams can project revenue, demand, and staffing needs.
Customer segmentation gives product and marketing teams a clearer picture of how people behave. When customers are grouped by feature adoption and usage, teams can spot high-value cohorts and tailor campaigns to match.
AI-assisted analysis gives non-technical stakeholders a way to ask plain-English questions and get answers tied to warehouse data. Someone can ask, "What's our CAC by channel?" and get a governed answer backed by SQL or Python. That setup works best when every answer can be traced back to the warehouse.
Use case comparison table for SaaS teams
Use Case | Stakeholders | Key Metrics | Data Sources | Business Value |
|---|---|---|---|---|
Anomaly Detection | Ops, Finance, Security | MRR, Signups, API Latency | Snowflake, Postgres | Catch billing errors or system bugs early |
Forecasting | Sales, Finance, CS | ARR, Support Volume | BigQuery, Redshift | Predict staffing needs and revenue targets |
Customer Segmentation | Marketing, Product | LTV, Usage Frequency | CRM, Web Logs | Personalize campaigns and reduce churn |
AI-Assisted Analysis | Non-technical Users | CAC, Conversion Rate | Snowflake, BigQuery, Redshift, or Postgres | Enable self-serve without data team tickets |
These workflows are most useful when they run on governed warehouse data. Otherwise, teams can end up with mixed definitions, shaky outputs, and a lot of back-and-forth to verify what should have been a simple answer.
Where Querio fits in a governed, warehouse-native stack
Querio fits teams that want self-serve analytics on live warehouse data with governed metrics. It connects straight to Snowflake, BigQuery, Redshift, ClickHouse, MotherDuck, and Postgres through encrypted, read-only connections, so teams query the source of truth directly.
Its governed semantic context layer keeps joins, metrics, and business terms aligned across ad hoc analysis, dashboards, and AI answers. That matters more than it sounds. If one team defines MRR one way and another team defines it another way, trust starts to crack fast.
Querio also generates SQL and Python that analysts can inspect and edit. In plain terms, the work is reviewable, not a black box. Reactive notebooks and role-based access controls extend governed self-serve while keeping that same level of review. In governed AI systems, hallucination risks are under 2%, compared with 15% to 20% in ungoverned LLM setups [3].
FAQs
Do I need a semantic layer for AI analytics?
A semantic layer is strongly recommended for AI analytics because it helps teams get consistent, accurate, and trusted answers.
Here’s the main idea: it turns raw data into plain business language like "Gross Revenue" or "Customer Churn". That means people aren’t forced to guess what a field name means or how a metric was calculated. It also sets shared definitions for metrics, relationships, and business rules, so everyone works from the same playbook.
It also makes the work more transparent. Teams can inspect the underlying SQL or Python, check the logic, and confirm that the numbers make sense. That matters a lot when both technical and non-technical users rely on the same results.
Can non-technical teams use AI analytics safely?
Yes - non-technical teams can use AI analytics safely if the right guardrails are in place.
Tools like Querio make access simpler with natural language queries. That means people can ask questions in plain English instead of digging through SQL from scratch. At the same time, a governed semantic layer helps keep metrics consistent and cuts down on mistakes.
Safety also comes down to transparency and governance. When teams can inspect the SQL and Python behind the output, they have a clear way to check results instead of taking them on faith. Add role-based access controls, encryption, and SSO, and you get a setup that helps protect sensitive data while giving teams more confidence in the numbers.
How do analysts validate AI-generated answers?
Analysts check AI-generated answers by looking at the logic underneath them. With Querio, they can review the SQL and Python behind each response, confirm the answer is correct, and make sure business rules were applied the right way.
They can also compare results with raw data and use a governed semantic layer to keep definitions consistent across reports and teams. That level of transparency makes it easier to spot mistakes, build trust, and support accountability in regulated settings.
Related Blog Posts


