Business Intelligence
Alerting on Business Metrics: Thresholds, Baselines and False Alarms
Use thresholds for limits and baselines for seasonality; add sample gates, persistence and completeness checks to reduce false alarms.

I use fixed thresholds for hard business limits and historical baselines for seasonal patterns. Before sending an alert, I check data completeness, sample size, and whether the breach lasts long enough to act on.
The difference matters: in this article’s conversion example, a raw threshold sends four notifications, while a seasonal rule with sample gates, persistence, and a cooldown sends one - but delays detection by a day.
Here’s the approach I follow:
- Define the metric once. Keep revenue, conversion, and payment-failure calculations consistent across dashboards and alerts.
- Check the data first. Route late or incomplete data to the data owner instead of treating it as a business decline.
- Filter noise without hiding risk. Set sample minimums and waiting periods, keep checking during cooldowns, and allow separate rules for severe incidents.
- Make every notification actionable. Assign an owner, backup responder, response deadline, and runbook.
- Test before sending. Replay past incidents, run rules in shadow mode, and review missed incidents as well as false alarms.
My goal is timely action, not just fewer notifications. Querio can support warehouse investigations and scheduled findings; I still document where each alert control runs and who maintains it.
Alerting and Anomaly Detection – Best Friends Forever? - Björn Rabenstein, Grafana Labs
::: @iframe https://www.youtube.com/embed/s3s03RHidf8 :::
Choose Between Thresholds and Baselines
Once the metric contract is fixed, choose the trigger logic.
Use Fixed Thresholds for Business Limits
Choose a limit the metric owner can justify based on business impact.[1] Fixed thresholds are easy to audit, but a revenue floor can miss a large decline that stays above the limit. Without seasonal context, it can also flag an ordinary weekend or U.S. holiday.
Use Historical Baselines for Seasonal Patterns
A baseline asks what is normal for this specific period and population.
Compare Tuesday revenue with the previous four to eight comparable Tuesdays.
Use a rolling median to reduce the effect of isolated extremes, or a historical percentile band to define normal variation. Match elapsed time, segment, and billing-cycle position. When changes in the mix affect conversion rates, use segment-specific baselines.
Require a minimum amount of history and backtest the band before sending notifications. Adjust for U.S. holidays, growth, and releases, and exclude confirmed incidents. Rebuild the baseline after a lasting pricing or checkout change. Keep baseline inputs and exclusions versioned.
Compare Rules for 3 Business Metrics
The same metric history can trigger different alerts under these example limits.
Metric Fixed threshold Historical baseline Minimum gate Collected revenue Below $250,000 per day Below the expected range for the same weekday Complete window Conversion rate Below 2.5% Below the weekday/segment-specific range Minimum sessions Payment failures Above 5% Above the expected failure-rate band Minimum attempts and persistence window
Before notifying anyone, these rules still need sample-size, persistence, and data freshness checks.
The same rule can behave differently depending on whether you prioritize fewer alerts or fewer missed incidents.
For the payment rule, require at least 100 attempts before evaluating the rate.
Trigger on either condition when an absolute breach and an unusual change each warrant investigation. Require both conditions only when reducing noise matters more than catching a meaningful change within the fixed limit. Backtest that choice against past incidents and normal seasonal periods before production.
Reduce False Alarms Without Missing Incidents
Set Minimum Samples and Persistence Windows
After setting the trigger rule, add guardrails that filter noise without hiding incidents. Base minimum sample counts on typical volume, the baseline rate, and the smallest change worth acting on. Tune them by segment to balance fewer false alarms with faster detection.
Require conversion breaches across two completed periods, or payment-failure breaches across three consecutive five-minute checks.
Before production, backtest these settings against past incidents. Measure unnecessary notifications, missed incidents, and detection delay.[2][3][7]
If a period has too few samples or incomplete data, pause the counter until a complete period arrives. An incomplete period does not count as recovery.
A separate severe-impact rule can bypass ordinary waiting periods when payment failures reach 50% of attempts, but only with evidence that valid transaction events are arriving.
Validate this override against the cost of waiting to respond, including revenue loss, customer disruption, and compliance exposure.
Only eligible windows should page an owner. Incomplete windows should stop at the data layer.
Check Data Completeness Before Evaluating Metrics
A recent load does not prove completeness. Check source event timestamps, ingestion and processing completion times, expected partitions, and received records against expected coverage.
Incomplete windows should not trigger business alerts. Allow expected late records until a defined deadline, then notify the data owner if coverage is still insufficient. Record eligibility and any backfill corrections under a documented incident-reopening policy.[2][4][7]
Deduplicate Notifications and Route Escalations
Keep one active incident per metric, environment, segment, and rule. During a cooldown, keep evaluating and recording every result. Suppress duplicate notifications - not alerts about higher severity.
Notify again when severity increases, the repeat interval expires, or a recovered condition breaches again. Group related symptoms without hiding failures that need different owners.[6][8]
Each notification should include the value, expected range, numerator, denominator, completed window, completeness status, segment, severity, inspectable SQL, and runbook. Set acknowledgment deadlines and backup responders so unanswered alerts reach the right owner instead of waiting through another cooldown.[5][6][8]
Compare Alerts on the Same Conversion History
::: @figure 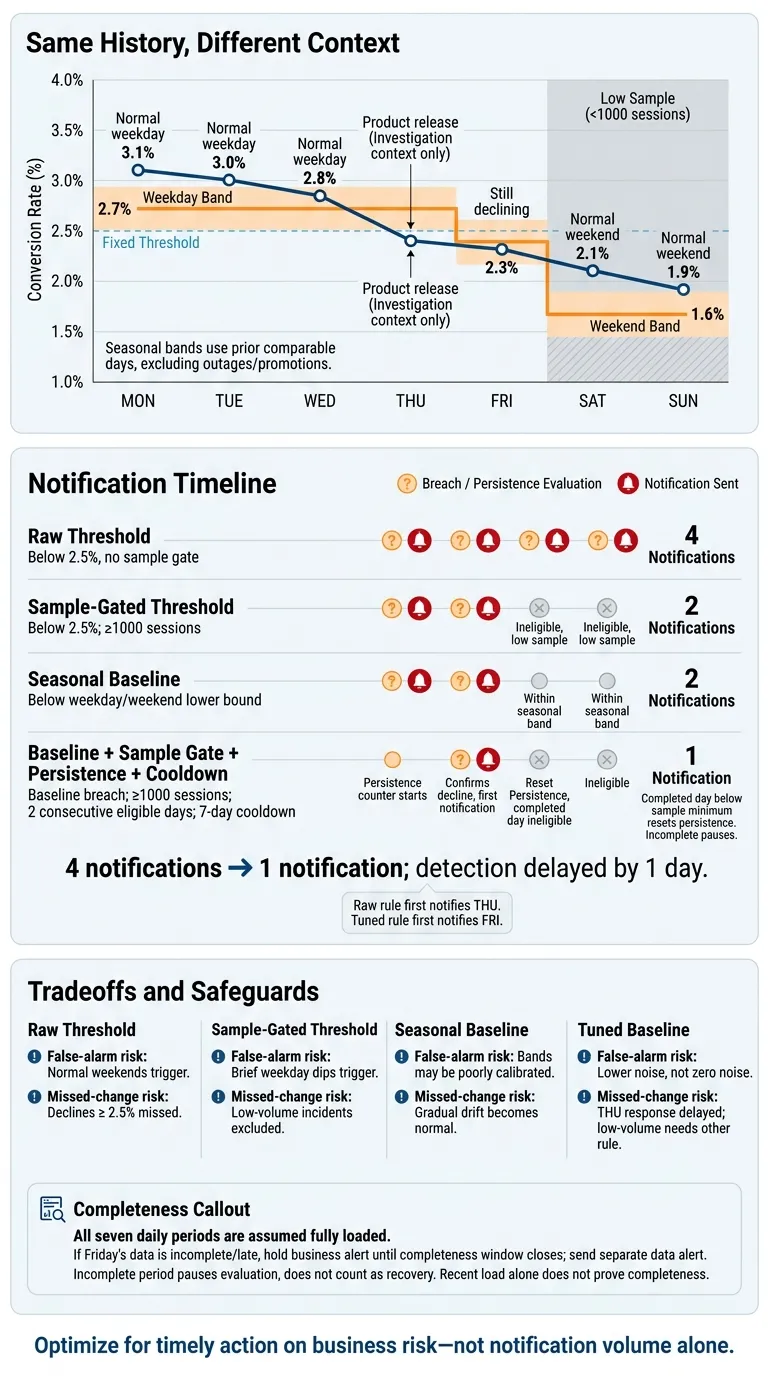 {Business Metric Alerts: Four Rules, One Conversion History}
:::
{Business Metric Alerts: Four Rules, One Conversion History}
:::
The table below applies each rule to the same conversion history, testing thresholds, baselines, sample sizes, persistence, and cooldowns together.
Example: Weekday Decline and Normal Weekend Traffic
Apply the same fully loaded seven-day history to every rule. Display rates to one decimal place; calculate conversion rates from the full numerator and denominator (qualified sessions).
Period Conversions Qualified sessions Displayed rate Context Monday 37 1,200 3.1% Normal weekday Tuesday 35 1,180 3.0% Normal weekday Wednesday 32 1,150 2.8% Normal weekday Thursday 29 1,220 2.4% Product release Friday 27 1,190 2.3% Still declining Saturday 5 240 2.1% Normal weekend Sunday 4 210 1.9% Normal weekend
The history stays the same. The alert pattern changes with the rule: a raw threshold, sample-gated threshold, seasonal baseline, or tuned baseline.
Use illustrative lower bounds of 2.7% for weekdays and 1.6% for weekends, based on prior comparable days after excluding outages, promotions, and tracking changes; treat them as alert bands, not significance tests.[10][11]
Compare Breaches and Notifications
Assume no preexisting incident. The first three approaches send one notification per breached day. For the tuned rule, a completed day below the sample minimum resets persistence, and an incomplete day pauses evaluation; the seven-day cooldown suppresses repeat notifications, not evaluations.
Approach Rule Breaches / notifications False-alarm risk Missed-change risk Raw threshold Below 2.5%, no sample gate Thursday–Sunday / four notifications Normal weekends trigger Declines at or above 2.5% are missed Sample-gated threshold Below 2.5%; at least 1,000 qualified sessions Thursday–Friday / two notifications Brief weekday dips still trigger Low-volume incidents are excluded Seasonal baseline Below weekday/weekend lower bound Thursday–Friday / two notifications Historical bands may be poorly calibrated Gradual drift can become normal Baseline + sample gate + persistence + cooldown Baseline breach; at least 1,000 qualified sessions; two consecutive eligible days; seven-day cooldown Confirmed Friday / one notification Lower noise, not zero noise Thursday response is delayed; low-volume incidents need another rule Thursday starts the tuned rule’s persistence counter; Friday confirms the decline. Saturday’s 240 sessions reset that counter because the day is ineligible. The product release is investigation context, not evidence that the release caused the decline: compare funnel segments, release exposure, experiment data, and logs before attributing the change.
Data completeness matters: data freshness changes this comparison only after the window is complete.
If Friday’s data is incomplete or late, hold the business alert until the completeness window closes and send a separate data alert to the owner. The table assumes all seven daily periods are fully loaded.[9][12][13]
Build, Test, and Review Governed Alerts
Once you choose a trigger rule, turn it into a governed alert contract before production. Define the metric first, then write a separate alert contract covering data freshness, sample size, completeness, persistence, cooldown, severity, owner, backup owner, and escalation deadline.
Keep metric logic separate from notification logic. Give responders a runbook with validation steps, rollback or mitigation options, and likely causes.
Test Alerts Against Past Incidents
Replay known incidents, seasonal periods, and major pricing or product changes. Measure actionable notifications, duplicates, missed incidents, false positives, and detection delay by segment, not just overall.
Before enabling delivery, run the candidate rule in shadow mode: log evaluations without notifying responders. Store the metric definition, SQL or Python, configuration, test results, and approvals in version control alongside dbt changes.
Review high-volume alerts monthly and lower-frequency alerts at least quarterly. Check suppressed evaluations and quiet periods, not just notifications. Retest after changes to pricing, checkout, tracking, or traffic mix.
Use Querio for Governed Alert Investigations
Use Querio to investigate alerts against live warehouse data with inspectable SQL and Python and governed context. It connects to Snowflake, BigQuery, and Redshift without CSV exports. Analysts can inspect and edit investigation logic in reactive notebooks.
Context files synced to GitHub alongside dbt preserve shared definitions. Governed self-serve lets business users investigate within approved permissions.
Querio can schedule saved analyses or prompt-driven investigations and deliver findings to Slack or email. But not every alert control belongs in the BI layer. Sample gates, persistence, cooldowns, shadow-mode logs, and escalation policies may need SQL, Python, or orchestration outside Querio. Document where each control runs and who maintains it.
Conclusion: Match Alerts to Business Risk
Treat alerts as governed policy, with clear metric logic, notification logic, ownership, and regular review. If data is incomplete or stale, address the data-quality alert first. Aim for timely action on real business risk - not lower notification volume alone.
FAQs
::: faq
How do I set baselines for a new metric?
Use historical data from your warehouse to establish what normal behavior looks like. Start with rolling medians or means before trying more complex models. Account for weekly or monthly cycles, and flag known events, such as product launches or outages, so they don’t trigger false alarms.
Set thresholds around your team’s capacity to investigate alerts, not universal industry benchmarks. :::
::: faq
How do I catch incidents in low-volume segments?
Don't rely on single-point thresholds: normal variation can trigger false alarms. Instead, group data into longer time windows, compare performance with past periods such as the same weekday or hour, and alert only after multiple consecutive observations cross a threshold.
Use governed metrics to keep segment definitions consistent. That helps prevent metric drift from being mistaken for an incident. Persistence checks reduce noise, but they can also delay detection of urgent issues. :::
::: faq
How do I balance detection speed against false alarms?
Use dynamic thresholds that account for seasonality and normal variation. Add persistence windows so alerts fire only when changes last long enough to warrant attention. Match alert severity to your team’s capacity: send urgent issues to PagerDuty and low-confidence signals to Slack.
Link alerts to governed warehouse metrics, assign clear owners, and review false positives. Querio’s governed semantic layer and inspectable SQL/Python let you check the logic and tune thresholds based on business impact. :::