Business Intelligence
8 Best AI-Powered Data Analysis Tools for Non-Technical Users in 2026
Compare eight AI tools that let non-technical teams query live warehouses, get explainable results, and enforce governed metrics.
Struggling with data analysis but don’t know SQL? AI-powered tools now let non-technical users analyze live data directly from warehouses like Snowflake, BigQuery, and Redshift. These tools allow you to ask plain-English questions and get instant, accurate insights - no coding needed, often using a SQL query builder for business users. Here’s a quick rundown of the top 8 tools:
Querio: Direct live data queries with inspectable SQL/Python and governed metrics for consistent insights. Starts at $400/month for 10 users.
ThoughtSpot: Google-like search for live data with explainable logic. Best for teams needing simple, search-driven analytics.
Power BI with Copilot: Works within Microsoft 365, using AI to generate DAX queries for live or imported data.
Tableau with Tableau AI & Pulse: Combines visual insights with automated narrative summaries for KPI tracking.
Looker: Live queries powered by LookML, ideal for teams prioritizing a centralized data model.
Hex: Collaborative notebooks for analysts to build interactive apps for stakeholders.
Tellius: AI-driven “Auto-Insights” to explain trends and anomalies in live data.
Julius AI: Simple chat-based analysis for static CSV/Excel files, priced at $20/month.
These tools vary in features, governance, and pricing, so choose based on your team’s data needs and expertise.
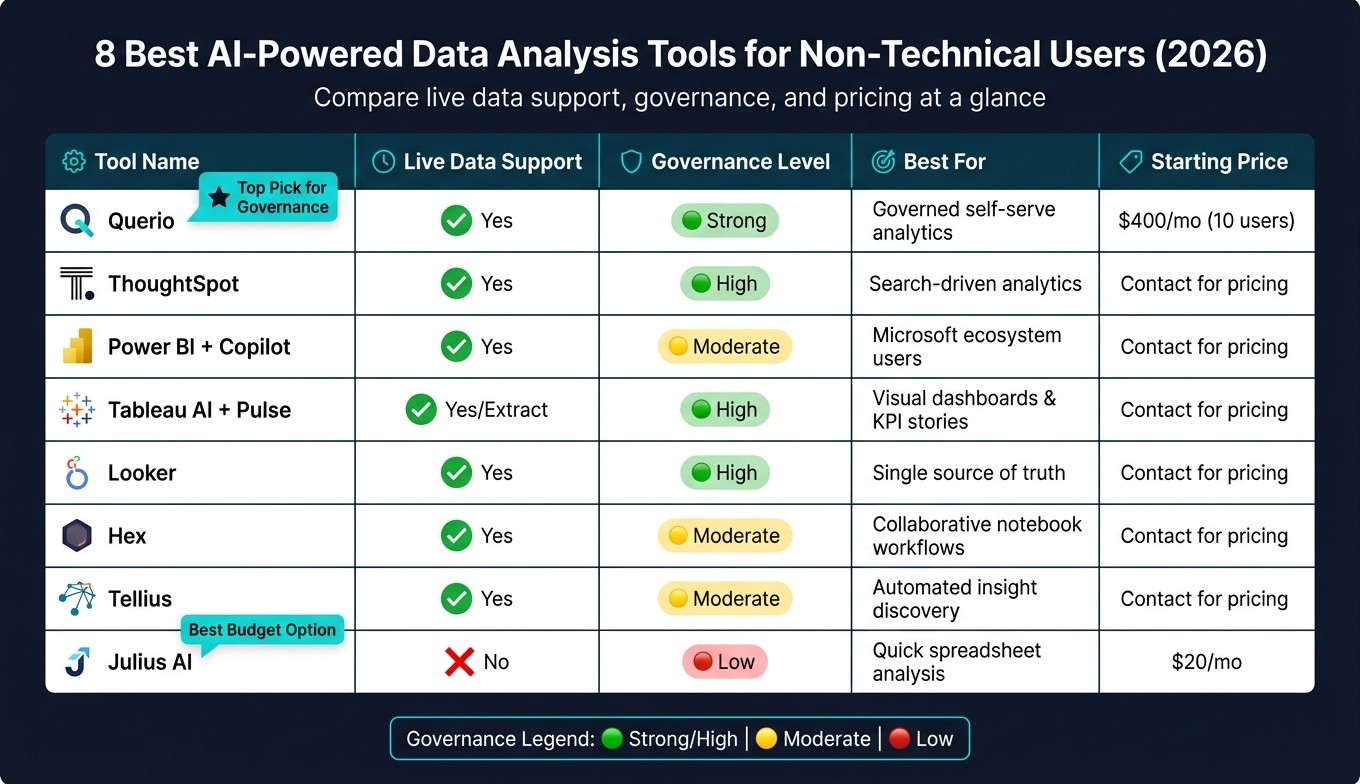
Quick Comparison
Tool | Live Data Support | Governance Level | Best For | Starting Price |
|---|---|---|---|---|
Querio | Yes | Strong (semantic layer) | Governed self-serve analytics | $400/month (10 users) |
ThoughtSpot | Yes | High | Search-driven analytics | Contact for pricing |
Power BI | Yes | Moderate | Microsoft ecosystem users | Contact for pricing |
Tableau | Yes/Extract-based | High | Visual dashboards and KPI storytelling | Contact for pricing |
Looker | Yes | High (via LookML) | Teams needing a single source of truth | Contact for pricing |
Hex | Yes | Moderate | Collaborative, notebook-style workflows | Contact for pricing |
Tellius | Yes | Moderate | Automated insight discovery | Contact for pricing |
Julius AI | No (static files) | Low | Quick spreadsheet analysis | $20/month |
Each tool has unique strengths - Querio stands out for governed, inspectable analytics, while Julius AI is perfect for simple, file-based tasks. Select based on your team’s infrastructure and reporting needs.
8 Best AI Data Analysis Tools for Non-Technical Users (2026)
What Non-Technical SaaS Teams Need from AI Data Analysis Tools
AI-powered data analysis tools are a game-changer for non-technical users in mid-market B2B SaaS companies. These tools allow users to ask questions in plain English and get immediate answers from live data - no technical expertise required. For non-technical teams, speed and reliability are key. They need tools that eliminate the bottlenecks of technical mediation and deliver accurate insights on demand.
However, not all tools are created equal. A product manager, for example, doesn’t need the same level of granular technical detail as a data analyst. What they do need is a solution that connects directly to live data warehouses, bypassing the delays caused by manual CSV uploads or scheduled refreshes. Transparency is equally important - users should be able to inspect and edit the logic behind the results. These factors are crucial when evaluating which tools best meet the needs of non-technical teams.
Governance is another critical factor. Imagine multiple teams pulling the same metric, like monthly recurring revenue, only to report conflicting numbers. The problem isn’t the data itself - it’s the lack of a shared, centralized definition. A strong AI analysis tool ensures consistency by enforcing governed metric definitions across the organization. This creates a single source of truth, so teams like finance and sales can align on their data.
Here’s a closer look at the criteria used to evaluate these tools:
Criteria | Why It Matters |
|---|---|
Live warehouse connection | Ensures real-time data access with no stale exports - queries run directly on platforms like Snowflake, BigQuery, Redshift, or Postgres. |
Empowers business users to ask questions without needing to write SQL or DAX, making insights accessible to everyone. | |
Transparent logic | Allows users to inspect and edit the generated SQL or Python code, ensuring clarity and adaptability. |
Governed semantic layer | Standardizes metric definitions across teams, creating a unified data source for the entire organization. |
Scalability & pricing | Flat-fee pricing models support growing teams more effectively than per-user pricing structures. |
Setup speed | Reduces barriers to adoption by enabling quick configuration and faster access to insights. |
These criteria ensure that tools bridge the gap between business questions and trustworthy answers, all while minimizing reliance on technical teams. Querio stands out as a prime example, offering live warehouse connections and a governed semantic layer that keeps teams aligned and informed.
1. Querio

Querio is an AI-driven analytics workspace built for teams that need quick and accurate insights directly from live warehouse data. It integrates seamlessly with popular data warehouses like Snowflake, Google BigQuery, Amazon Redshift, Databricks SQL, PostgreSQL, ClickHouse, and MySQL, enabling real-time queries without the hassle of exporting CSVs or working with outdated data extracts.
What makes Querio stand out is its conversational AI interface. Users without technical expertise can simply type questions such as, "What was our MRR growth last quarter by customer segment?" and get instant visual answers. Even better, the tool provides fully inspectable SQL, so users can see the logic behind the results and tweak it if necessary.
Another major strength of Querio is its governed semantic layer, which is a game-changer for SaaS teams handling data. Here’s how it works: data teams define metrics, joins, and business terms centrally, ensuring these definitions are applied uniformly across all queries, dashboards, and AI-generated answers. This eliminates the common issue of conflicting metrics - for example, when finance and sales teams report different churn or ARR figures.
Feature | Querio's Governed Approach | Basic Approach |
|---|---|---|
Metric Definition | Centralized in a shared context layer | Scattered across individual dashboards |
Data Source | Live warehouse (e.g., Snowflake, BigQuery) | Static CSV uploads or periodic extracts |
Logic Visibility | Transparent SQL/Python logic | Opaque or proprietary logic |
Consistency | Versioned logic ensures uniformity | Prone to metric drift between teams |
Access Control | Often limited or manual controls |
These features not only maintain accuracy and consistency but also make onboarding a breeze. You can connect your data warehouse and start querying in about 15 minutes. Pricing begins at $400/month for 10 users, with many plans offering unlimited users - an appealing option for mid-market SaaS teams looking to scale without worrying about skyrocketing per-user costs.
2. ThoughtSpot
ThoughtSpot offers a search-first approach to data analysis. Instead of relying on dashboards or writing SQL queries, users can simply type questions into a Google-like search bar powered by an AI assistant called Spotter. This tool directly queries cloud data warehouses - like Snowflake, Google BigQuery, and Amazon Redshift - in real time, giving users instant access to live data. This setup makes it easier for non-technical teams to extract insights without needing advanced technical skills.
One standout feature is ThoughtSpot's focus on transparency. Every query generates either inspectable SQL or explainable logic, allowing users to trace how an answer was derived. This means business users don’t have to blindly trust the results - they can actually see the reasoning behind them. The AI assistant has also advanced significantly. The latest version, Spotter 3 (currently in Early Access), goes beyond simple token-based searches, offering analyst-level reasoning with a verifiable query plan.
Spotter Version | Query Logic | Transparency |
|---|---|---|
Spotter Classic (v1) | Token-based search | Inspectable SQL |
Spotter Agent (v2) | Explainable formulas | Explainable logic |
Spotter 3 (Early Access) | Analyst-grade reasoning | Verifiable plan/reasoning |
On the privacy front, ThoughtSpot has a thoughtful default: it only shares metadata with language models, keeping actual data values private unless explicitly allowed by the organization. This is particularly reassuring for SaaS teams managing sensitive customer or revenue data.
However, there are trade-offs. The quality of the search experience depends heavily on the underlying semantic model or traditional data model, which requires technical setup during implementation. Additionally, since ThoughtSpot runs live queries against your data warehouse, heavy usage can lead to increased compute costs. A centralized semantic layer can help mitigate these expenses by reducing redundant queries and ensuring consistent metric definitions. While ThoughtSpot is a great choice for non-technical teams, having a data engineer to handle the initial setup is essential. These factors highlight the balance between ease of use and the technical demands of maintaining a well-optimized system.
3. Power BI with Copilot

Power BI with Copilot brings AI-powered analytics right into the Microsoft 365 ecosystem, making data insights more accessible for non-technical users. With Copilot, you can simply type natural language queries, and it transforms them into live DAX queries, pulling data from sources like Azure Synapse, Snowflake, and BigQuery. This setup simplifies data exploration for teams already working within Microsoft's environment.
One standout feature is the "How Copilot arrived at this" diagnostic tool. Instead of just presenting results, Copilot allows users to dig into the reasoning behind its insights. This added transparency is a big deal for teams that rely on accurate data to make critical decisions, moving away from the "black-box" nature of many AI tools.
That said, the effectiveness of Copilot hinges on a well-prepared semantic model. Report authors must provide clear, concise descriptions (limited to 200 characters) for every measure and column. This step ensures Copilot interprets data correctly and delivers reliable results.
Security and migration are also key considerations. Microsoft recommends using Object-Level Security (OLS) over Row-Level Security (RLS) during Copilot's preview phase, as RLS may not be fully respected, which could expose sensitive data. Additionally, Copilot is currently unavailable in sovereign cloud environments. For teams still relying on Power BI's legacy Q&A visuals, it's worth planning ahead - those visuals will no longer be supported after December 2026, which could lead to broken dashboards if not addressed in time. This shift highlights Microsoft's focus on creating a more transparent and governed analytics experience.
Feature | Power BI with Copilot |
|---|---|
NLQ Approach | Generative AI (DAX-focused) |
Transparency | "How Copilot arrived at this" diagnostic feature |
Warehouse Connections | Azure Synapse, Snowflake, BigQuery (live + import) |
Best For | Teams using Microsoft 365/Azure ecosystem |
Main Weakness | DAX complexity; reliance on pre-built semantic models |
4. Tableau with Tableau AI and Tableau Pulse
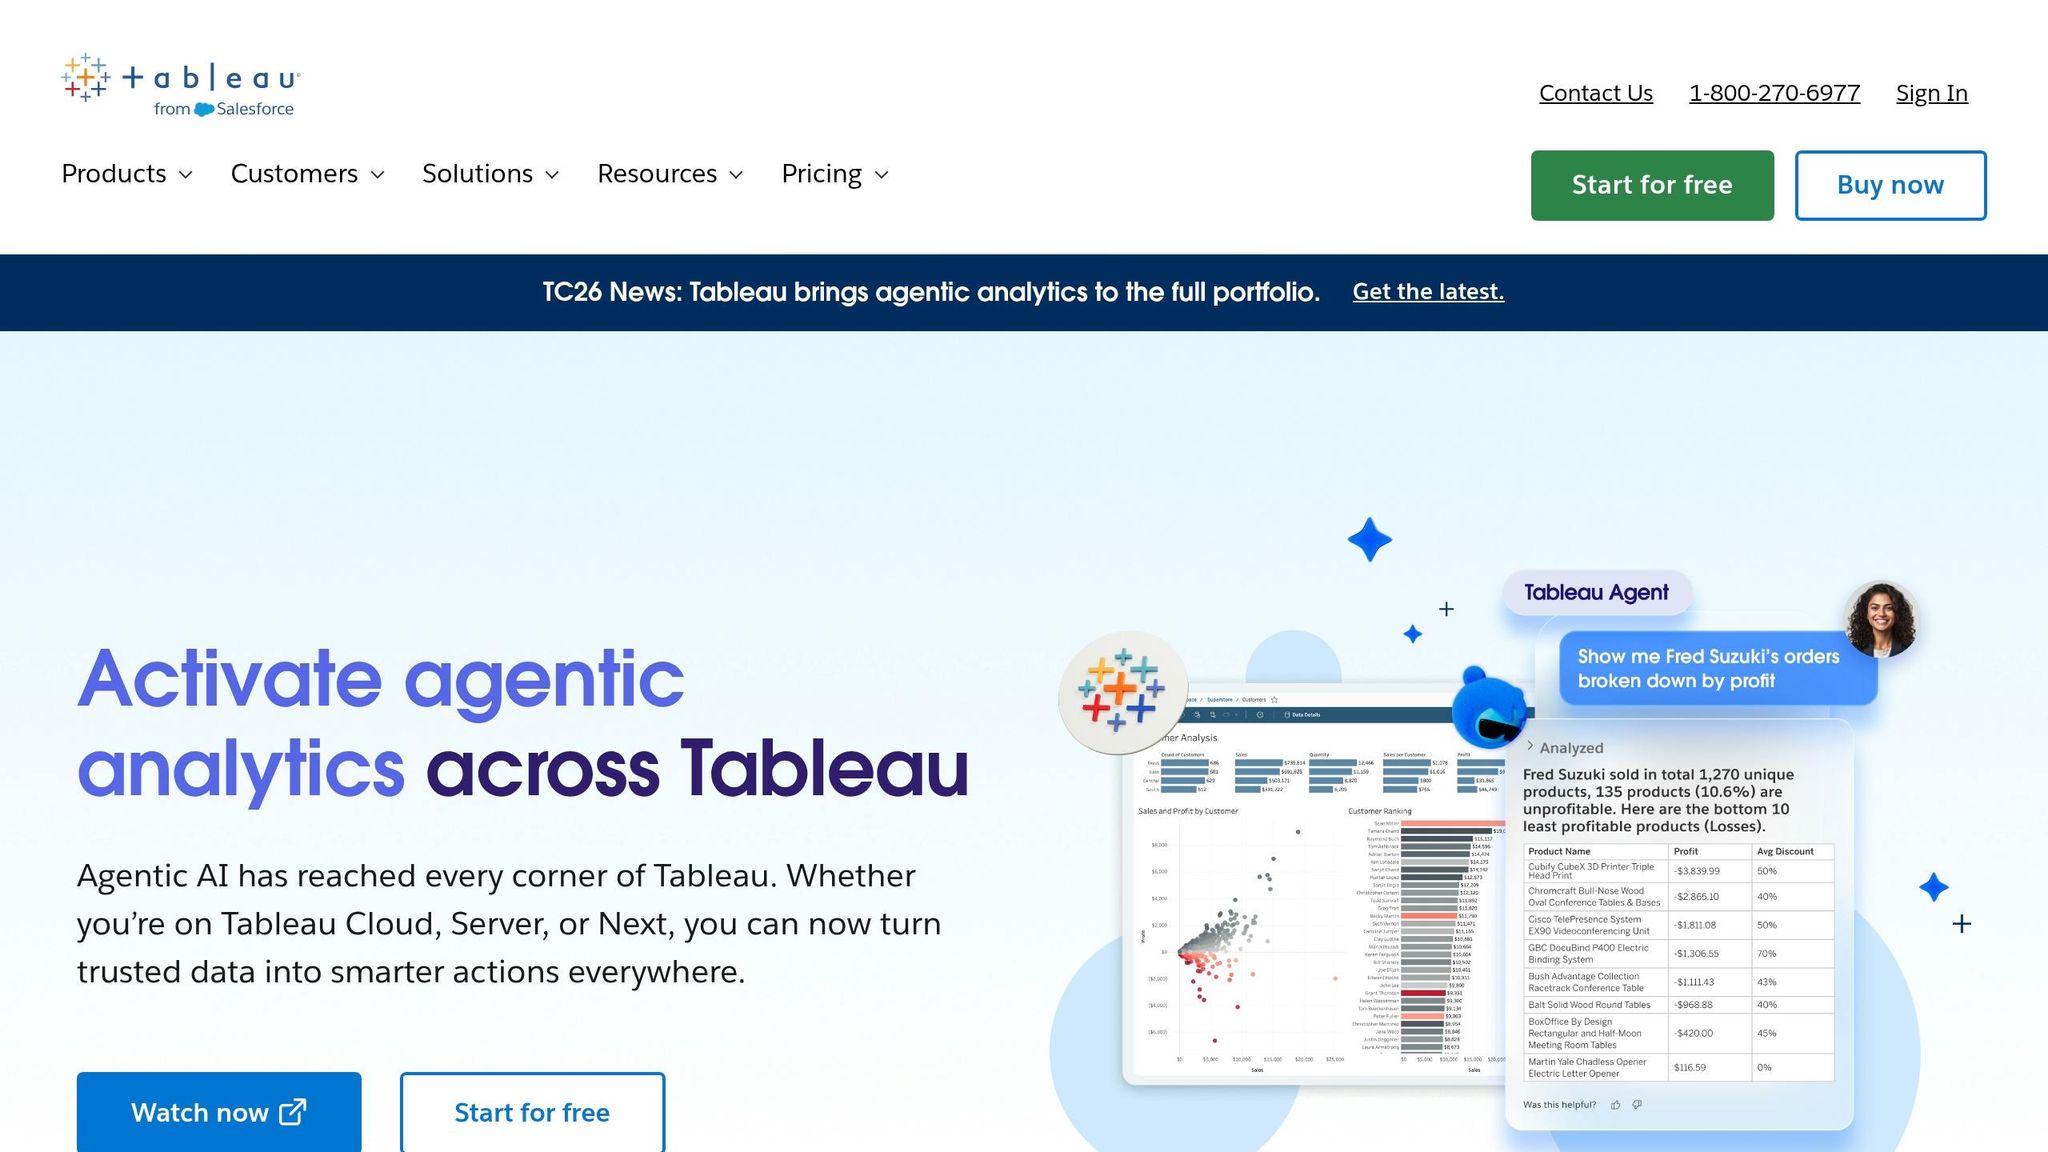
Tableau's 2026 updates - Tableau AI and Tableau Pulse - make it easier for non-technical users to uncover insights without needing to write code. At the heart of these updates is Tableau Agent, a natural language interface that works alongside Tableau Pulse to provide visual answers and automated narratives about key performance indicators (KPIs).
Tableau Pulse simplifies staying informed by delivering written summaries of changes in your data - like why revenue is dropping or churn is rising - without requiring users to build dashboards. Instead of relying on traditional dashboards, Pulse actively flags important shifts, making insights more accessible and actionable.
For governance, Tableau incorporates the Einstein Trust Layer, which ensures personal data masking and enforces security policies across AI-generated outputs. This is especially relevant for SaaS teams managing sensitive customer data. However, Tableau's decentralized governance can sometimes lead to inconsistent metric definitions across workbooks. This is particularly challenging when teams prioritize performance-optimized extracts over live data connections. Unlike solutions with centralized semantic layers and AI, such as Querio, Tableau requires extra effort to maintain consistent metrics while balancing data freshness and performance.
Tableau is optimized for its proprietary .hyper extract format, which offers smoother performance compared to live connections. While live connections are available for tools like Snowflake, BigQuery, and Redshift, the .hyper extracts often rely on slightly outdated data - something to keep in mind for teams needing real-time updates.
Feature | Tableau AI / Pulse |
|---|---|
Primary AI Interface | Tableau Agent (Natural Language) |
Insight Delivery | Automated KPI narratives via Tableau Pulse |
Governance Framework | Einstein Trust Layer (PII masking, security) |
Data Connection | Best with .hyper extracts; supports live warehouse query |
Target User | Business users needing guided visual insights |
Tableau is ideal for teams seeking guided, visual analytics and already using Salesforce. However, challenges arise when consistent, centralized metric definitions are required across live data warehouses. Tableau's reliance on extracts and decentralized governance can create hurdles in these situations. Still, its combination of natural language querying and proactive insights makes it a strong choice for teams prioritizing guided analytics and automated KPI updates.
5. Looker
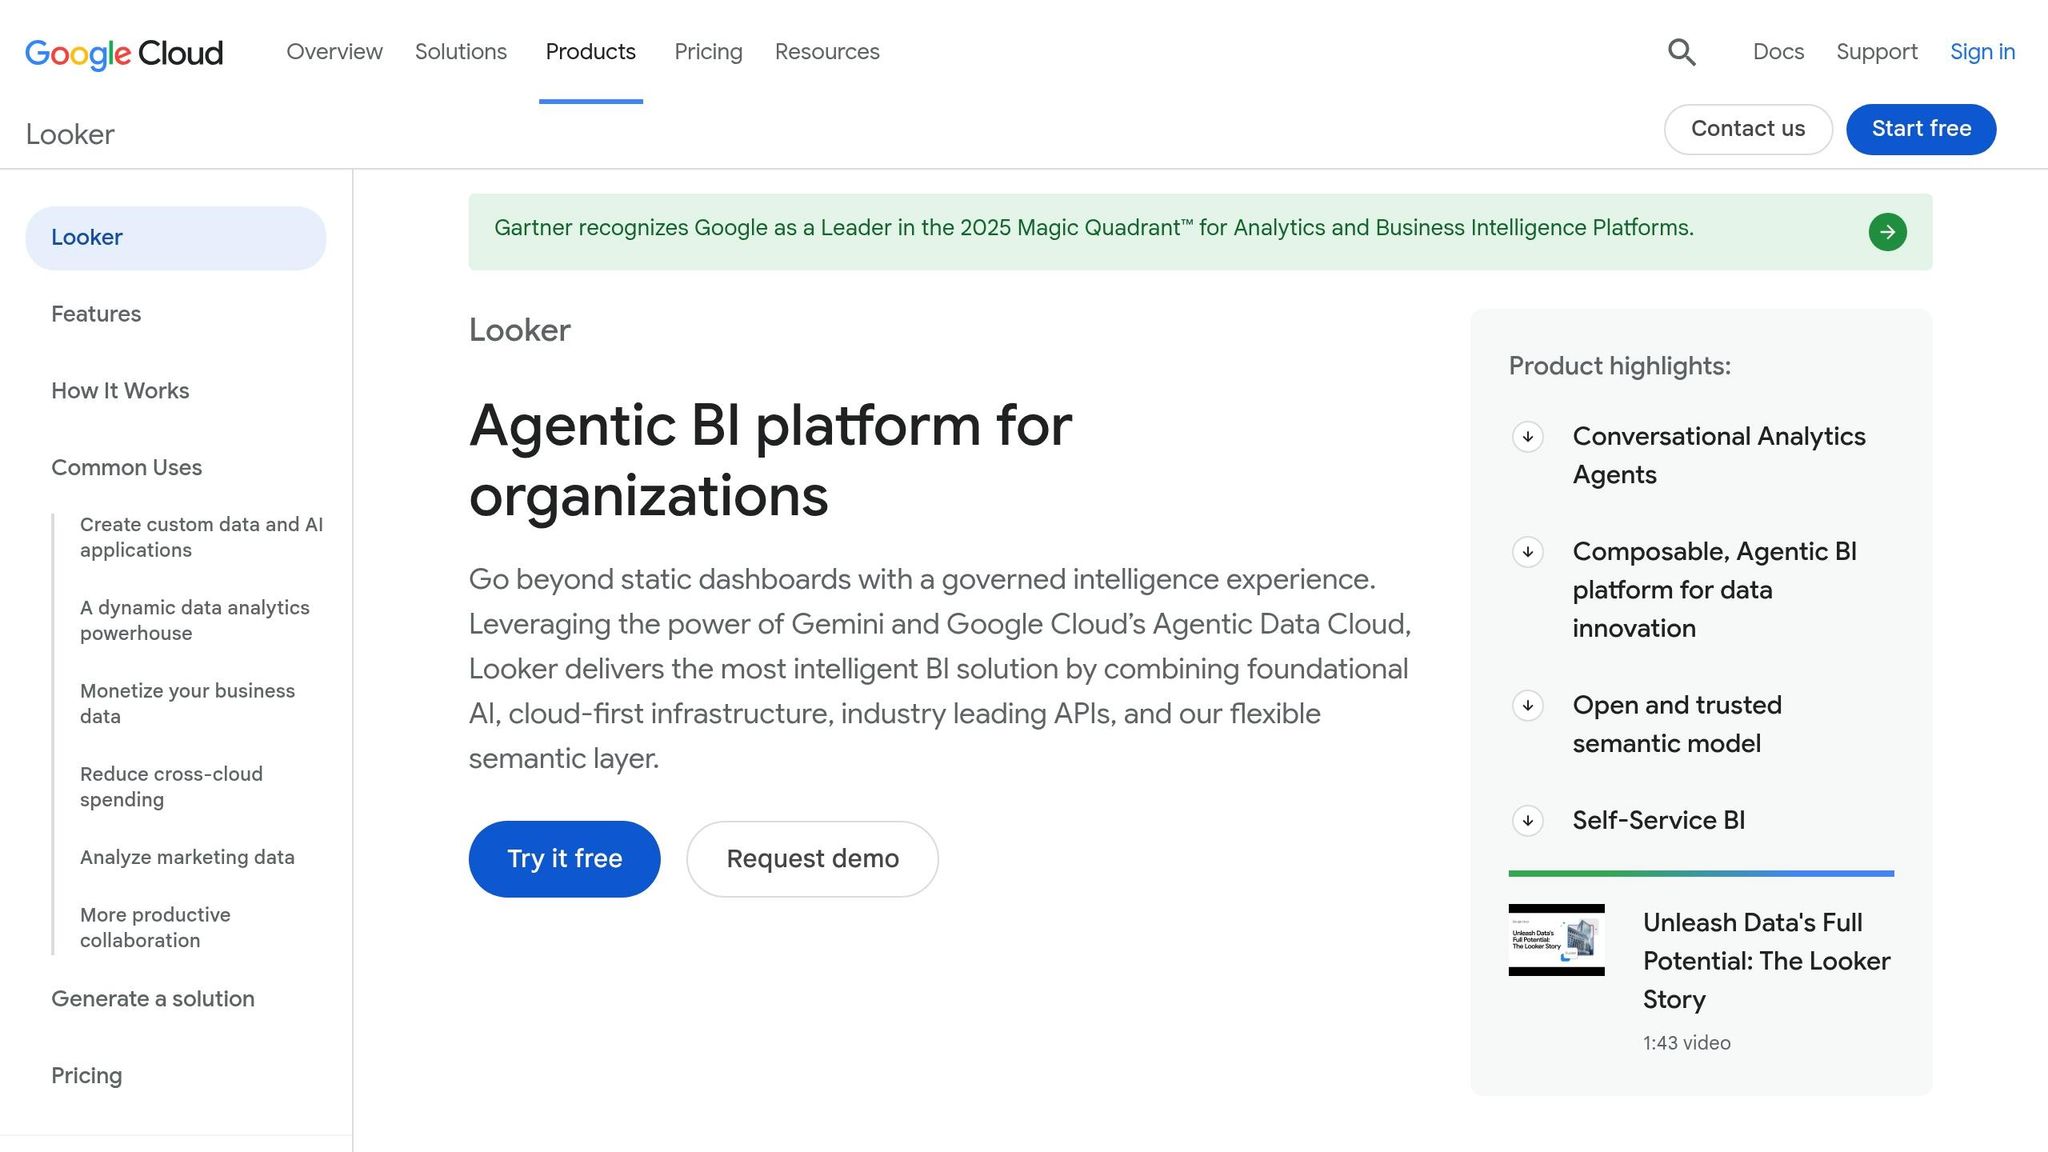
Looker, now part of Google Cloud, connects directly to your data warehouse - whether that's Snowflake, BigQuery, Redshift, Postgres, or another option - using live queries to ensure you're always working with up-to-date data.
At the heart of Looker’s governance system is LookML, a proprietary modeling language. LookML centralizes metric definitions, relationships, and business logic, creating a structured framework for analytics. When done right, LookML enables non-technical users to explore data through a curated interface with consistent metrics. However, developing and maintaining this model requires specialized expertise. Unlike tools with fully managed semantic layers, Looker relies on dedicated upkeep of its LookML model, which can limit the tool’s ability to deliver a fully self-serve analytics experience.
Even with AI-assisted query features designed to suggest relevant Explores and filters, non-technical users often need help from analysts to finalize their queries.
Feature | Looker |
|---|---|
Primary Interface | LookML model combined with AI-assisted query features |
Governance Model | Centralized via the LookML semantic layer |
Data Connection | Live warehouse-native (Snowflake, BigQuery, Redshift, Postgres) |
Non-Technical Access | Guided Explores (performance depends on the LookML model quality) |
Key Limitation | Requires specialized LookML expertise to build and maintain the model |
Looker’s approach excels for teams that can dedicate resources to crafting and managing a high-quality LookML model. When done well, the self-serve analytics experience can be powerful. However, for teams without the bandwidth or expertise to maintain the model, achieving the full potential of governed, self-serve analytics may prove difficult.
6. Hex

Hex is a collaborative data workspace designed around a notebook model that integrates SQL, Python, charts, and interactive controls. It connects directly to databases like Snowflake, Google BigQuery, Amazon Redshift, Databricks, and PostgreSQL, allowing users to run live queries instead of relying on static data extracts.
One of Hex's standout features is its notebook-to-app workflow. Analysts can write logic in a notebook and then use a drag-and-drop interface to turn specific outputs into interactive applications. These apps let stakeholders interact with data through tools like sliders, dropdown menus, and date pickers - without needing to see or understand the underlying code. This setup creates a clear distinction between the analysts building the analysis and the stakeholders consuming it.
Another major advantage is Hex's real-time collaborative editing. Similar to how Google Docs works for documents, Hex allows data teams to co-edit notebooks, share comments, and collaborate without version conflicts. This feature makes teamwork smoother and more efficient.
However, Hex's analyst-first design introduces some limitations.
Feature | Hex |
|---|---|
Primary Interface | Collaborative notebooks + published interactive applications |
Warehouse Connections | Snowflake, Google BigQuery, Amazon Redshift, Databricks, PostgreSQL (live) |
Non-Technical Access | Interactive applications built from notebook outputs |
Collaboration | Real-time collaborative editing |
Key Limitation | Non-technical users rely on analysts to create and maintain notebooks |
The main trade-off is that Hex prioritizes analysts. Non-technical users can interact with the applications analysts create, but they can't easily explore new questions or data on their own. Additionally, Hex lacks a built-in governed semantic layer, which ensures consistent metric definitions across an organization. This means the quality of self-serve analytics depends heavily on the upkeep of the underlying notebooks. For teams that need governed, ad hoc exploration for business users - beyond just curated dashboards - this can be a notable drawback compared to tools like Querio, which include a governed semantic layer for consistent metrics.
7. Tellius

Tellius offers a search-first interface that simplifies data exploration for non-technical users. Instead of navigating complex dashboards, users can type plain-language questions, which are instantly converted into SQL or Spark queries. These queries run live on data warehouses like Snowflake, Google BigQuery, Amazon Redshift, Databricks, and Azure Synapse. The result? No need for data duplication, messy CSV exports, or maintaining separate ETL pipelines.
What makes Tellius stand out is its AI-powered "Auto-Insights" engine. This feature doesn’t just answer your question - it goes a step further by explaining the "why" behind the numbers. For instance, a revenue operations manager could ask, "Why did churn increase last quarter?" and receive a ranked breakdown of contributing factors, without needing to manually sift through data or form hypotheses in advance. It’s a proactive approach to uncovering trends, drivers, and anomalies.
Tellius also addresses governance with its centralized semantic layer. This allows data teams to define business logic, metrics, and joins in one place, ensuring consistency. For example, whether someone in Finance or Sales asks the same question, the answer will always align, avoiding discrepancies caused by ad hoc analyses.
Here’s a quick breakdown of Tellius’s key features:
Feature | Tellius |
|---|---|
Primary Interface | Natural language search (Google-like) |
Warehouse Connections | Snowflake, BigQuery, Redshift, Databricks, Azure Synapse (live) |
Non-Technical Access | Plain English queries auto-converted to SQL/Spark |
AI Insights | Automated driver analysis, trend detection, anomaly surfacing |
Governance | Centralized semantic layer for consistent metric definitions |
For B2B SaaS data teams, Tellius excels in automated insight discovery, making it ideal for scenarios where users aren’t sure what questions to ask. However, if transparency and control over the underlying SQL are critical, Tellius may feel limiting. In such cases, tools like Querio offer a more open approach, allowing users to inspect and modify queries directly. This level of transparency ensures both analysts and business users can trust the analytics, making it a strong alternative for teams seeking governed, editable solutions.
8. Julius AI
Julius AI stands out by focusing on scenarios where static file analysis is enough. Instead of live connections to data warehouses, it relies on manual file uploads, allowing users to explore CSV and Excel files through a straightforward, plain-English chat interface.
Getting started is quick and simple. A user from Finance or HR can upload a file and begin asking questions within minutes - no IT support needed. Julius takes care of tasks like generating Python scripts, cleaning data, and creating visualizations, all while keeping the interface user-friendly. It even handles more advanced analyses, such as linear regression and trend forecasting. And at just $20/month, it’s an affordable option.
However, Julius AI has a key limitation for B2B SaaS data teams: it lacks live data connectivity. Without direct integration with enterprise warehouses like Snowflake, BigQuery, or Redshift, all analyses are based on static snapshots rather than real-time data. For teams monitoring churn, pipeline metrics, or product usage in real-time, this can be a significant drawback.
In summary, Julius AI is ideal for quick, one-off analyses of static files. But for teams that need live data, governed metrics, and the ability to inspect SQL, tools like Querio provide a more robust solution. This includes the ability to create a governed metrics layer to ensure consistency across the organization.
Feature | Julius AI |
|---|---|
Data Connection | Manual CSV/Excel uploads |
Live Warehouse Support | Not available |
Non-Technical Access | Chat-based, plain English prompts |
AI Capabilities | Cleaning, summarization, regression, forecasting, visualizations |
Governance | Minimal; no role-based access or semantic layer |
Starting Price | $20/month |
For anyone needing quick, ad-hoc analysis on static files, Julius AI is a practical choice. But for more complex needs involving live data and enterprise-grade analytics, other tools may be better suited.
Tool Comparison Table
When selecting a tool, consider your team's data storage needs, access requirements, and governance priorities. The table below highlights the core strengths of each tool, providing a quick reference to help you align your goals with the right solution. Querio stands out with its governed semantic layer, inspectable SQL/Python, and live warehouse connectivity, setting a strong standard for these factors.
Tool | Warehouse Integration | AI Features | Governance | Best-Fit Use Case |
|---|---|---|---|---|
Querio | Live connections to Snowflake, BigQuery, Redshift, ClickHouse, PostgreSQL | Conversational AI generating inspectable SQL/Python | Strong – centralized semantic layer, versioned logic, full audit trails | Teams needing governed, self-serve analytics with live warehouse data |
ThoughtSpot | Live cloud query (Snowflake, BigQuery, Redshift) | Search-driven AI via Spotter with verifiable query plans | High – shares only metadata with language models by default | Non-technical teams seeking a "Google-like" search experience |
Power BI with Copilot | Microsoft ecosystem; live DirectQuery or imports | Generative Copilot producing DAX with "How it arrived" diagnostics | Moderate – depends on well-prepared semantic models and OLS | Organizations deeply embedded in Microsoft 365 |
Tableau with Tableau AI & Pulse | Extracts or live query; strong Salesforce/cloud integrations | Metrics-driven AI Agent and Pulse digest summaries | High – Einstein Trust Layer for PII masking and toxicity scoring | Executive-level visual dashboards and KPI storytelling |
Looker | Live warehouse connections via LookML; supports Snowflake, BigQuery, Redshift | AI-assisted exploration governed by the LookML semantic layer | High – LookML ensures consistent metrics across queries | Data teams requiring a single source of truth |
Hex | Live connections to Snowflake, BigQuery, Redshift, Postgres, dbt | AI-assisted SQL/Python notebooks; Magic AI for query generation | Moderate – features version control and shared logic, but with less formalized governance | Analysts building collaborative, notebook-style data products |
Tellius | Connects to cloud warehouses and databases | Automated insight discovery combined with natural language search | Moderate – provides basic role-based access | Business teams looking for automated analysis to understand changes |
Julius AI | Manual CSV/Excel uploads only | Chat-based Python generation for cleaning, regression, and forecasting | Low – lacks role-based access and a semantic layer | Individual operators performing one-off spreadsheet analysis |
A few key patterns emerge from this comparison:
Warehouse-native tools like Querio, ThoughtSpot, Looker, and Hex directly query live data, making them ideal for recurring, team-wide reporting. In contrast, file-based tools like Julius AI rely on manual uploads, which are better suited for one-time tasks.
Governance varies significantly: Querio and Looker provide consistent metrics through their semantic layers, while Tableau and Power BI rely on pre-built semantic models. Tellius and Julius AI offer more basic governance frameworks.
These insights highlight the importance of live connections, transparent logic, and governance in enabling effective, self-serve analytics.
Conclusion
Choosing the right tool boils down to your team’s data structure, usage habits, and governance priorities. If your team operates a live data warehouse and needs non-technical users to access consistent, governed insights without relying on CSV exports or analyst intervention, warehouse-native tools are the way to go.
For teams that value full transparency - where every AI-generated output can be traced back to inspectable SQL or Python - Querio is designed for that workflow. Its centralized semantic layer ensures terms like "MRR" or "active users" mean the same across departments, whether it's a product manager or finance lead asking the question. If your team prefers search-driven analytics or a single source of truth via LookML, ThoughtSpot and Looker are excellent choices. Meanwhile, Power BI with Copilot and Tableau with Tableau AI are ideal if your organization already operates within the Microsoft or Salesforce ecosystems. Analyst teams looking for collaborative, notebook-style workflows with live data access will find Hex to be a great fit. For automated insight discovery rather than traditional self-serve reporting, Tellius stands out. Lastly, Julius AI is more suited for individual, one-off analysis on spreadsheet data rather than recurring team-wide reporting.
Ultimately, your choice should align with your data infrastructure, team expertise, and governance needs. File-based tools and black-box AI solutions often falter when consistency and auditability become critical. With its governed semantic layer and inspectable SQL/Python, Querio offers a standout option for teams prioritizing real-time insights and reliable, consistent reporting.
Related Blog Posts


