What Is a Business Intelligence Platform and How Does It Work?
What is a business intelligence platform? This guide explains how modern BI tools work, their key features, and how to choose the right one for your business.
https://www.youtube.com/watch?v=tPzvu9rLbeM
published
Outrank AI
business intelligence platform, what is a business intelligence platform, bi tools, ai analytics, self service bi
a82570d0-0294-48ac-808c-5d19478d50be

Think of a business intelligence (BI) platform as your company's central nervous system for data. It’s a software suite that pulls in all the raw, often chaotic, information from every corner of your business—sales, marketing, customer support, you name it—and turns it into clear, useful insights. In simple terms, it helps everyone make smart decisions based on real evidence, not just gut feelings.
Your Business GPS: From Data to Decisions
Trying to run a business without BI is like navigating a new city without a map. You know where you want to go (your goals), but you have no reliable way to get there. You'll likely make wrong turns, hit dead ends, and burn through time and money.
A BI platform is that sophisticated GPS for your entire organization. It plots your current location (all that raw data spread across countless apps and databases) and helps you map the most efficient route to your destination (your key business objectives). It does more than just show you the way; it alerts you to traffic jams (inefficiencies), points out shortcuts (new opportunities), and gives you real-time updates (emerging trends).
Moving Beyond Basic Spreadsheets
For a long time, spreadsheets were the go-to tool for analytics. They’re fine for simple tasks, but they quickly create bottlenecks as a company grows. Data ends up trapped in separate files, reports need to be updated by hand—a process riddled with human error—and the insights are often stale by the time anyone sees them. It's a scary thought, but a staggering 88% of spreadsheets contain errors, a risk no growing business can afford.
Modern BI platforms sidestep these issues by automating the entire workflow. They connect directly to your live data sources, so the information is always fresh and accurate. This frees up your team from the tedious work of report-building and lets them focus on what really matters: understanding the story the data is telling and deciding what to do next.
The real magic of a BI platform isn't just showing you what happened last quarter. It's giving your team the power to ask why it happened and what you should do about it tomorrow. It shifts the entire conversation from data collection to strategic action.
The Power of Asking Questions in Plain English
The biggest game-changer in BI today is the integration of AI. Older, traditional platforms were notoriously difficult to use, often demanding deep knowledge of SQL or other complex query languages. If a marketing manager needed to know which campaign drove the most sign-ups last month, they’d have to submit a request to the data team and wait in line.
AI-powered BI platforms, like Querio, completely flip that script. They let anyone on the team, regardless of their technical background, ask sophisticated questions in plain English and get immediate answers. For example, a product leader can just type, "Show me user engagement for our new feature, broken down by subscription plan," and see a clear chart in seconds. To dig deeper into the fundamentals, check out our guide on the core concepts of business intelligence and analytics.
This self-serve model changes everything:
Faster Decision-Making: No more waiting days or weeks for a report. Teams can get answers to urgent questions on the spot, allowing them to pivot quickly and confidently.
Deeper Insights: The conversational interface sparks curiosity. It's easy to ask follow-up questions, drill down into interesting outliers, and uncover hidden trends that a standard report would have missed.
Reduced Bottlenecks: Data analysts are no longer buried under a mountain of routine reporting requests. Instead, they can focus their expertise on high-impact projects, like building better data models or tackling the company's toughest analytical challenges.
To wrap it up, let's break down these core functions into a simple table.
Core Functions of a Business Intelligence Platform at a Glance
This table simplifies what a BI platform actually does with your data, from the initial collection to the final insight.
Function | What It Does for Your Data | Why It Matters for Your Team |
|---|---|---|
Data Integration | Connects to and pulls data from all your sources (CRM, ads, databases) into one place. | You get a single, unified view of the business instead of fragmented, conflicting reports. |
Data Storage | Organizes and stores the collected information efficiently in a data warehouse or data lake. | Ensures your data is clean, secure, and ready for fast analysis whenever you need it. |
Data Analysis | Processes and queries the stored data to answer specific business questions. | This is where raw numbers are turned into meaningful metrics, like customer lifetime value or churn rate. |
Data Visualization | Presents insights through interactive dashboards, charts, and graphs. | Makes complex data easy for anyone to understand at a glance, spotting trends and patterns instantly. |
Reporting & Delivery | Automates the creation and sharing of reports with the right people at the right time. | Keeps everyone informed and aligned, ensuring decisions are based on the latest information. |
Ultimately, a business intelligence platform is more than just a tool—it's a catalyst for building a data-driven culture. It puts powerful insights into the hands of every employee, empowering them to make smarter, more informed choices that drive the company forward.
The Building Blocks of a Modern BI Platform
To really get what a BI platform does, you have to look under the hood. I like to think of it like a high-end coffee shop. You don't just get a generic cup of coffee; you get a perfectly crafted drink that’s the result of a precise, multi-step process. In the same way, each component of a BI platform has a specific job in turning raw, messy data into clean, actionable insight.
At its core, a good BI platform changes how teams ask questions, see trends, and make decisions—all without creating a long line of requests for the IT department. It’s no surprise the BI market is booming, with projections showing it will reach $62.38 billion by 2031. Since 2020, a staggering 94% of organizations have come to see BI as essential to their success.
This image lays out the journey from raw information to clear business insights.
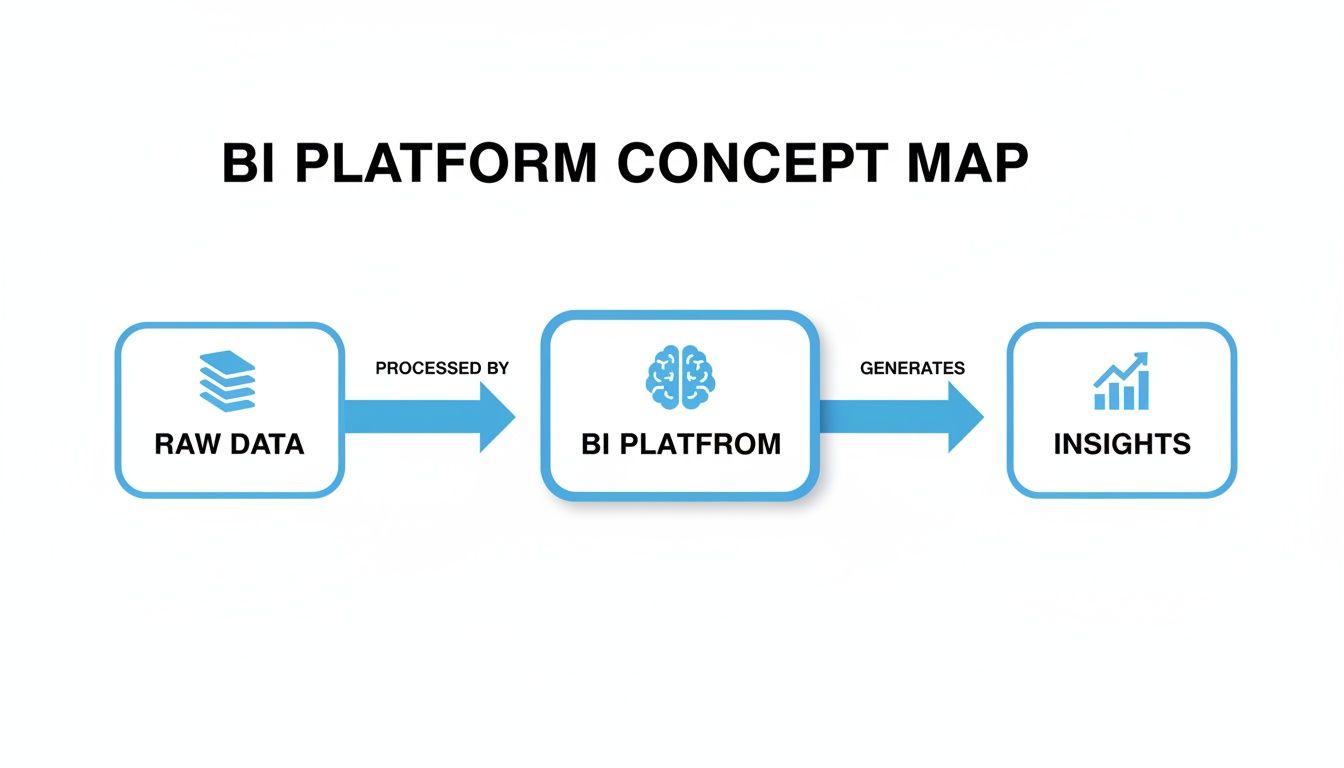
As you can see, the BI platform is the central engine, pulling in data from all over the place to produce intelligence your teams can actually use.
Data Connectors and Integration
First things first, you have to gather your ingredients. This is where data connectors come in. Think of them as bridges that link your BI platform to all the different places your data lives—your CRM, marketing tools, product database, or even simple spreadsheets.
Without these connectors, you’d be stuck manually exporting and importing files. That's not just slow; it’s a recipe for errors. A key part of any BI platform is the efficient and secure acquisition of data, which sets the stage for any meaningful analysis. This layer ensures a constant, reliable flow of information.
The Semantic Layer
Once data is flowing in, the semantic layer acts as the platform's brain. This is, without a doubt, one of the most important parts of a modern BI setup because it translates technical database jargon into plain business terms.
This is where you define what "Monthly Recurring Revenue" or "Active User" actually means for your business. It learns your company's unique logic and applies it consistently every single time. This ensures that when your marketing and sales teams both ask about "new customers," they get the exact same, reliable answer.
The semantic layer is the single source of truth for your metrics. It gets rid of ambiguity and makes sure everyone in the company is speaking the same data language, which builds trust in every number and chart.
This powerful component is what lets non-technical users ask complex questions without needing to know which database table holds which piece of information. For a closer look, you can learn more about how semantic layers provide key benefits in our dedicated guide.
The Query Engine
If the semantic layer is the brain, the query engine is the expert barista. When a user asks a question in plain English, like "What was our customer churn rate last quarter?", the query engine gets to work.
Powered by AI, it translates that simple request into a complex query language (like SQL) that the database can understand. It then efficiently pulls the precise data needed, performing calculations and aggregations on the fly. This all happens in seconds.
This powerful engine means data analysts no longer have to be constant go-betweens, freeing up business users to get their own answers instantly.
The Visualization Layer
Finally, the visualization layer is how the finished product is served up. Let’s be honest, raw numbers and tables are hard for most people to make sense of. A well-designed chart or dashboard, on the other hand, can reveal trends and outliers in an instant.
This final piece takes the answers from the query engine and presents them in a digestible, visual format. And these aren't just static pictures; they are interactive dashboards that let users:
Drill down into specific data points for more detail.
Filter results by date, region, or any other relevant category.
Change chart types to look at the data from different angles.
This layer turns complex analysis into a clear story, making it easy for anyone on the team to understand what the data is telling them and make confident, informed decisions.
The Shift from Traditional to AI-Powered BI
Business intelligence has been around for a while, but the way we approach it has completely changed. The difference between old-school BI and modern, AI-driven platforms is like the difference between thumbing through a dusty card catalog in a library versus asking a search engine a question.
One is static and requires a gatekeeper. The other is dynamic, instant, and puts the power directly in your hands.

This isn't just a tech upgrade. It’s a fundamental change in how companies use data, shifting from rigid, top-down reports to a culture where anyone can be curious and find their own answers.
The Old Way: Traditional BI
Think of traditional BI as that old library. If you needed information, you had to find the librarian—in this case, a data analyst or someone in IT—and file a formal request. They'd head into the archives (the database), pull the right information, and come back with a static report.
The process was slow. It was rigid. And if that report sparked another question? You couldn't just ask it. You had to go back to the librarian and kick off the whole process again, often waiting days, if not weeks, for a simple follow-up.
Traditional BI created a culture of dependency. Business users were just passive consumers of data, and insights were bottlenecked by the handful of people on the data team. By the time a report was delivered, the opportunity had often already passed.
The New Way: AI-Powered BI
Modern, AI-powered BI completely flips that model on its head. Instead of a librarian, you have an expert you can talk to directly. It's a real conversation. You can ask a question in plain English, get an answer instantly, and then immediately ask follow-up questions to dig deeper.
For instance, a marketing manager can just ask, "Show me our top-performing ad campaigns by region last quarter." An interactive chart pops up. They can immediately follow that with, "Okay, now filter that for campaigns with a budget over $10,000," and the view updates on the fly.
This kind of interactive exploration empowers business users to find their own answers. It turns data analysis from a tedious chore into a genuine discovery process. It’s the core difference between legacy systems and modern platforms; you can learn more about how AI-driven analytics is replacing traditional BI in our deep-dive article.
The market is already making this shift. Cloud-based BI, which enables these advanced AI features, is on track to capture over 50% of the market share by 2026. This move is fueled by the 94% of organizations that now see BI as critical to their success, especially when it can compress workflows that once took weeks into a matter of seconds.
As BI platforms continue to weave in more advanced artificial intelligence, technologies like Large Language Models (LLMs) have become the engines driving this change, powering the natural language capabilities that make modern BI so intuitive.
A Head-to-Head Comparison
The differences between these two approaches aren't subtle. To make it perfectly clear, let's put them side-by-side to see how they stack up on the factors that matter most to your teams.
Comparing Traditional BI and Modern AI-Powered BI
Attribute | Traditional BI | Modern AI-Powered BI |
|---|---|---|
User Experience | Requires technical skills (SQL, complex software) | Intuitive, conversational interface (plain English) |
Speed to Insight | Days or weeks | Seconds or minutes |
Accessibility | Limited to data analysts and IT teams | Accessible to everyone in the organization |
Data Exploration | Static, pre-defined reports | Interactive, dynamic, and exploratory |
Flexibility | Rigid; new questions require a new report build | Agile; allows for follow-up questions and drilling down |
Reliance on IT | High dependency on a small, technical team | Low dependency, promotes self-service |
When you boil it all down, the move from traditional to AI-powered BI is about one thing: democratization. It’s about tearing down the walls between people and their data, empowering every single person on your team to make smarter, faster decisions with confidence.
How Different Teams Use a BI Platform to Win

A common misconception is that BI platforms are just for data scientists or analysts. Nothing could be further from the truth. When you get it right, a BI platform becomes a force multiplier across the entire organization, giving every team the data-driven edge they need to excel.
It’s about moving data out of siloed databases and putting it directly into the hands of the people making day-to-day decisions. This simple shift can transform departments from reactive to proactive, empowering them with the clarity to move faster and smarter. Let's look at how this plays out in the real world.
Product Teams Build Better Products
Product managers live and die by user engagement. In the past, they were often flying blind, relying on gut feelings, a handful of customer interviews, or waiting ages for an analyst to pull a report on feature adoption. That painful lag meant missed opportunities and painfully slow iteration cycles.
Before BI: Imagine a product team launches a new feature. To see how it's doing, they file a ticket with the data team. They need to see adoption rates, engagement funnels, and where users are dropping off. That report might take a week to land in their inbox. By then, the team is deep into the next sprint, and the insights are already stale.
After BI: The moment the feature goes live, the product manager opens a real-time dashboard. Better yet, they can ask questions in plain English, like, "Show me the adoption rate of the new checkout flow, segmented by users on our Pro plan vs. our Free plan." They immediately see that Pro users are adopting it at a 3x higher rate.
This instant feedback loop changes everything. Now they can:
Spot friction points in the user journey within hours, not weeks.
Segment user behavior to understand how different customer groups use the product.
Validate hypotheses on the fly, leading to more confident roadmap decisions.
The result? A product that evolves based on what users actually do, not what you think they do. That’s how you boost retention and keep customers happy.
Marketing Teams Maximize ROI
Marketers are constantly juggling campaigns across a dozen different channels, each spitting out a mountain of data. Without a unified BI platform, figuring out the true return on investment (ROI) is a nightmare. It’s a mess of manual spreadsheet work that often leads to shaky conclusions.
A business intelligence platform connects the dots between marketing spend and customer action. It moves teams from guessing which channels work to knowing precisely where every dollar delivers the most value.
Before BI: A marketing manager wants to know which Q2 campaign drove the most sign-ups. To get an answer, she has to pull data from Google Ads, LinkedIn, Mailchimp, and the company CRM. She then spends hours trying to stitch it all together in Excel, de-duplicating contacts and manually attributing conversions. The final report is a static snapshot that’s probably riddled with small errors.
After BI: The marketing team has a single dashboard that automatically pulls data from all their tools. The manager can see a clear, live visualization of campaign performance.
With a few clicks, she discovers something interesting: while Google Ads brought in the most leads, the leads from LinkedIn campaigns resulted in customers with a 25% higher lifetime value. Armed with that insight, she can reallocate her budget to optimize for long-term profit, not just a high volume of low-quality leads. That’s a strategic pivot made possible by accessible, trustworthy data.
Operations Teams Drive Efficiency
The operations team is the central nervous system of the company, responsible for keeping everything running smoothly. They track KPIs for everything from supply chain logistics to customer support ticket times. A BI platform acts as their real-time command center, helping them spot problems before they become catastrophes.
Before BI: The head of operations gets weekly reports from various department leads. By the time he sees a spike in customer support tickets, the problem has already been frustrating customers for days. The team is constantly in firefighting mode because their data is always old news.
After BI: An operations dashboard displays real-time KPIs from across the business. An automated alert pings the team when support tickets from a specific region jump by more than 15% in an hour.
The team can immediately drill down into the data and identify the root cause: a server issue impacting users in that area. They proactively post a status update for customers and loop in engineering to fix the problem. They’ve turned a potential crisis into a well-managed incident, all because they had the right information at the right time.
Choosing the Right Business Intelligence Platform
Picking the right business intelligence platform is a make-or-break decision for your company's growth. The market is enormous—expected to reach $168.06 billion by 2035—which means you're facing a dizzying number of options. It's easy to get bogged down comparing feature lists, but the best tool isn't the one with the most bells and whistles. It's the one that actually solves your team's real-world problems.
To find that perfect fit, you need a solid evaluation plan. This involves asking sharp questions that cut through the marketing fluff and get to what truly matters for your day-to-day operations. A great BI platform should feel less like a clunky piece of software and more like a natural extension of your team’s curiosity.
While industry giants like Microsoft Power BI dominate with over 215,856 installs, the real breakthroughs often come from nimble, modern platforms built for today’s teams. It's true that 53% of BI spending comes from huge enterprises, but startups can punch way above their weight by choosing tools that make data accessible to everyone, not just data scientists. To get started, let’s look at a few key areas to assess.
Can Your Entire Team Actually Use It?
This is, without a doubt, the most critical question. A platform is worthless if only a few data specialists can make it work. The whole point is to empower your business users—the folks in product, marketing, and operations—to get answers on their own, without having to wait in line for the data team.
Think about the user experience from their perspective:
Is it genuinely self-service? Can a marketing manager type a question like, "Which campaigns drove the most signups last quarter in Europe?" in plain English and get an instant, accurate chart?
How steep is the learning curve? Does your team need to block off weeks for training, or can they jump in and start finding insights on day one?
Does it require coding? You want a platform that removes the need for SQL for everyday analysis. This frees up your engineers and analysts to focus on much bigger, more strategic challenges.
How Smart Is the AI Engine?
Let's be honest, "AI-powered" is slapped on everything these days. But not all AI is created equal. Some platforms just bolt on a simple chatbot that gets confused by anything more complex than a basic keyword search. A truly intelligent BI platform has an AI that deeply understands the context of your business. For a full breakdown, check out our guide on how to evaluate AI-native vs. AI-enhanced BI platforms.
A powerful AI does more than just translate English to SQL. It understands your business logic, learns your key metrics, and even suggests follow-up questions, turning a simple query into a real journey of discovery.
Does It Fit Your Existing Tech Stack?
A BI platform should make your life simpler, not add another layer of complexity. Seamless integration with the tools you already use is non-negotiable. Before you sign anything, make sure the platform has reliable, pre-built connectors for your core systems—your CRM, product database, marketing automation software, and anything else you rely on.
This is the only way to ensure your data is always fresh, accurate, and consolidated. It creates a single source of truth that everyone in the company can trust.
Is It Secure and Built to Scale?
For any founder or product leader, security and scalability are always top of mind. As your company grows, so will your data volume and user base. You need a platform that can handle that growth without faltering on performance or security.
Here’s a quick video that explains why this matters for SaaS companies:
Drill down on the security details with any potential vendor:
Data Governance: Can you set up granular, row-level security to control exactly who sees what?
Compliance: Is it SOC 2 Type II certified or compliant with other key industry standards like GDPR or HIPAA?
Deployment: Does it support a multi-tenant architecture? This is crucial if you plan to offer secure, customer-facing analytics.
Finally, think about the future. Can you embed analytics directly into your own product? For many software companies, this is a game-changer. It allows you to deliver powerful insights to your customers as a built-in feature, creating a stickier, more valuable product.
Common Questions About BI Platforms
As you get closer to picking a BI platform, the practical questions start bubbling up. These are the details that separate a tool that gets used daily from one that just collects digital dust. Let's tackle some of the most common questions we hear from founders, product leaders, and data teams.
How Long Does It Take to Implement a BI Platform?
This really comes down to whether you're looking at an old-school system or a modern, cloud-based platform. Traditional, on-premise BI tools were famous for their marathon implementation cycles, often dragging on for six months to a year. That process was a heavy lift, involving hardware setup, complicated software installation, and a small army of IT staff and consultants.
Thankfully, modern BI platforms have completely flipped the script. Since they live in the cloud, you can often get up and running in a few hours or days, not months. The whole process is much simpler:
Sign up for an account.
Use pre-built connectors to plug into your data sources.
Let the platform do the heavy lifting of syncing and modeling your data.
This means your team can go from making a decision to actually getting value from the tool almost immediately.
Do I Need a Data Engineer to Use It?
With the old guard of BI, the answer was a resounding yes. Business users were completely reliant on data engineers or analysts to write complex SQL, build every report, and tweak any little thing. This created a massive bottleneck that slowed down the entire company.
Modern, AI-powered platforms are built to smash that bottleneck. Their entire reason for being is self-service analytics, giving non-technical users the power to dig into data themselves. A marketing manager can just ask a question in plain English—"What were our top 5 acquisition channels last quarter?"—and get an answer instantly.
This frees up your highly skilled data pros to focus on the big stuff, like building a rock-solid data infrastructure or developing predictive models, instead of being stuck in an endless queue of report requests.
A key goal of any modern business intelligence platform is to make data exploration as easy as having a conversation. It democratizes access to insights, moving your company from a culture of data dependency to one of data curiosity.
How Is an AI-Powered BI Platform Different From ChatGPT?
This is a fantastic and important question. While both use AI to understand natural language, they operate in completely different worlds. Think of it this way: a general-purpose AI like ChatGPT is trained on the vast, messy, public internet. It's incredibly knowledgeable, but it doesn't know your business and can sometimes "hallucinate," giving you a very confident but wrong answer.
An AI-powered BI platform is fundamentally different:
It’s Grounded in Your Data: It connects directly to your company's verified, internal databases—your single source of truth. Its world is your world.
It Understands Your Business Logic: It learns what you mean by "active user," "churn rate," or "net revenue" through a semantic layer. It speaks your company's language.
It Provides Verifiable Answers: Every chart or number it produces can be traced directly back to the source data, giving you a clear audit trail and building trust.
In short, a BI platform gives you reliable answers based on your reality, not just general knowledge scraped from the web.
Can I Embed Analytics Into My Own Application?
Absolutely. For software companies, this is one of the most powerful features out there. Embedded analytics lets you take the dashboards, charts, and even the natural language query box from your BI platform and place them directly into your own product for your customers.
Instead of forcing customers to export a CSV and figure things out on their own, you bring the insights to them, right where they work. This makes your product incredibly sticky and adds a ton of value. Modern BI platforms provide secure, white-label components that you can style to look and feel just like your own brand. It's a true game-changer for boosting user engagement and building a competitive moat.
Ready to empower every team with instant, reliable answers from your data? With Querio, you can eliminate reporting bottlenecks and give everyone the power of self-serve analytics. Learn how Querio's AI agents turn curiosity into confident decisions.

