Guide
Analytics for Enterprise Explained for Growth Teams
Learn what analytics for enterprise really means, from warehouse architecture to self-service AI. Build scalable, governed analytics that drives ROI.
The request arrives in Slack at 4:47 p.m. A growth lead needs an answer before tomorrow's planning meeting. Finance already has a dashboard showing one revenue figure, product has another, and the data team knows both definitions are slightly wrong. Someone opens a notebook, someone else checks the warehouse, and the decision waits.
That experience is common as a company moves from startup speed to mid-market complexity. More systems create more data, but they also create more opportunities for duplicated logic, unclear ownership, and AI-generated answers nobody can verify. Analytics for enterprise succeeds when it becomes a trusted operating layer for decisions, not merely a larger collection of charts.
Table of Contents
- Why Enterprise Analytics Feels Broken Right Now
- What Analytics for Enterprise Actually Means
- Inside the Modern Enterprise Analytics Stack
- Legacy BI Versus Modern Self Service on the Warehouse
- How Governance and Semantic Layers Keep Self Service Trustworthy
- Your Implementation Roadmap From Pilot to Scale
- Measuring ROI and Real World Use Cases That Prove Value
Why Enterprise Analytics Feels Broken Right Now
A small data team can often survive on personal knowledge. One analyst knows which events are reliable, which revenue table finance trusts, and which dashboard contains the latest retention definition. That arrangement works until the same analyst becomes the human API for every product question, board request, forecast, and customer report.
The queue grows in predictable ways. A product manager asks for activation by cohort. Marketing wants campaign performance by account segment. Finance wants a reconciled KPI export. Executives ask why the number changed since yesterday. Each request looks reasonable in isolation, but together they expose a missing system for turning warehouse data into shared decisions.

Enterprise grade means dependable access
Team-level BI usually answers a bounded set of questions for a known group. Enterprise analytics has a broader responsibility. It must support different departments, different levels of technical ability, permission boundaries, recurring reporting, exploration, and increasingly, natural-language interaction with live data.
That doesn't mean every employee needs unrestricted access to every table. It means the organization needs a repeatable path from a business question to an answer that is consistent, traceable, and useful. The warehouse provides the durable foundation, while models, metrics, permissions, and interfaces determine whether people can use it safely.
A closer look at the hidden costs of traditional BI platforms helps explain why adding another dashboard tool rarely resolves the underlying bottleneck. If logic remains scattered across reports and specialist workflows, more interfaces can increase demand on the same small data team.
Why the shift is accelerating
Enterprise analytics has a long history, from computerized reporting in the mainframe era to formal BI and OLAP concepts in the 1990s. Yet broad infrastructure adoption hasn't guaranteed broad employee usage. One industry history reports that only 25% of employees on average actively used BI and analytics tools, with minimal growth over seven years, while 50% of data and analytics leaders said usage had increased a lot; the same source reports that 42% of organizations were moving from cloud data warehouses to lakehouses in a recent survey (Mondo Analytics' history of business intelligence).
That gap explains the current pressure. Leaders want self-service and AI, but access without shared definitions creates conflicting answers faster. The practical question isn't how to produce more dashboards. It's how to build an operating system where more people can ask questions without making the data less trustworthy.
What Analytics for Enterprise Actually Means
Start with a simple distinction. A report displays a prepared answer. An analytics system helps people move from a question to a decision, using connected data, shared logic, and controls that remain dependable as more teams participate.
Think of the system as an organization's nervous system. Business applications generate signals. Pipelines carry those signals into storage. Transformation models clean and organize them. A semantic layer gives the signals meaning. Interfaces then deliver information to analysts, operators, executives, applications, or AI agents.
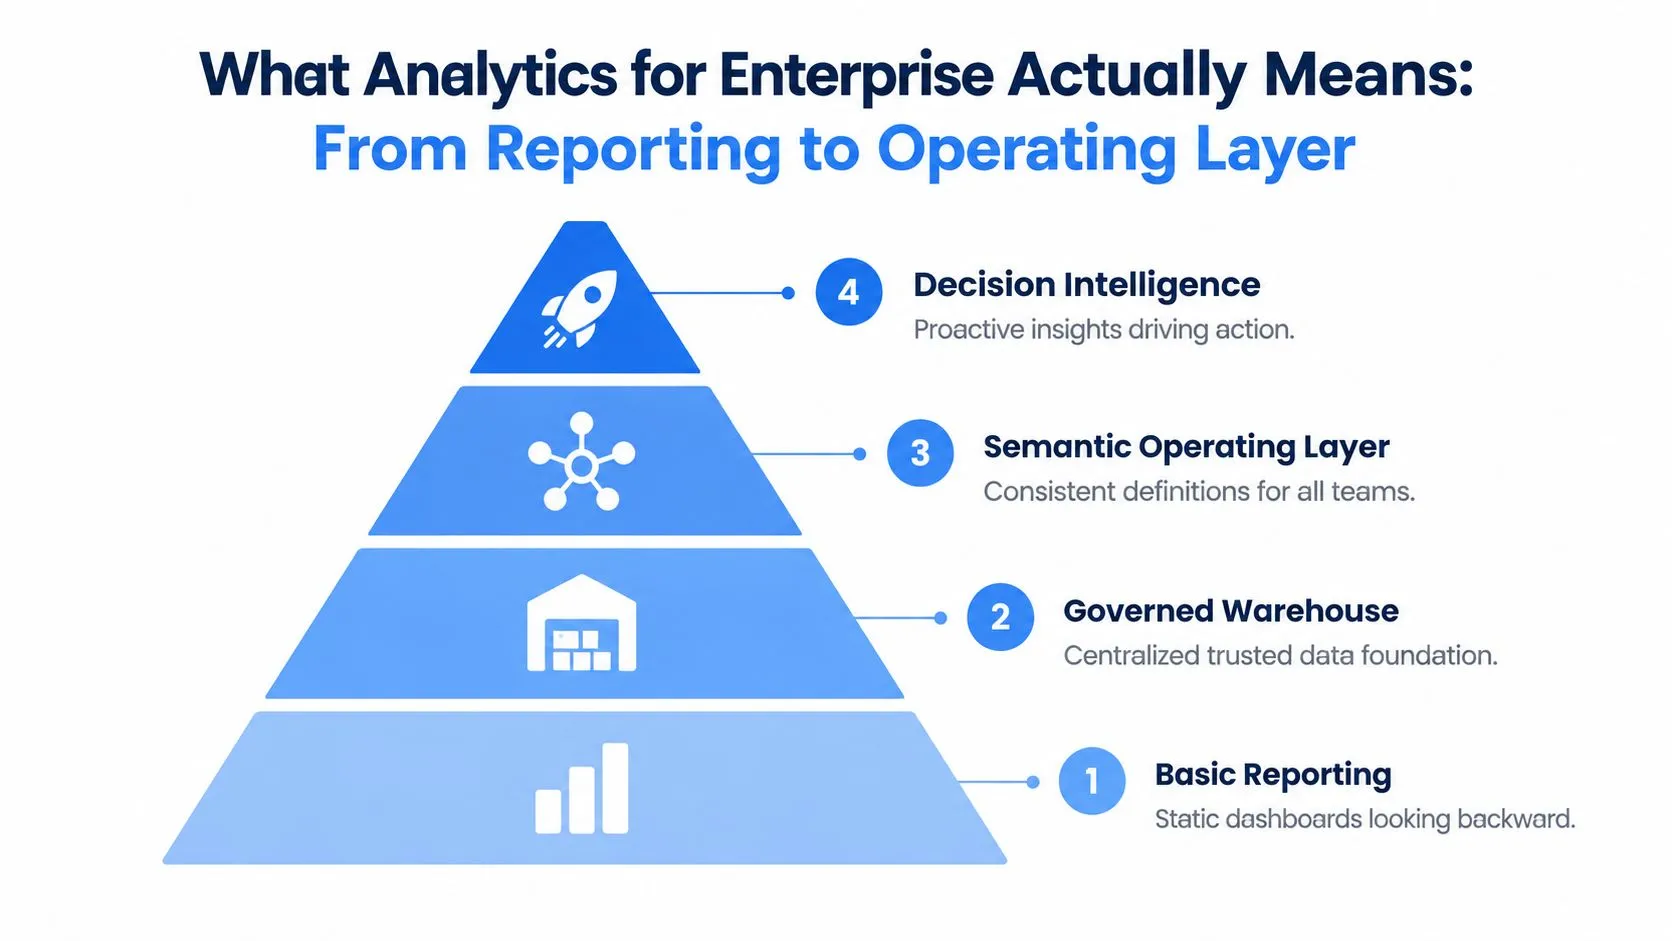
Four layers of maturity
Basic reporting looks backward. It answers questions such as what happened to orders, sign-ups, or usage during a selected period. Static dashboards can be valuable, but they depend on someone having already anticipated the question.
A governed warehouse creates a centralized foundation. It brings together structured business data so teams can reconcile KPIs, apply access rules, and run repeatable queries. This approach makes analytics infrastructure rather than a presentation layer.
A semantic operating layer defines business meaning. It establishes what terms such as active customer, qualified opportunity, expansion, or churn mean, and makes those definitions reusable across reports, notebooks, applications, and AI interactions.
Decision intelligence connects evidence to action. A leader can investigate a change, a product team can explore behavior, and a customer-facing application can present relevant metrics without every request becoming a bespoke analyst project.
Core definition: Enterprise analytics is the warehouse-centered system that connects governed data, business meaning, and decision workflows across an organization.
The warehouse-centered point matters because durability beats dashboard count. If five reports calculate the same KPI five different ways, the organization doesn't have five views of one truth. It has five competing business rules.
Internal and external use
Internal users need analytics for planning, operating reviews, forecasting, and investigation. External users may need usage summaries, financial reporting, benchmarks, or performance views inside a product. Both experiences depend on the same foundations: reliable source data, defined metrics, appropriate permissions, and a way to trace the result back to its origin.
An enterprise analytics program therefore serves more than executives. It gives data engineers a place to maintain trusted models, analysts a reusable vocabulary, product teams a dependable source for embedded experiences, and business users a faster route to answers. The interface may change, but the operating layer should remain coherent.
Inside the Modern Enterprise Analytics Stack
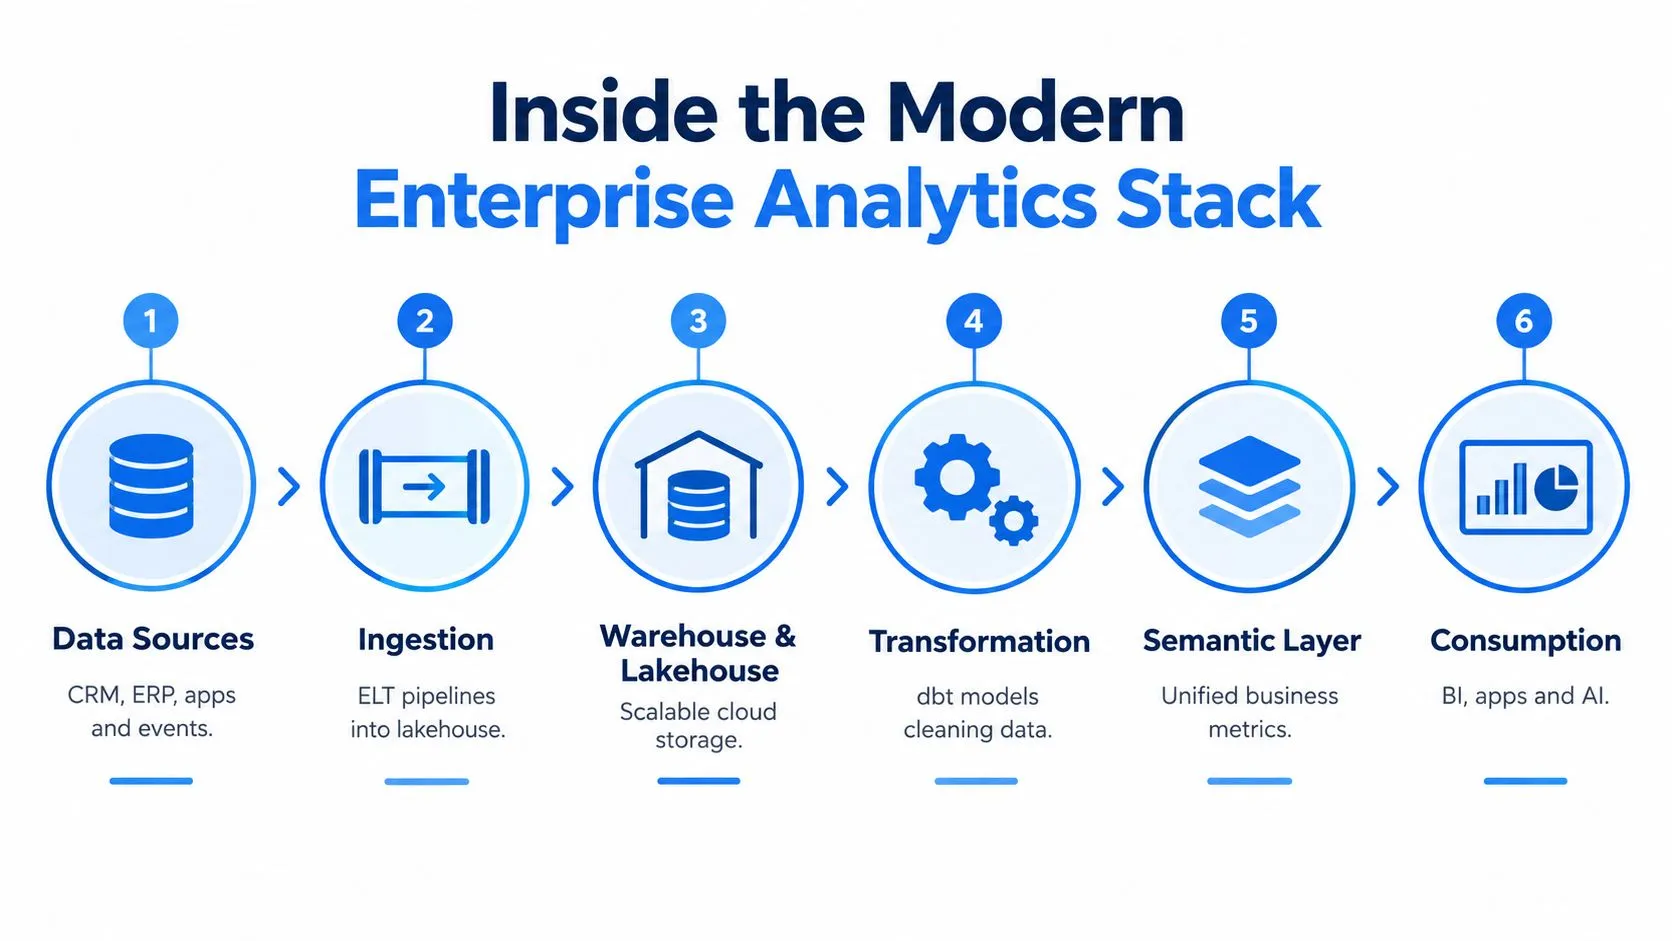
A modern stack is easier to understand as a chain of responsibility. Each layer should make the next layer more reliable. If one layer pushes unresolved ambiguity downstream, the final dashboard or AI answer inherits the problem.
From operational systems to usable data
Data sources include CRM records, ERP transactions, application databases, event streams, billing systems, and support platforms. These systems are optimized for running the business, not for answering cross-functional questions. A customer's account status may live in one system, product activity in another, and payment history somewhere else.
Ingestion moves those records into analytical storage. ELT patterns commonly load data first and transform it afterward, which gives teams a flexible way to preserve source detail while building reusable models. The important question isn't whether a pipeline is labeled ETL or ELT. It's whether failures, freshness, schema changes, and ownership are visible.
The warehouse or lakehouse provides scalable analytical storage and query access. Enterprise analytics has remained strongly warehouse-centered. A BARC study found that 79% of analytics environments include a data warehouse, compared with 42% using a data lake and 41% using independent data marts (BARC's data warehouse and data vault adoption infographic).
That pattern doesn't make lakehouses irrelevant. It explains why many organizations extend an established warehouse foundation with lakehouse capabilities rather than discard the architecture that already supports governed reporting and KPI management.
Modeling, meaning, and consumption
Transformation turns raw records into usable entities and facts. Tools such as dbt can help teams express cleaning, joins, tests, and business logic as maintained models rather than hidden calculations inside individual dashboards.
The semantic layer sits above those models and standardizes meaning. It should make a metric reusable, document its grain and filters, and expose its lineage. Without that layer, every consumer has to interpret the warehouse independently.
Consumption includes traditional BI, spreadsheets, Python notebooks, internal applications, customer-facing analytics, and AI agents. Looker, Hex, ThoughtSpot, notebooks, and warehouse-native workspaces can all serve different users. The architecture decision is whether they draw from shared governed logic or create parallel definitions.
AI coding agents and Python notebooks fit best where exploration, custom analysis, or repeatable workflows need more flexibility than a dashboard offers. Traditional BI remains useful for certified recurring reporting. The strongest design assigns each interface a role while keeping the warehouse and semantic models central.
This guide to the modern analytics stack provides a practical companion for evaluating those layers.
The stack is only as strong as its weakest handoff. A fast interface can't repair missing identifiers. A polished model can't resolve an undefined metric. An AI assistant can't reliably answer a business question if the underlying schema and vocabulary remain ambiguous.
Legacy BI Versus Modern Self Service on the Warehouse
The choice isn't between an old interface and a new interface. It concerns where analytical logic lives, who can change it, and how much specialist mediation each question requires.
Legacy BI platforms such as Looker, Hex, and ThoughtSpot can provide structured exploration, governed dashboards, and familiar reporting workflows. They may also concentrate logic in tool-specific models or require a specialist to translate new questions into approved content.
A warehouse-centric approach keeps more logic close to the data foundation and gives users additional ways to work, including SQL, Python notebooks, natural-language queries, and reusable analytical files. Querio is one example of a workspace that connects plain-English questions with generated SQL and Python on connected warehouse or database data.
| Dimension | Legacy BI | Modern Warehouse-Centric |
|---|---|---|
| Workflow ownership | Analysts or BI developers often own model changes, dashboard logic, and publishing. | Data teams maintain shared warehouse and semantic foundations while more users can explore within governed boundaries. |
| Speed to answer | Fast for questions already represented in certified reports. New questions may enter an analyst queue. | Faster for exploratory questions when users can query live warehouse data and reuse existing logic. |
| Technical flexibility | Strong for standardized dashboards and defined exploration paths. | Better suited to SQL, Python, notebooks, custom analysis, and mixed workflows. |
| Non-technical access | Familiar visual interfaces can lower the initial barrier, but ambiguous questions still need translation. | Natural-language interfaces can help users begin, provided metric definitions and permissions are governed. |
| Logic location | Logic may sit across BI models, calculated fields, extracts, and individual reports. | Logic is pushed toward warehouse models and shared semantic definitions. |
| Maintenance burden | Dashboard sprawl and duplicated calculations can make changes difficult to coordinate. | Central models reduce duplication, but the data team must invest in modeling, documentation, tests, and access policies. |
| Best fit | Certified recurring reporting with stable requirements and a clearly staffed BI function. | Organizations that need flexible investigation, broader access, and a common foundation for BI, notebooks, applications, and AI. |
The human API trap
A team can call a platform self-service while still routing every meaningful question through one analyst. The interface lets users click around, but the organization hasn't transferred ownership of interpretation. People still ask, “Which dashboard should I trust?” or “Can you confirm whether this filter matches finance?”
Moving logic into the warehouse helps, but it isn't sufficient by itself. A poorly modeled warehouse spreads confusion more efficiently. The improvement comes from combining centralized definitions with interfaces that let technical and non-technical users work from the same foundation.
A detailed comparison of data warehouses and business intelligence tools can help teams separate storage, modeling, and consumption decisions before selecting a platform.
How Governance and Semantic Layers Keep Self Service Trustworthy
Self-service becomes dangerous when access expands faster than shared meaning. One team builds a metric in a spreadsheet, another encodes it in a dashboard, and a third asks an AI tool to infer it from raw columns. Each answer may look plausible. The organization then spends more time reconciling outputs than using them.
Governance should prevent that outcome without turning every request into a review board. A study of enterprise analytics performance found that governance framework scalability was the strongest predictor, with β = 0.41, p < 0.001, ahead of cloud readiness at β = 0.34, p < 0.001 and policy integration strength at β = 0.29, p < 0.001 (the JISEM governance study).
Governance as a workflow
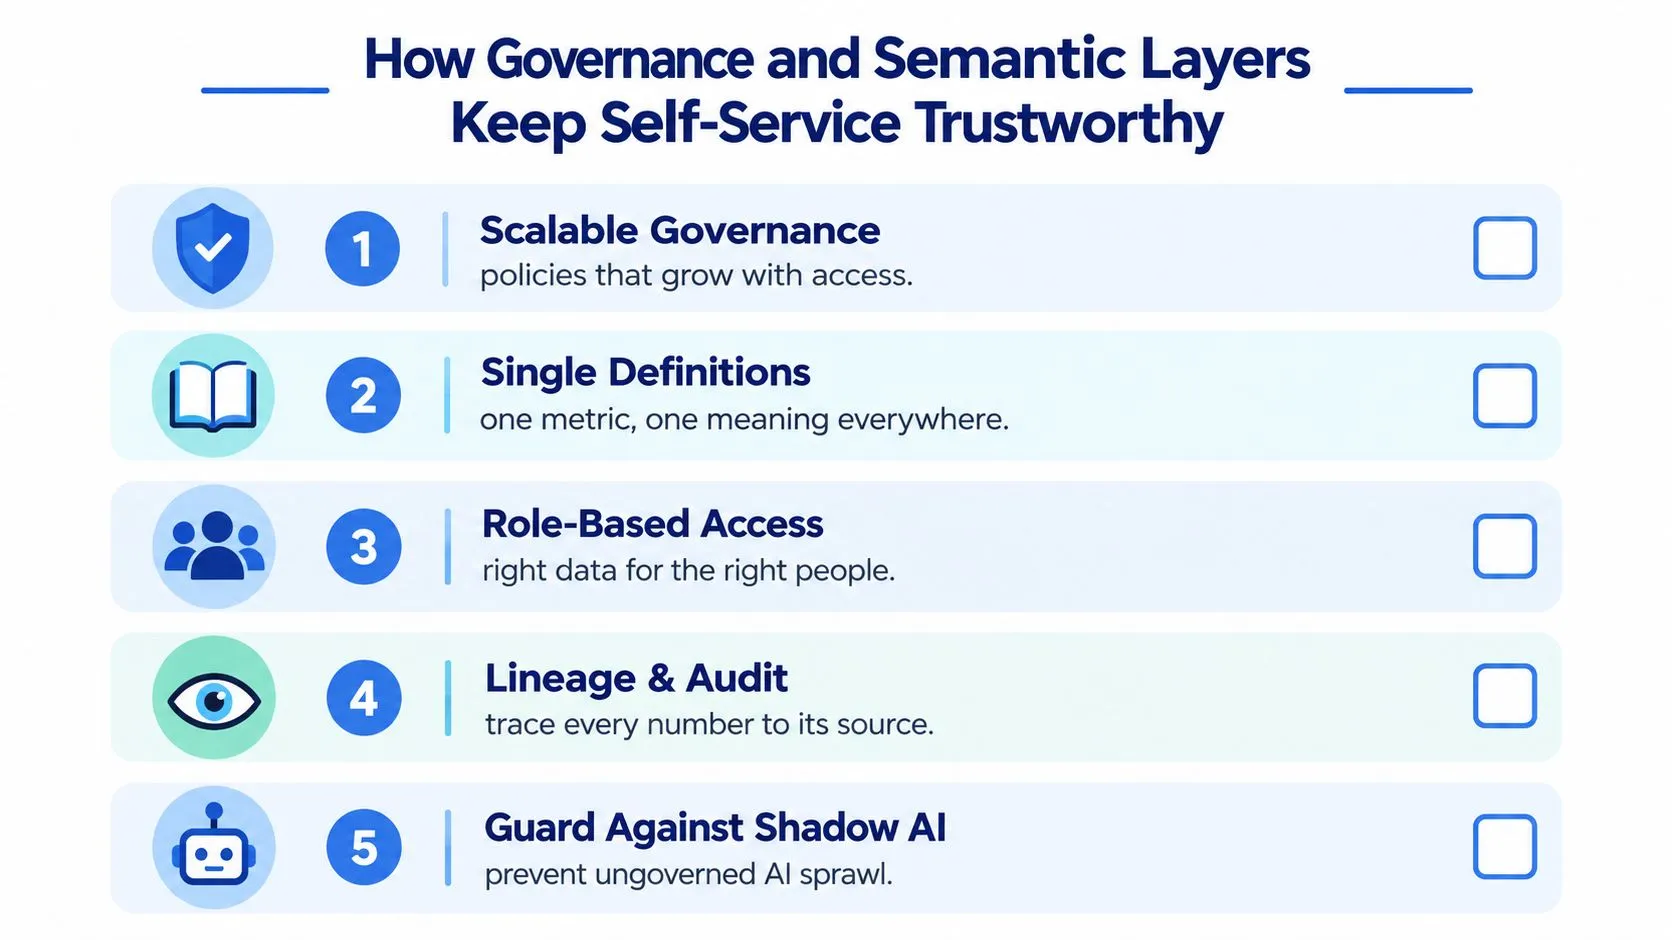
Scalable governance is not a locked cabinet around data. It is a set of rules embedded in normal work:
- Define ownership: Assign a business and technical owner to important datasets and metrics.
- Publish certified meanings: Document the metric name, grain, filters, exclusions, refresh expectations, and intended use.
- Apply role-based access: Give teams access to the information needed for their work without exposing restricted records.
- Record lineage: Let users trace an answer from its presentation back through the model to the source.
- Monitor changes: Review model, schema, permission, and definition changes as part of routine development.
The semantic layer makes these controls useful to people. It converts a business definition into governed metric logic that can be reused across dashboards, notebooks, applications, and text-to-SQL systems.
Why semantics matter to AI
Raw-schema querying asks a system to infer business meaning from table names, column names, relationships, and sample values. That inference can fail when “customer,” “account,” “active,” or “revenue” has a specialized meaning inside the company.
A 2026 benchmark on a real insurance dataset reported that adding a semantic layer raised Claude Sonnet 4.6 text-to-SQL accuracy from 90.0% to 98.2%, while GPT-5.3-Codex rose from 84.1% to 100% (the semantic-layer text-to-SQL benchmark). Those results don't mean every enterprise will see the same performance. They demonstrate why explicit business logic gives AI less room to guess.
Practical rule: Govern the meaning before you automate the answer.
The risk is no longer limited to dashboard duplication. Coverage of self-service analytics identifies inaccurate or inconsistent AI-generated answers as a leading technical concern, compliance as the top adoption challenge, and shadow AI as a source of additional duplication and conflicting results (the enterprise analytics survey coverage). A safe rollout therefore treats AI access as another governed consumption layer, not an exception to the data platform.
You can find a practical explanation of why semantic layers matter for AI analytics before designing a natural-language interface.
Your Implementation Roadmap From Pilot to Scale
A successful rollout depends more on sequencing than on buying every capability at once. Start with the foundation that makes later access safe, then expand only after each stage produces evidence.
Establish readiness
Data engineering should inventory the warehouse, identify critical sources, document freshness expectations, and test the joins that underpin the first use case. Analytics leadership should select a small set of business metrics and resolve disagreements before building interfaces. The gate is simple: can the team explain where each pilot number comes from and who owns its definition?
Choose one decision workflow
Pick a recurring question with visible business value and manageable scope. Growth teams might need a consistent acquisition-to-activation view. Product leaders might need a shared engagement investigation. Finance might need reconciled management reporting. Avoid a vague “make data self-service” project. Define the users, questions, data sources, permissions, and action that should follow an answer.
Enable controlled self-service
The data team publishes certified models and metrics. Analysts test representative questions, including ambiguous ones, while security validates access behavior. Business users then try the workflow without analyst intervention. The gate is not raw query volume. It is whether users can reach useful, explainable answers without creating parallel definitions.
Expand with evidence
Once the pilot is stable, add adjacent teams and use cases. Product can work with engineering to expose approved metrics in customer-facing experiences. Data leadership should review lineage, failed queries, definition requests, and recurring support needs. Expansion should follow demonstrated trust, not a promise that a larger user count will automatically create value.
Measuring ROI and Real World Use Cases That Prove Value
Dashboard views are easy to count and weak as a business case. A better measurement system connects adoption to the speed, quality, and consequences of decisions.
Track time to insight for representative questions. Compare the time required to answer a recurring planning or product question before and after the new workflow. Measure how often users resolve questions independently, but pair that indicator with review quality, definition reuse, and the rate of corrections required after publication.
The adoption gap deserves attention. One recent survey reports that only 8% of employees in most firms currently use advanced analytics tools, while 24% of organizations plan to triple that figure within 12 months (the enterprise analytics survey). That planned expansion makes trust a financial issue as well as a governance issue. More access can reduce analyst bottlenecks, but only if the organization prevents conflicting logic and low-confidence outputs from spreading.
Match use cases to decision owners
Founders and executives need a consistent operating view of growth, revenue, retention, and cash-related indicators. The value comes from reducing time spent reconciling numbers before a decision, not from adding another executive dashboard.
Product leaders can investigate activation, engagement, feature adoption, and cohort behavior. A useful workflow lets them move from “what changed” to possible drivers without waiting for a separate analysis request for every follow-up.
Heads of data and analysts can standardize recurring reporting, publish reusable metrics, and reserve specialist time for complex investigations. Their success metric should include the reliability of the shared foundation, not only the number of reports delivered.
Product teams can also use governed warehouse data in customer-facing analytics. That requires careful access controls and a clear distinction between internal exploratory metrics and promises made directly to customers.
A strong ROI narrative combines leading indicators, such as faster answers and successful self-service workflows, with lagging outcomes, such as better prioritization, fewer reconciliation cycles, or more useful customer experiences. Define the baseline before the pilot, agree on the decision it should improve, and review evidence with the people who use the result.
Querio provides an analytics workspace where data agents can analyze connected warehouse and database data, generate SQL and Python, and support shared metrics and dashboards. If your team needs to move from analyst queues toward governed self-service, visit Querio to explore how the approach fits your enterprise analytics foundation.