Business Intelligence
Tableau Pricing in 2026: Seats, Add-Ons and AI Extras
Breaks down 2026 Tableau seat prices, edition tiers, AI add-ons, and real cost drivers for accurate budgeting.

Tableau in 2026 starts at $15 per user per month and goes up to $115 per user per month for list-price seats billed annually. But that headline number only tells part of the story.
If I were budgeting Tableau today, I’d focus on three things first:
- Seat role: Creator, Explorer, or Viewer
- Edition: Standard, Enterprise, Cloud+, or Tableau+
- AI and data extras: Pulse, Tableau Agent, Agentforce, and Data Cloud usage
Here’s the short version:
- Creators cost $75 to $115/user/month
- Explorers cost $42 to $70/user/month
- Viewers cost $15 to $35/user/month
- Standard is the low-cost entry point
- Enterprise adds lineage, catalog, and admin controls
- Cloud+ and Tableau+ move pricing into custom quote territory
- AI can add a lot to total spend, especially if you also need Salesforce Data Cloud credits
In other words: most teams don’t overspend because of Tableau alone. They overspend because of the wrong seat mix, a higher edition than expected, and extra warehouse or AI usage.
How Much Does Tableau Cost
::: @iframe https://www.youtube.com/embed/VMobwXw-Mi4 :::
Quick Comparison
| Item | What changes the cost |
|---|---|
| Seat roles | Creators cost the most, Viewers the least |
| Standard vs. Enterprise | Enterprise adds governance features and a higher seat price |
| Cloud+ / Tableau+ | Custom pricing instead of public seat rates |
| AI features | Basic AI features are included more often; premium AI is tied to higher packaging or add-ons |
| Non-Tableau costs | Snowflake, BigQuery, Redshift, admin work, and support time |
A simple way to think about it: pick the right seats first, then check whether governance and AI force you into a higher tier. That’s the fastest way to get a budget that’s close to your actual 2026 Tableau bill. You can also compare Tableau with other AI analytics tools to see how its pricing and features stack up against the competition.
Tableau Seat Pricing by Role
While you compare Tableau and Querio, note that Tableau licenses revolve around three roles: Creator, Explorer, and Viewer. In practice, your seat mix drives most of the total cost.[1]
Creator, Explorer, and Viewer: What Each Role Does
Creators get full authoring. That includes Tableau Desktop, Tableau Prep Builder, the ability to connect to data sources, and the ability to publish content.[1] You need at least one Creator to build and publish content. This seat makes sense for analytics engineers and BI developers who build the trusted assets other teams use.
Explorers work in the browser. They can edit published content and analyze governed data there, but they can't create new data sources or use Desktop or Prep.[1] This role is a good fit for product managers, operations leads, and business analysts who need more than read-only access without full authoring tools.
Viewers are read-only. They can filter and drill into published dashboards, but they can't edit or create anything.[1] Use Viewers when lots of people just need to consume dashboards across the company.
2026 U.S. List Prices for Standard and Enterprise
The table below shows 2026 U.S. list prices for each role under Standard and Enterprise. All prices are billed annually in USD.[1]
| Role | Standard (per user/mo) | Enterprise (per user/mo) | Annualized - Standard | Annualized - Enterprise |
|---|---|---|---|---|
| Creator | $75 | $115 | $900 | $1,380 |
| Explorer | $42 | $70 | $504 | $840 |
| Viewer | $15 | $35 | $180 | $420 |
How to Pick the Right Seat Mix
Once the roles are clear, the budgeting question gets simple: how many people need each one? Give Explorers to weekly power users, reserve Creators for builders, and use Viewers for people who only need to read dashboards.[1]
A common mistake is paying for Creator seats for executives who only check dashboards. Another is putting business users into Viewer seats when they need light editing, which creates a bottleneck around a small group of authors. It's smart to leave room for Explorer growth because browser editing is easy to miss in early planning.[1]
Seat mix sets the baseline; the next step is choosing the edition that adds governance and AI.
Standard, Enterprise, Cloud+, and Tableau+
::: @figure 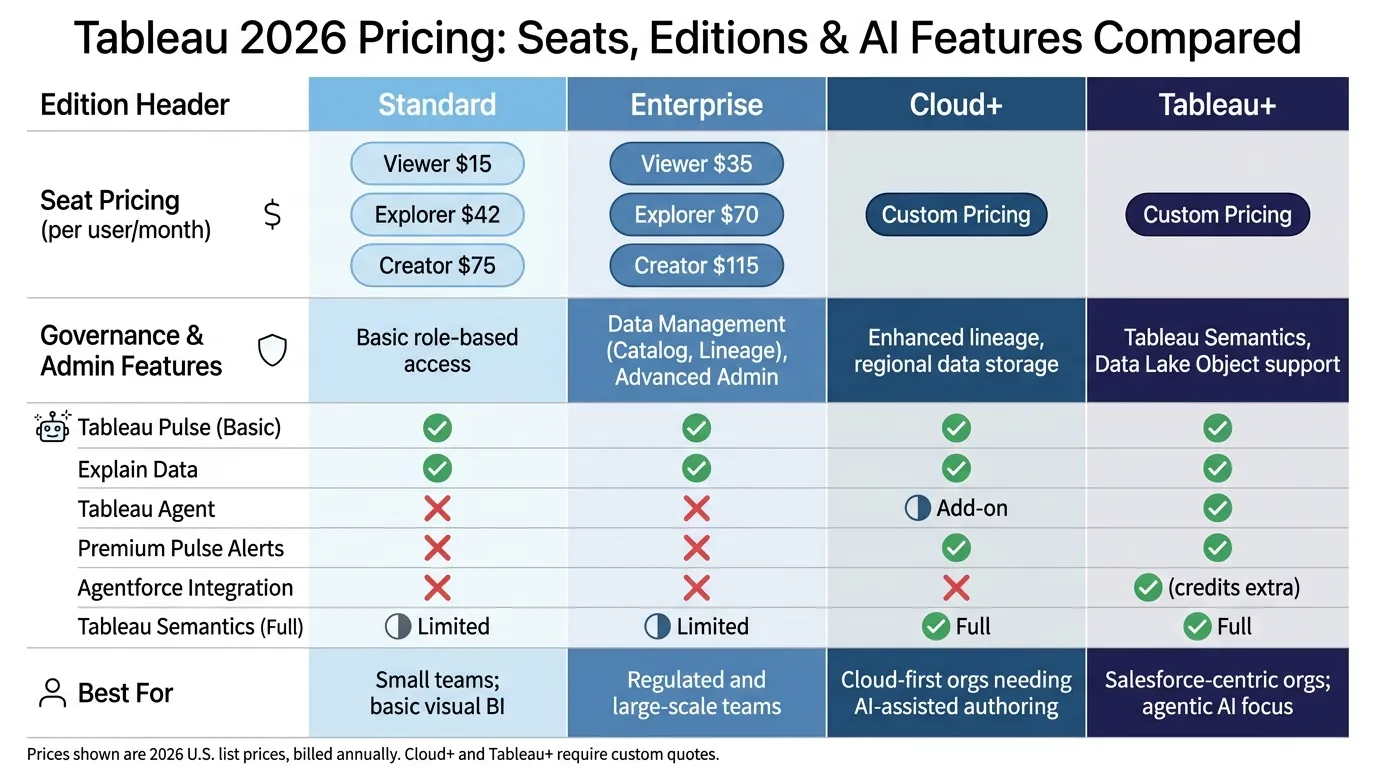 {Tableau 2026 Pricing: Seats, Editions & AI Features Compared}
:::
{Tableau 2026 Pricing: Seats, Editions & AI Features Compared}
:::
Seat prices give you the starting point. But the edition you choose decides what’s included and when pricing shifts into custom-quote territory.
What Standard and Enterprise Include
Standard is the base edition. It covers visual analytics with basic Tableau Pulse and Ask Data.
Enterprise is usually the better pick for regulated and larger organizations. It adds Data Management, including Catalog and Lineage, plus Advanced Admin. If your warehouse stack runs on Snowflake, BigQuery, Redshift, or Postgres with dbt, Enterprise is often the minimum tier for lineage and auditability.
Once you pick the edition, the next big budget shift usually comes from AI extras and bundled add-ons.
How Cloud+ and Tableau+ Change the Bill
Cloud+ and Tableau+ use custom pricing.
Cloud+ is aimed at cloud-first organizations that want AI-assisted authoring and stronger lineage, along with regional data storage. Those features are often what push teams up from Enterprise.
Tableau+ adds Tableau Semantics, Data Lake Object support, and stronger AI features. It fits teams that want deeper, agentic analytics inside the Salesforce ecosystem.
From there, add-ons and AI features are usually what move the final budget.
Edition Comparison Table
Here’s the fastest way to compare the editions side by side or compare BI tools to see how Tableau stacks up against alternatives.
| Edition | Seat pricing model | Governance & admin features | Included AI features | Typical fit |
|---|---|---|---|---|
| Standard | Viewer $15 / Explorer $42 / Creator $75 | Basic role-based access | Basic Pulse, Ask Data | Small teams; basic visual BI |
| Enterprise | Viewer $35 / Explorer $70 / Creator $115 | Data Management (Catalog, Lineage), Advanced Admin | Pulse metric digests | Regulated and large-scale teams |
| Cloud+ | Custom pricing | Enhanced lineage, regional data storage | Tableau Agent for authoring and guided analysis , similar to how modern AI generates dashboards automatically from warehouse data | Cloud-first orgs needing AI-assisted authoring |
| Tableau+ | Custom pricing | Tableau Semantics, Data Lake Object support | Enhanced AI and agentic capabilities | Salesforce-centric orgs; agentic AI focus |
The next cost jump usually comes from add-ons and AI extras, which can push spend past the seat and edition baseline.
Add-Ons, AI Extras, and the Real Cost Drivers
After you lock in seat counts and pick an edition, the next issue is everything that gets tacked onto the invoice. In practice, the biggest budget surprises usually come from bundled features and warehouse usage, not just seat licenses.
Which Add-Ons Are Now Bundled Into Higher Editions
Data Management and Advanced Management are now usually bundled into Enterprise. So if your team needs catalog and lineage, you’ll often move up to a higher edition instead of buying those items on their own.
Included AI Features vs Premium AI Features
Basic Pulse and Explain Data are included. The bigger cost jumps tend to come from Tableau Agent, premium Pulse alerts, and Agentforce integration, either through higher-tier packaging or extra add-ons.
| AI Feature | Standard / Enterprise | Cloud+ | Tableau+ |
|---|---|---|---|
| Tableau Pulse (Basic) | Included | Included | Included |
| Explain Data | Included | Included | Included |
| Tableau Agent | Not included | Add-on | Included |
| Premium Pulse (Alerts) | Not included | Included | Included |
| Agentforce Integration | Not included | Not included | Included (credits extra) |
| Tableau Semantics (Full) | Limited | Full | Full |
Full Tableau Next AI also requires Salesforce Data Cloud, which brings its own credit and usage costs.
Costs Tableau Does Not Include
The seat license is just one part of total spend. Even when licensing is settled, usage can still push the budget up.
For example, live queries against Snowflake, BigQuery, or Redshift bill compute to the warehouse provider, not Tableau.
There’s also the internal work that doesn’t show up as a line item from Tableau but still costs money: admin time, refresh management, content reviews, performance tuning, and data modeling. As usage grows, those costs tend to stack up fast.
Budget Examples and Final Takeaways
Hypothetical Team Cost Examples
Once you’ve set the seat mix and edition, you can get a much clearer sense of how Tableau spend grows.
These hypothetical U.S. mid-market estimates use 2026 list prices and show how changes in seat mix affect total spend.[1]
| Team Type | Users | Seat Mix (Creator/Explorer/Viewer) | Edition | Estimated annual license cost | Next cost trigger |
|---|---|---|---|---|---|
| Lean SaaS Team | 25 | 5 / 10 / 10 | Standard | ~$11,340 | Governance requirements |
| Governed Finance | 100 | 10 / 30 / 60 | Enterprise | ~$64,200 | AI adoption increases spend |
| AI-first Rollout | 250 | 30 / 70 / 150 | Tableau+ | ~$180,000+ | Data Cloud credit pressure |
Treat these numbers as a starting point for license spend, not the full bill. In practice, warehouse compute, admin time, and AI usage can push the total higher.
What to Check Before Signing
Once you have a rough estimate, the next step is the contract. That’s often where the final number shifts.
Before signing, confirm whether there are minimum Creator or Explorer seat requirements.[1] Also check how your data stack affects total cost. Tableau license cost is only part of total spend when live querying Snowflake, BigQuery, Redshift, or Postgres.[1]
A quick quote can look clean on paper, then get heavier once query costs and team support hours show up. That’s where many teams get caught off guard.
The Shortest Way to Estimate Tableau Spend
If you need a fast budget, start with seats first. Then layer in governance and AI costs.
Count only the people who need to publish or build data sources as Creators. Anyone doing browser-based editing is an Explorer. Everyone else is a Viewer.[1] After that, choose the lowest edition that covers your governance needs.[1]
For budgeting, it helps to think in two passes:
That simple split can save you from underbudgeting early growth while still keeping the first purchase grounded in what the team needs right now.