Business Intelligence
best AI self-service analytics natural language BI ThoughtSpot Power BI Tableau Looker Qlik 2025 2026
Compare ThoughtSpot, Power BI, Tableau, Looker and Qlik — features, NLP, pricing and use cases for AI-driven self-service analytics in 2025–2026.
AI-powered analytics tools are reshaping how businesses use data. Platforms like ThoughtSpot, Power BI, Tableau, Looker, and Qlik now enable users to ask questions in plain English and get instant insights, saving time and reducing reliance on technical teams. Here's a quick breakdown of their standout features and pricing:
ThoughtSpot: Focuses on conversational analytics with a search-first design. Pricing starts at $25/user/month.
Power BI: Offers deep Microsoft integration and AI tools like Copilot. Starts at $14/user/month.
Tableau: Known for rich visualizations and AI-driven insights. Costs $75/user/month for a Creator license.
Looker: Built on a semantic layer for precise, governed analytics. Pricing starts around $5,000/month.
Qlik: Features an associative engine for discovering hidden data relationships. Starts at $30/user/month.
These tools cater to different needs, from simplicity and natural language queries to advanced data modeling and governance. Below, we compare their strengths, weaknesses, and use cases to help you choose the right solution for your organization.
AI Analytics Platform Comparison 2025-2026: Features, Pricing, and Ratings
1. ThoughtSpot
In 2025-2026, ThoughtSpot transforms into a platform that prioritizes conversational analytics. The company moves away from traditional dashboards, focusing instead on creating an experience where users can simply type plain-English queries to get immediate answers. This approach makes analytics feel more like a natural conversation rather than a technical task. Below, we’ll dive into how ThoughtSpot’s advancements make analytics faster and easier to use.
Natural Language Processing (NLP) Capabilities
ThoughtSpot’s NLP engine is designed to understand and maintain the context of your queries. For example, if you ask, "What were Q4 sales in Texas?" and then follow up with, "What about California?" the platform remembers you’re still looking at Q4 data without needing to start over.
By late 2025, ThoughtSpot expanded its capabilities to handle unstructured data like text and images alongside structured data. This is especially helpful for teams working with customer feedback, support tickets, or product visuals.
AI and Analytics Innovations (2025-2026)
The Spotter Agentic Suite is at the heart of ThoughtSpot’s AI-driven tools. It includes:
SpotterViz for creating dashboards
SpotterModel for no-code semantic modeling
SpotterCode for embedding analytics
These tools don’t just analyze data - they take it a step further by automating actions through Smart Apps. For example, AI agents can update Salesforce records or send Slack notifications based on insights. Looking ahead to 2026, a Custom Agent Builder will allow businesses to fine-tune AI agents to fit their specific needs. Francois Lopitaux, SVP of Product Management at ThoughtSpot, shared the company’s vision:
"The idea is to provide an agentic experience for every user of our platform, that at any time during the analytics workflow, there is an assistant that helps you do the dirty work" [6].
Instead of static reports, ThoughtSpot’s AI agents make analytics actionable, integrating insights directly into operational workflows.
The platform has received strong feedback, earning a 4.5/5 rating on Gartner Peer Insights from 639 reviews [4]. However, it’s worth noting that achieving accurate AI results requires significant upfront work in semantic modeling [1] [5]. The effectiveness of its AI-generated insights depends heavily on how well the underlying data is organized and labeled, which is a key factor to consider during implementation.
2. Power BI
Microsoft is steering Power BI into new territory, moving beyond its traditional dashboard capabilities by integrating AI into your analytics workflow for 2025–2026. At the heart of this transformation is Copilot, a generative AI assistant designed to change how users interact with their data. If you're still using the Q&A feature, be aware that it will be deprecated in December 2026, so planning your transition is essential [7].
Natural Language Processing (NLP) Capabilities
Power BI Copilot takes a giant step forward by shifting from basic keyword-based queries to conversational AI. Unlike the outgoing Q&A feature, which could only generate visuals from keywords, Copilot offers much more. It can summarize entire reports, write DAX formulas, and even maintain the context of multiple questions in a single session [7][8].
By September 2025, Copilot was enabled by default as a standalone feature. Then, in January 2026, the introduction of Grounded References made it possible to attach specific reports or datasets using a "+" icon or "/" command [10][11]. To make the most of these capabilities, assessing data readiness is key. Features like the "Approved for Copilot" setting and "Prep data for AI" tools ensure accurate and context-aware results. And if you're switching topics, the "clear chat" function helps avoid confusion [8][9][10][11].
This enhanced NLP functionality also integrates seamlessly with Power BI's extensive data connectivity options.
Data Connectivity and Integration
Power BI connects with over 200 native systems, including Excel, Azure, Teams, Office 365, and major cloud platforms like Snowflake, BigQuery, and Redshift. Its Direct Lake mode now supports on-demand queries from OneLake, and upgrades to the ADBC driver have improved connector performance [3][10][12]. One notable update for 2025–2026 is that Direct Lake mode now supports mirrored Azure Databricks catalogs [10][12].
In August 2025, Microsoft added Entra ID (formerly Azure Active Directory) authentication for the PostgreSQL connector, enhancing security for users [12]. Additionally, a preview of the Google BigQuery connector launched in May 2025, improving both performance and reliability [13].
Here’s a quick look at pricing as of April 2025:
Pro: $14/user/month
Premium Per User: $24/user/month
Capacity-Based Premium: Starting at $5,000/month [3]
To access Copilot features, you'll need a Fabric capacity of F2 or higher, or a Power BI Premium capacity of P1 or higher [9].
AI and Analytics Innovations (2025–2026)
With advanced NLP and robust data integration already in place, Power BI is pushing forward with new AI-driven analytics tools. Beyond natural language queries, the platform is moving toward "Translytical" workflows, allowing users to write data back and trigger automated actions directly from reports [10][13]. Another exciting addition is the App-Scoped Copilot, currently in preview, which provides context-specific answers verified by app authors [9]. For organizations not ready to embrace the standalone Copilot, there's an option in the admin portal to manually opt out of the automatic rollout [10]. However, Copilot is not yet available in sovereign clouds due to GPU limitations [9].
Microsoft is also encouraging more code-based modeling through TMDL (Tabular Model Definition Language), which improves version control and scripting for semantic models [10][12]. Additionally, the Power BI Enhanced Report Format (PBIR) became the default in early 2026, with full availability expected by the end of February 2026 [11].
These updates underline Power BI's commitment to blending AI with analytics, creating a more dynamic and interactive data experience.
3. Tableau
Tableau is reshaping analytics by introducing AI-driven tools designed to deliver fast and easy insights. The platform is moving beyond traditional dashboards toward Agentic Analytics, where AI agents handle tasks like data preparation and analysis. In April 2025, Tableau introduced Tableau Next, a platform powered by agentic AI, featuring tools for data preparation, querying, and observability [6]. This shift emphasizes natural language interactions, making data exploration more accessible.
Natural Language Processing (NLP) Capabilities
A key part of Tableau's NLP strategy is Tableau Pulse, a generative AI suite supported by the Einstein Trust Layer. At the heart of this system is the Metrics Layer, a centralized repository where KPIs are defined once and applied consistently across the organization [14]. With the Pulse Q&A Engine's "Ask" button, users can query metrics in plain English. The engine uses fast embedding models to match queries with relevant insights, minimizing delays and reducing the chances of AI hallucinations. Additionally, Tableau anticipates user needs by offering "Guided Questions", which predict potential queries based on data context [14].
"Tableau Pulse reimagines analytics done for your everyday business people by delivering intelligent, personalized, and contextual insights on the metrics that matter to them."
– Homer Wang, Product Manager, Tableau [15]
Another standout feature is Natural Language Generation (NLG), which identifies trends, outliers, and key drivers, then summarizes these findings in plain language. These insights are seamlessly delivered to tools like Slack and email, allowing users to stay informed without disrupting their workflow. Tableau highlights that nearly 70% of employees in marketing, sales, and service are underserved by traditional data tools [14].
Data Connectivity and Integration
Tableau excels in integrating with diverse data sources, offering over 100 native pre-built connectors [3]. These connectors make it easy to integrate data from various platforms. Tableau supports three connection modes: Live queries for real-time data, Extracts for offline analysis optimized for performance, and Hybrid models that combine both approaches. Analysts can also use multi-source joins to merge data from different platforms into a unified view. Additionally, Tableau Prep simplifies data cleaning and transformation with built-in ETL capabilities [3].
AI and Analytics Innovations (2025–2026)
Tableau's AI advancements are built on the Einstein Trust Layer, ensuring that GPT-powered features operate securely and maintain data privacy [14]. This framework provides guardrails for generative AI, ensuring insights are based on internal data. To get the most out of Tableau Pulse, analysts are encouraged to define key KPIs within the Metrics Layer, creating a solid foundation for natural language summaries and Q&A [14].
"Tableau's approach to AI is a multi-faceted strategy to simplify analysis and deliver smarter, faster, and actionable insights for everyone."
– Southard Jones, Tableau [14]
4. Looker
Looker has embraced advancements in analytics by using its semantic layer to provide accurate, governed insights. This code-first platform is built around its semantic layer, ensuring consistent metrics and business logic. In 2025, Looker fully integrated Google's Gemini models, introducing AI assistants that redefined how users interact with data. At the heart of Looker’s approach is LookML, a centralized semantic layer that acts as the definitive source for all metrics. This foundation allows Looker to deliver intelligent insights and automate analysis with precision.
Natural Language Processing (NLP) Capabilities
Looker’s Conversational Analytics allows users to query data in plain English, generating AI-driven insights and visualizations. Tools like the Formula, Visualization, and Code Interpreter Assistants enable users to perform complex calculations, create dynamic visualizations, and even forecast outcomes through conversational queries [16][18].
"Looker's unique foundation is its semantic layer, which ensures everyone works from a single source of truth."
– Peter Bailis, VP of Engineering, Google Cloud [16]
The importance of governance is clear - without it, query accuracy can drop below 20%. With Looker’s semantic layer, accuracy surpasses 95% [17]. For advanced users, the LookML Code Assistant offers guidance on creating dimensions and measures, while the Conversational Analytics API allows developers to embed natural language query features into custom applications [16].
By leveraging these NLP tools, Looker simplifies data integration and governance, creating a seamless analytics experience.
Data Connectivity and Integration
Looker goes beyond conversational analytics by enhancing data connectivity. In April 2025, the platform introduced Looker Reports, enabling direct links to Microsoft Excel, Google Sheets, and other essential sources [16]. Additionally, Looker integrated Spectacles.dev that same year, bringing automated testing and validation for SQL and LookML changes [16]. With Git integration for version control, Looker ensures data reliability throughout the integration process.
AI and Analytics Innovations (2025–2026)
Looker’s semantic layer significantly reduces errors in generative AI natural language queries - by as much as two-thirds [19]. The platform earned a 4.5/5 rating from 908 reviews on Gartner Peer Insights and was named a "Customers' Choice" in 2025 [4]. While the learning curve can be steep, the LookML layer guarantees metric consistency. Pricing starts at approximately $5,000 per month [2].
With its move toward agentic AI architecture, Looker’s reasoning agent can now tackle complex questions like “Why did this happen?” and “What will happen?” by utilizing multiple tools [19].
5. Qlik
Qlik has evolved from offering static reporting to embracing agentic AI, integrating intelligent agents that not only extract insights but also suggest actions. In May 2025, Qlik unveiled Discovery Agent, an AI-powered tool designed to scan applications and datasets, bringing risks and opportunities to the forefront. This shift from passive dashboards to proactive intelligence highlights Qlik's focus on advancing natural language and data integration capabilities.
Natural Language Processing (NLP) Capabilities
In 2025, Qlik Answers hit a significant milestone by enabling users to query both structured and unstructured data in a unified way. This means you can now uncover insights buried in PDFs, Slack messages, or images - not just spreadsheets and databases. The Associative Engine remains a standout feature, facilitating free-form exploration and uncovering relationships beyond the limits of traditional SQL queries. By 2026, the DARE Intelligence Grid framework added another layer of sophistication, allowing AI agents to handle multi-step reasoning tasks.
"AI will become useless if you only base it on structured data."
– Mike Capone, CEO, Qlik
Data Connectivity and Integration
Qlik has also stepped up its game in data connectivity and integration. To streamline real-time data preparation, the company acquired Upsolver in 2025, introducing no-code data streaming and wrangling capabilities. That same year, Qlik launched the Open Lakehouse, built on Apache Iceberg. This platform unifies storage for both structured and unstructured data while maintaining compatibility with tools like Snowflake, Apache Spark, and Amazon SageMaker. Additionally, the Write Table feature allows users to feed insights directly back into operational systems such as SAP and Salesforce, bridging the gap between analytics and action.
AI and Analytics Innovations (2025–2026)
Qlik continued to push the boundaries of analytics with the introduction of multivariate time-series forecasting through Qlik Predict in 2025. This feature supports scenario modeling, taking into account factors like seasonality and economic trends. In July 2025, the platform earned a 4.5/5 rating on Gartner Peer Insights, reflecting its strong reception. Qlik's pricing follows a tiered structure, tailored to user roles and deployment types. While the company is still expanding its autonomous agent capabilities, CEO Mike Capone emphasized the importance of "explainable AI", combining multi-modal automation into a single cohesive experience.
"With agentic AI, embedded automation and the Open Lakehouse, Qlik is moving decisively toward a unified, intelligent decision-making environment."
– Stephen Catanzano, Analyst, Enterprise Strategy Group
As Qlik continues to innovate, it aligns with the broader industry trend toward agile, intelligent analytics platforms, positioning itself as a key player in this transformation.
Strengths and Weaknesses
Each analytics platform brings its own set of benefits and challenges, making it important to weigh these against your team's needs and resources.
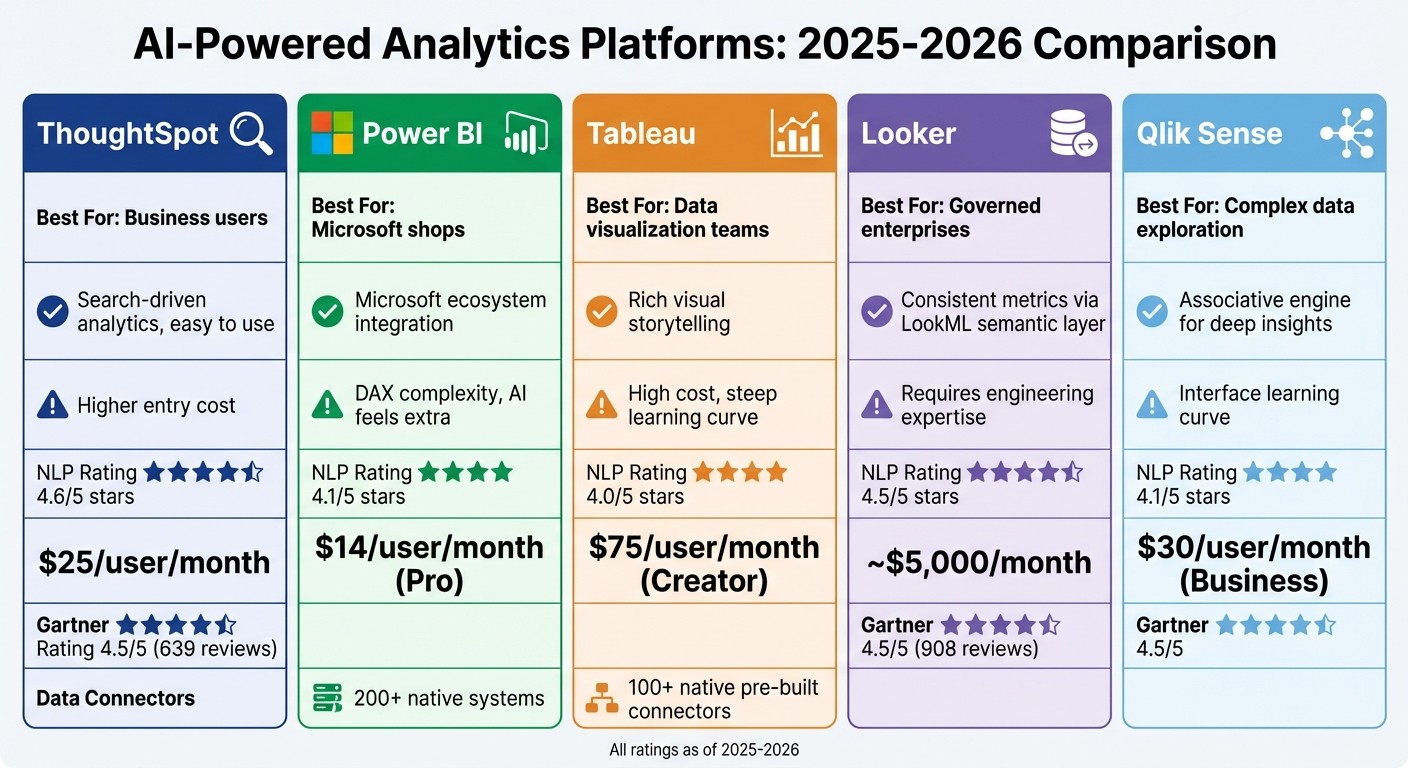
ThoughtSpot is praised for its user-friendly, search-based interface, making analytics accessible even for non-technical users. Its natural language query capabilities score high (4.6/5), and it offers robust security features. However, its entry price of $25 per user per month might be a hurdle for smaller teams or organizations with limited budgets.
Power BI shines with its seamless integration into the Microsoft ecosystem, offering essential governance and security features powered by MS Fabric. Its pricing is competitive at $14 per user per month for the Pro license. However, mastering DAX (Data Analysis Expressions) can be a steep learning curve, and its AI-driven Copilot may feel more like an optional extra than a core feature.
Tableau stands out for its ability to create visually compelling narratives, earning high marks for its visualization capabilities (4.7/5). That said, it comes with a challenging learning curve and a hefty price tag - its Creator license costs $75 per user per month. Additionally, Tableau often relies on data extracts rather than live queries, which can occasionally impact the freshness of the data.
Looker is known for its LookML semantic layer, which ensures consistent metrics across reports (4.5/5). However, fully utilizing Looker requires a strong data engineering foundation, and its pricing - starting at around $5,000 per month - makes it less accessible for mid-sized organizations.
Qlik Sense offers a unique associative engine that uncovers hidden relationships in complex datasets. It scores well in essential BI features like visualization and security (4.5/5) and balances performance with data freshness through its in-memory architecture. Priced at $30 per user per month for the Business tier, it’s relatively affordable, though its distinct interface and approach to data exploration may take some getting used to.
Here’s a quick comparison to help you decide:
Platform | Key Strength | Main Weakness | NLP Rating | Starting Price |
|---|---|---|---|---|
ThoughtSpot | Search-driven analytics, easy to use | Higher entry cost | 4.6/5 | $25/user/month |
Power BI | Integrates with Microsoft ecosystem | DAX complexity, AI feels extra | 4.1/5 | $14/user/month |
Tableau | Rich visual storytelling | High cost, steep learning curve | 4.0/5 | $75/user/month (Creator) |
Looker | Consistent metrics via LookML | Requires engineering expertise | 4.5/5 | ~$5,000/month |
Qlik Sense | Associative engine for deep insights | Interface learning curve | 4.1/5 | $30/user/month (Business) |
When choosing a platform, consider your team's technical expertise and budget. Power BI works well for organizations already using Microsoft tools, while Tableau is perfect for teams that need visually rich analytics. ThoughtSpot is ideal for business users who want quick insights without technical complexity. Looker suits enterprises with strong data modeling capabilities, and Qlik Sense is great for advanced users exploring intricate data relationships.
Conclusion
Selecting the right AI-driven analytics platform in 2026 comes down to your organization's technical expertise, budget, and how your teams work with data. Power BI is a solid option for Microsoft-focused organizations, offering competitive pricing but requiring familiarity with DAX for optimal use. Tableau excels in visual storytelling, making it a favorite among data science teams, though its complexity and cost can be barriers. For business users seeking simplicity, ThoughtSpot shines with its natural language query capabilities, allowing users to interact with live data without relying on analysts. Looker is ideal for environments focused on governance and metric consistency, leveraging its LookML semantic layer, though it demands strong data engineering support. Meanwhile, Qlik Sense stands out with its associative discovery feature, uncovering hidden relationships in data.
The platform's architecture plays a crucial role in performance. A robust semantic layer can significantly improve accuracy, boosting it from below 20% to over 95% [17]. As one expert puts it:
"Without the right architecture, these AI agents will underperform and erode trust. The critical enabler for agentic BI isn't the language model or the interface. It's the semantic layer" [17].
For scalability, both Power BI and Looker are capable of handling enterprise-level deployments, though Power BI may face challenges with very large datasets. When it comes to governance, Looker's code-based system helps maintain metric consistency across teams. For AI-driven analytics, ThoughtSpot’s search functionality reduces reliance on analysts, while Power BI’s Copilot and Tableau’s Pulse are often seen as add-ons rather than fully integrated features.
Ultimately, the best choice is the one that aligns with your team’s unique needs and technical infrastructure.
FAQs
How do ThoughtSpot and Power BI compare in their natural language processing (NLP) capabilities?
ThoughtSpot and Power BI take very different approaches when it comes to using natural language processing (NLP) to improve user experience.
ThoughtSpot is all about search-driven analytics. Users can type plain English questions, and the platform instantly translates those into SQL queries with impressive accuracy using its advanced NL2SQL technology. This makes it an easy-to-use tool, especially for non-technical users who want quick and straightforward access to data.
Power BI, by contrast, includes NLP as part of a larger suite of enterprise-focused tools. While it does provide AI-assisted natural language queries, this feature plays a supporting role. Power BI leans more heavily on traditional reporting, data visualization, and analytics, positioning NLP as one of many tools available to users.
In short, ThoughtSpot shines with its intuitive, search-based design, while Power BI integrates NLP into a broader, enterprise-grade analytics platform.
How does Tableau's pricing compare to other AI-driven analytics platforms?
Tableau is often seen as a premium choice among AI-powered analytics tools, and its pricing reflects this positioning. While alternatives like Power BI typically cost around $10–$20 per user per month, Tableau's pricing is noticeably higher. This makes it a better match for organizations with larger budgets and more complex data needs.
The higher cost ties directly to Tableau's emphasis on providing enterprise-grade tools and features. For businesses that prioritize advanced analytics capabilities over cost considerations, Tableau offers a powerful solution for gaining deeper data insights.
What should organizations consider when selecting the best AI-driven analytics platform?
When choosing an AI-driven analytics platform, there are several important factors to consider to ensure it meets your organization's needs. First, compatibility with existing systems is a must. A platform that integrates smoothly with your current tools and data sources can help avoid unnecessary headaches and streamline operations.
Next, think about your organization's specific requirements. Factors like company size, industry focus, and the level of analytics complexity needed should guide your decision.
Another crucial aspect is ease of use and the platform's AI capabilities. Tools equipped with features like natural language processing (NLP) and automated insights can help teams make quicker, smarter decisions based on data. Lastly, don't overlook practical considerations like cost, scalability, and the overall user experience. A platform that aligns with your budget and future growth plans will serve your organization well in the long run.
By keeping these priorities in mind, you can select a platform that supports your analytics efforts efficiently and effectively.
Related Blog Posts