Tableau Desktop Pricing in 2026: A Complete TCO Guide
Understand Tableau Desktop pricing in 2026. This guide breaks down Creator, Explorer, and Viewer licenses, hidden costs, and how to calculate total cost.
https://www.youtube.com/watch?v=MW1NuvC5JrY
published
Outrank AI
tableau desktop pricing, tableau license cost, bi tools pricing, tableau tco
19a2442e-8fd1-4e09-a5f6-d2a8656b3f3a

Tableau Desktop pricing starts at $75 per user per month for a Creator license on Tableau Server Standard, billed annually. That’s the sticker price, but it’s rarely the number that determines whether Tableau is affordable for a growing team.
Most founders hit the same wall. You look up tableau desktop pricing, see a neat per-user number, and assume you can budget from there. Then the key questions arrive. Who needs Creator seats? Who can live with Explorer? Can business teams edit dashboards without a desktop install? Do you need Tableau Cloud, Tableau Server, or both? Who owns administration, permissions, extracts, refresh failures, and training?
That’s where Tableau gets expensive. Not only in software spend, but in the way its licensing model shapes your org chart, your collaboration workflow, and your operating overhead. A small team can make the math work. A growing company often discovers that the pricing model rewards tightly controlled analytics and penalizes broad self-service.
I’ve seen this happen more than once. The initial quote rarely causes the pain. The pain shows up later, when product managers want to tweak dashboards, department leads want trusted access without waiting on analysts, and the data team realizes that every new use case forces another licensing decision.
If you’re trying to decide whether Tableau is a clean purchase or a long-term cost trap, it helps to think less like a software buyer and more like an operator. That starts with total cost of ownership, not the list price. If you're comparing this against broader BI economics, this breakdown of BI platform cost benchmarks across modern tools is also a useful companion.
Table of Contents
Decoding Tableau's Pricing Puzzle
The pricing puzzle usually starts with a category mistake. Buyers search for tableau desktop pricing as if Desktop were a discrete product with a clear business cost. In practice, Tableau sells a role-based system, and Desktop is only one part of it.
That difference matters because the software cost is tied to who gets to do what. Tableau doesn’t just charge for access. It charges according to the level of creation, editing, and consumption you allow across the company. That means your analytics model and your budget model become intertwined.
A founder usually asks a simple question: “What does Tableau Desktop cost?” The operational question is harder and more useful: “What team behavior does this license structure force us into?” Those are not the same thing.
Teams rarely regret Tableau because the charts look bad. They regret it when the licensing model turns simple collaboration requests into procurement decisions.
This is why total cost of ownership matters more than list price. If your company has a small central analytics team, rigid publishing workflows, and a limited group of dashboard authors, Tableau can be a manageable premium tool. If your company wants many people exploring, editing, and iterating across functions, the cost rises in ways the pricing page doesn’t make obvious.
There’s also a planning issue. The license model nudges companies toward a hub-and-spoke operating style where a few people build, a smaller group edits in the browser, and everyone else consumes. Sometimes that’s exactly right. Sometimes it creates bottlenecks that look like process problems but are really pricing problems.
Understanding Tableau's Role-Based Licensing Model
A common buying mistake looks like this. The company budgets for a few Tableau Desktop users, assumes everyone else can share dashboards, and only later discovers that Tableau prices collaboration by role, not by product. That is where the cost model starts shaping the org chart.
Tableau sells three roles: Creator, Explorer, and Viewer. Those labels sound tidy. In practice, they define who can build the semantic layer, who can modify published work, and who is limited to consumption. For a growing team, that is not just a permissions decision. It affects queue times for dashboard requests, who becomes a bottleneck, and how often finance gets pulled back into license approval.
Why Tableau Desktop is not a standalone business purchase
Tableau Desktop is included in the Creator license, which is the highest-cost user tier. As listed in Tableau pricing timeline data, Creator is $75 per user per month for Tableau Server Standard Edition, and it includes Tableau Desktop, Tableau Prep Builder, and access to Tableau Cloud or Server. The same source also supports the current role-based pricing ranges discussed in this section.
That matters because the fundamental purchase decision is not “Do we need Desktop?” It is “Which people need full authoring rights, and what happens when that list grows?” In a small company, a handful of Creator seats can be fine. In a company where analytics work is spreading into operations, finance, product, and customer success, each new workflow tends to create pressure for more authoring access.
That pressure becomes a total cost of ownership problem, not just a license problem. Every time an Explorer user hits a limit, one of two things happens. The team upgrades that person to Creator, or a Creator becomes the gatekeeper for changes. One path raises software spend. The other raises cycle time.
For teams comparing premium BI software with other approaches, this breakdown of open-source versus paid data analysis tool costs, ROI, and operational risk is a useful companion to Tableau’s model.
A simple way to map licenses to team roles
The cleanest way to assign licenses is to map them to recurring work, not job titles.
Creator fits the people who build data sources, prepare data, create dashboards, and publish assets others depend on.
Explorer fits the people who need to adjust existing dashboards and interact with published content in the browser, but do not own the full authoring workflow.
Viewer fits the people who only consume dashboards and reports.
That distinction sounds minor until the company grows. A product manager who starts by reviewing dashboards often ends up requesting edits, then creating variants for weekly reviews, then asking for direct control. A finance lead may stay a pure Viewer for years. A RevOps manager often does not.
Here is the practical comparison.
License Tier | Price per user per month | Core Functionality | Typical User |
|---|---|---|---|
Creator | $75 | Full workflow access including Tableau Desktop and Tableau Prep Builder, plus building dashboards and connecting to data sources | Data analyst, BI developer, analytics engineer |
Explorer | $42 | Web-based editing on existing content without full data source creation capabilities | Product manager, operations lead, business analyst |
Viewer | $15 | Read-only access to dashboards and published content | Executive, sales manager, general business user |
Creator
Creator seats should go to the people responsible for producing trusted analytics assets. In many companies, that means BI developers, analytics engineers, and a small number of senior analysts. This is also the tier that tends to expand quietly after implementation, because every business unit eventually wants faster turnaround on changes.
Explorer
Explorer is the tier that looks efficient on paper and causes the most friction in practice. It works well for users who can stay inside the boundaries of published content. It works poorly when those users need new data models, deeper source changes, or independent experimentation. If several Explorer users are filing constant requests to the same two Creators, the team has a workflow design problem tied directly to licensing.
Viewer
Viewer is the easiest tier to understand and the easiest one to overuse as a default answer. It is a good fit for broad dashboard distribution, executive reporting, and stable departmental metrics. It is a poor fit for teams that say they want self-service analytics but only fund read-only access.
Practical rule: License people for the work they do every week, not the title in HRIS.
That rule avoids two expensive mistakes. The first is paying Creator rates for people who only read dashboards. The second is forcing high-context business users into lower tiers, then absorbing the operational cost when every meaningful change has to pass through a small authoring team.
The role mix also rarely stays fixed. As the company adds departments, data sources, and review cadences, Tableau’s licensing model tends to push teams toward a centralized build structure unless they keep adding Creator seats. That is the core trade-off. You can control license spend, or you can distribute authoring more broadly. Doing both at the same time is hard.
On-Premise Server vs Tableau Cloud Deployment Costs
A founder approves Tableau for 40 people, expects a clean SaaS rollout, and six months later the analytics lead is spending part of every week on permissions, refresh failures, and environment issues. That is usually the deployment decision. Cost changes, but team design changes with it too.
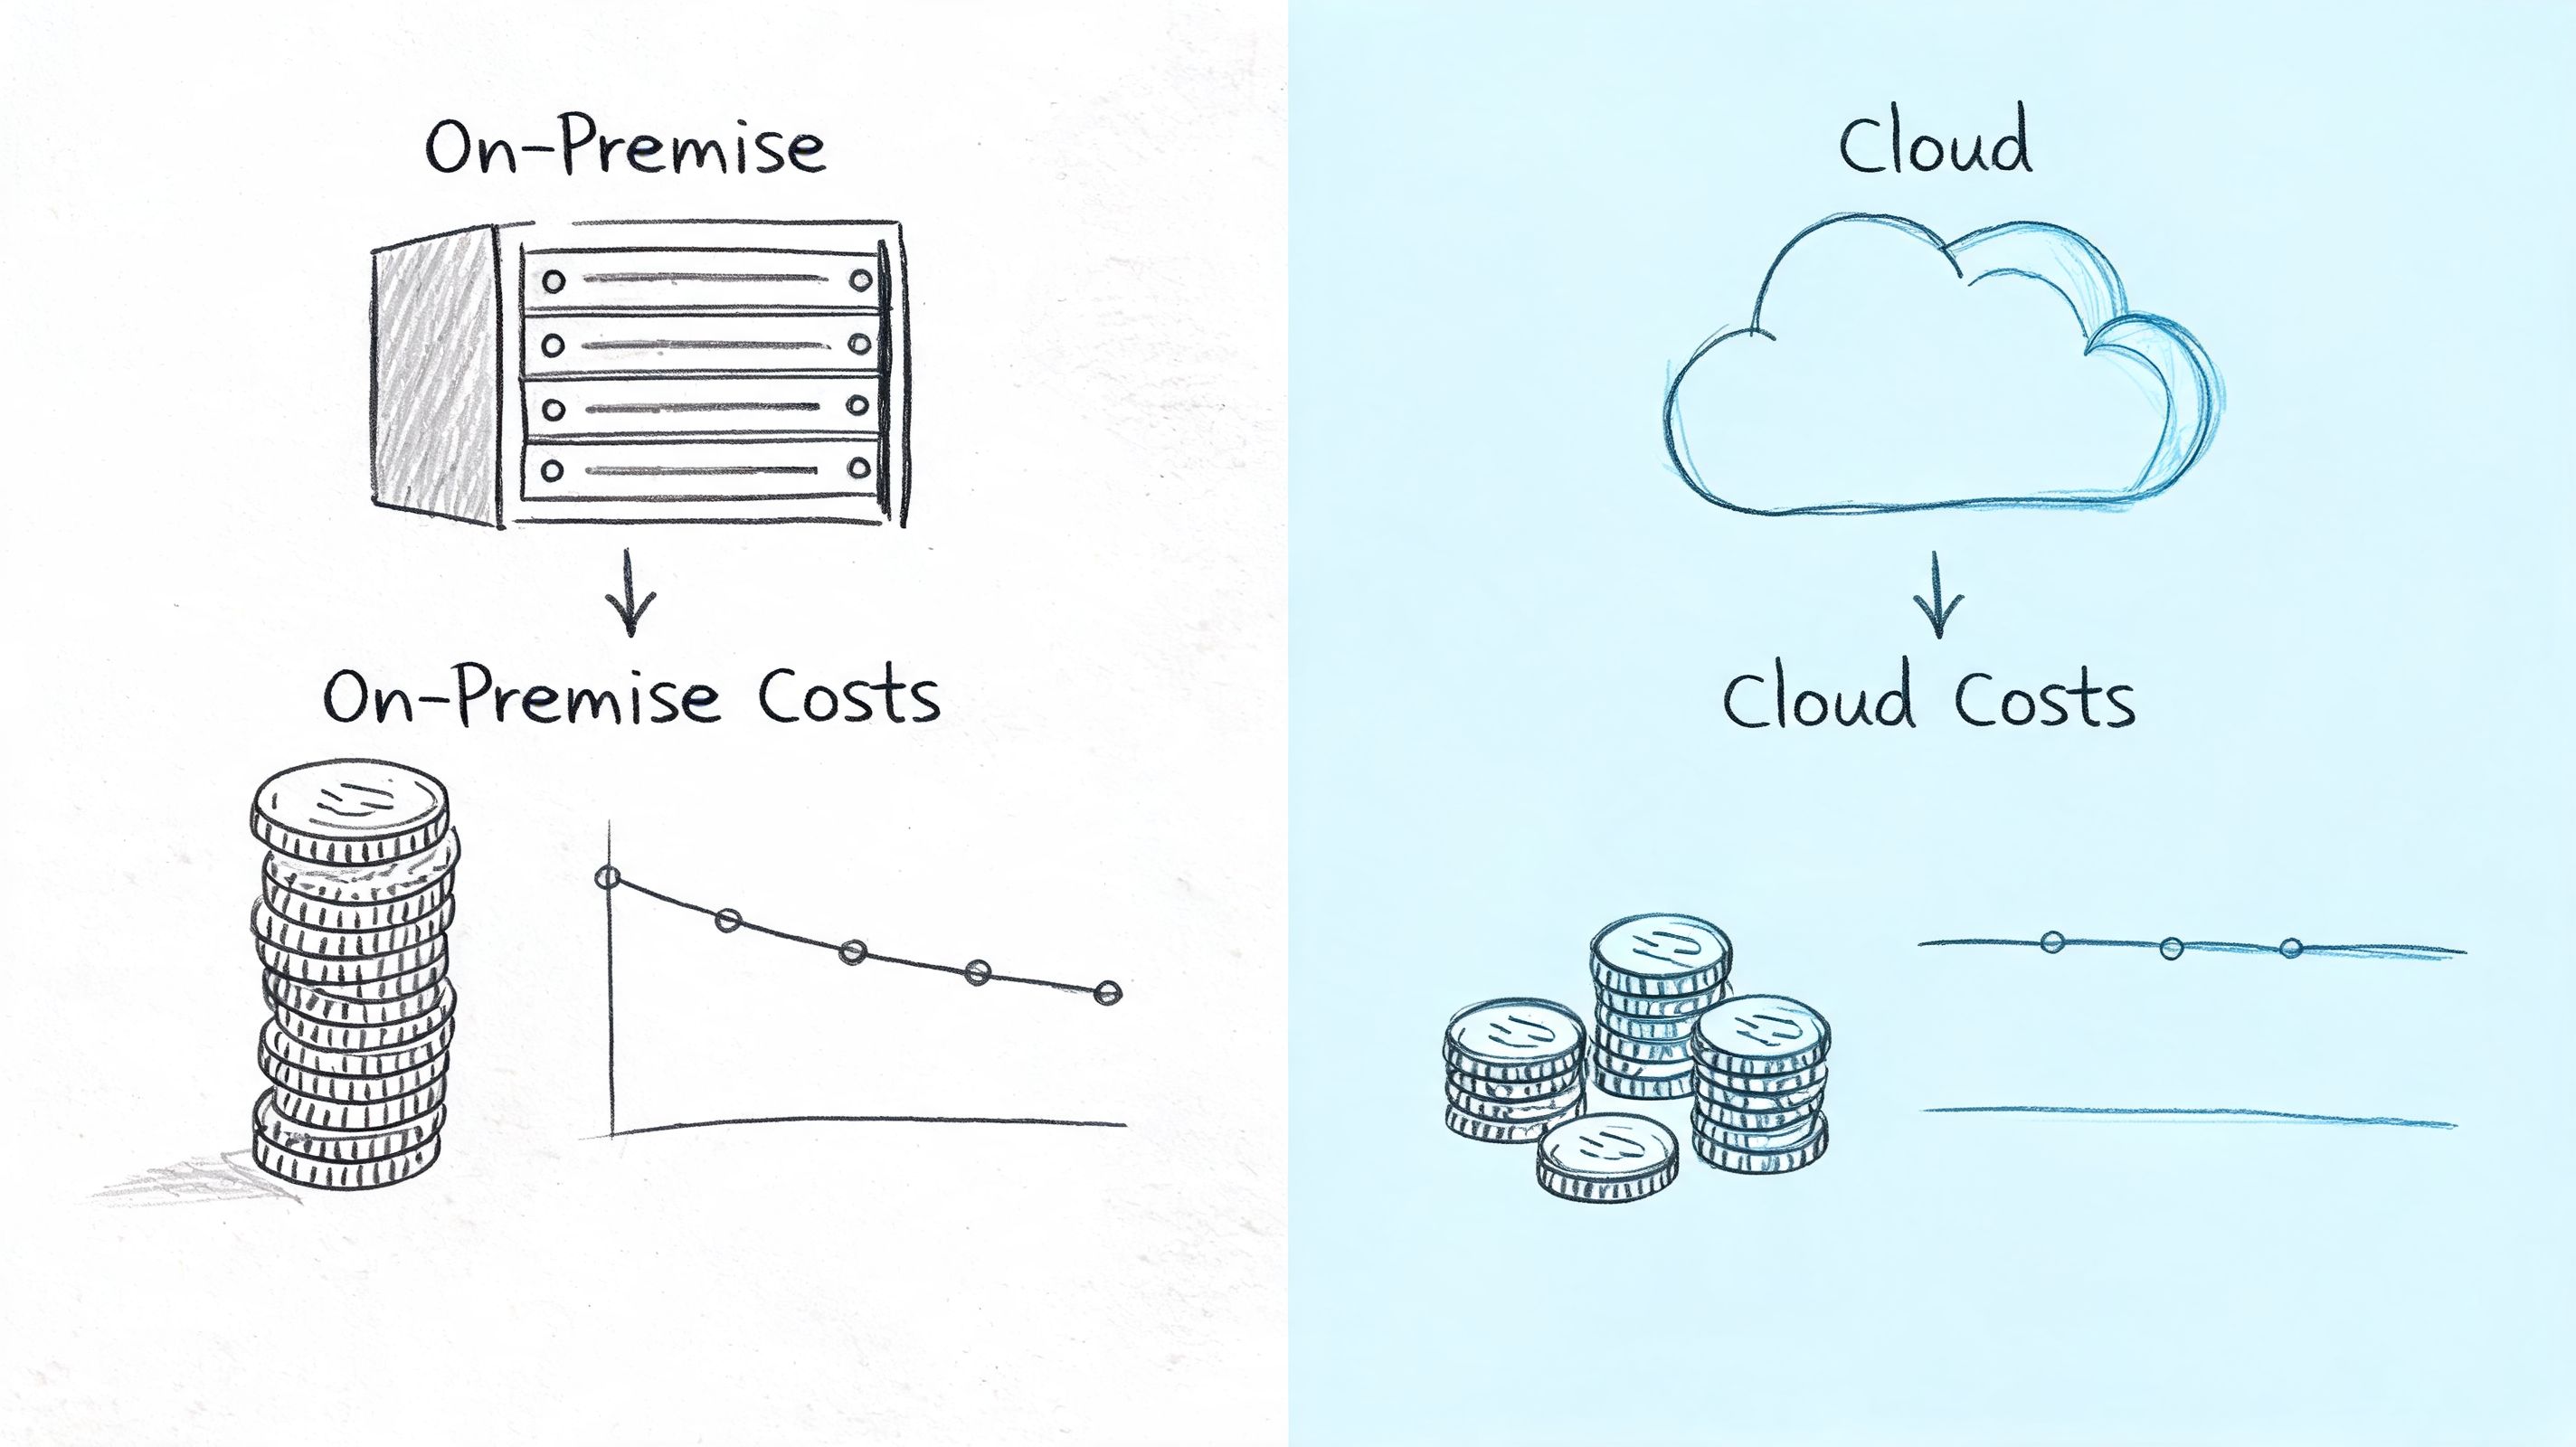
Tableau gives buyers two broad paths. Tableau Server runs on infrastructure your company manages. Tableau Cloud runs as a hosted service under Tableau’s operating model. The license quote is only part of the difference. The bigger question is who owns uptime, access, upgrades, and performance once usage spreads across the business.
That ownership question matters more as the team grows. A small deployment can survive with informal admin work. A larger deployment usually cannot. Someone has to handle authentication, monitor extract jobs, coordinate outages, and keep the environment from turning into a backlog of support tickets.
What changes between Standard and Enterprise
Recent Tableau pricing breakdowns indicate that Server and Cloud packages can look similar at the seat level until governance requirements show up. The bigger jump tends to come when teams need enterprise controls around asset visibility, lineage, and administration. That is where buyers stop comparing list prices and start paying for operating discipline.
Enterprise features matter most when Tableau becomes shared infrastructure across departments. If finance, ops, and product are all publishing data assets into the same environment, lineage is no longer a nice extra. It reduces the risk of breaking downstream workbooks, duplicating logic, or losing trust in published sources. In practice, that means the higher edition can be justified. It also means the platform now needs tighter stewardship, clearer ownership, and more process around change management.
If you are comparing hosted analytics models more broadly, this overview of cloud-based business intelligence software gives useful context.
Why Server often looks cheaper than it is
Server wins a lot of spreadsheet comparisons because infrastructure labor rarely sits on the same line as software. Procurement sees one number. The data team inherits the rest.
With Tableau Server, your team usually takes on work such as:
Environment administration, including setup, upgrades, patching, and access management
Performance tuning, especially around extracts, concurrency, background jobs, and usage spikes
Reliability operations, when refreshes fail, schedules drift, or users lose access to trusted content
Security coordination with identity systems, internal controls, and audit requirements
Those are normal platform responsibilities. They also create a TCO gap that gets missed during evaluation. If one analytics engineer or BI lead becomes the default Tableau admin, part of that person's week is now tied to platform care instead of analysis, data modeling, or stakeholder work.
Cloud shifts much of that burden off the internal team. You give up some infrastructure control, and you accept Tableau’s release cadence and service boundaries. In return, the team spends less time babysitting the platform. For many mid-market companies, that trade is worth more than the difference in license packaging because the scarce resource is not budget alone. It is operator time.
Server makes sense when the company already has strong internal IT support, stricter control requirements, or environment constraints that rule out hosted delivery. Cloud makes sense when speed, lower admin overhead, and easier scaling matter more than fine-grained infrastructure control.
Choose based on the operating model you can actually support. A cheaper deployment path on paper becomes expensive fast if it turns your analytics team into part-time system administrators.
The Hidden Costs Beyond the License Fee
Tableau Desktop pricing is commonly misunderstood. The visible cost is the seat. The expensive part is everything required to make those seats useful, governable, and collaborative.
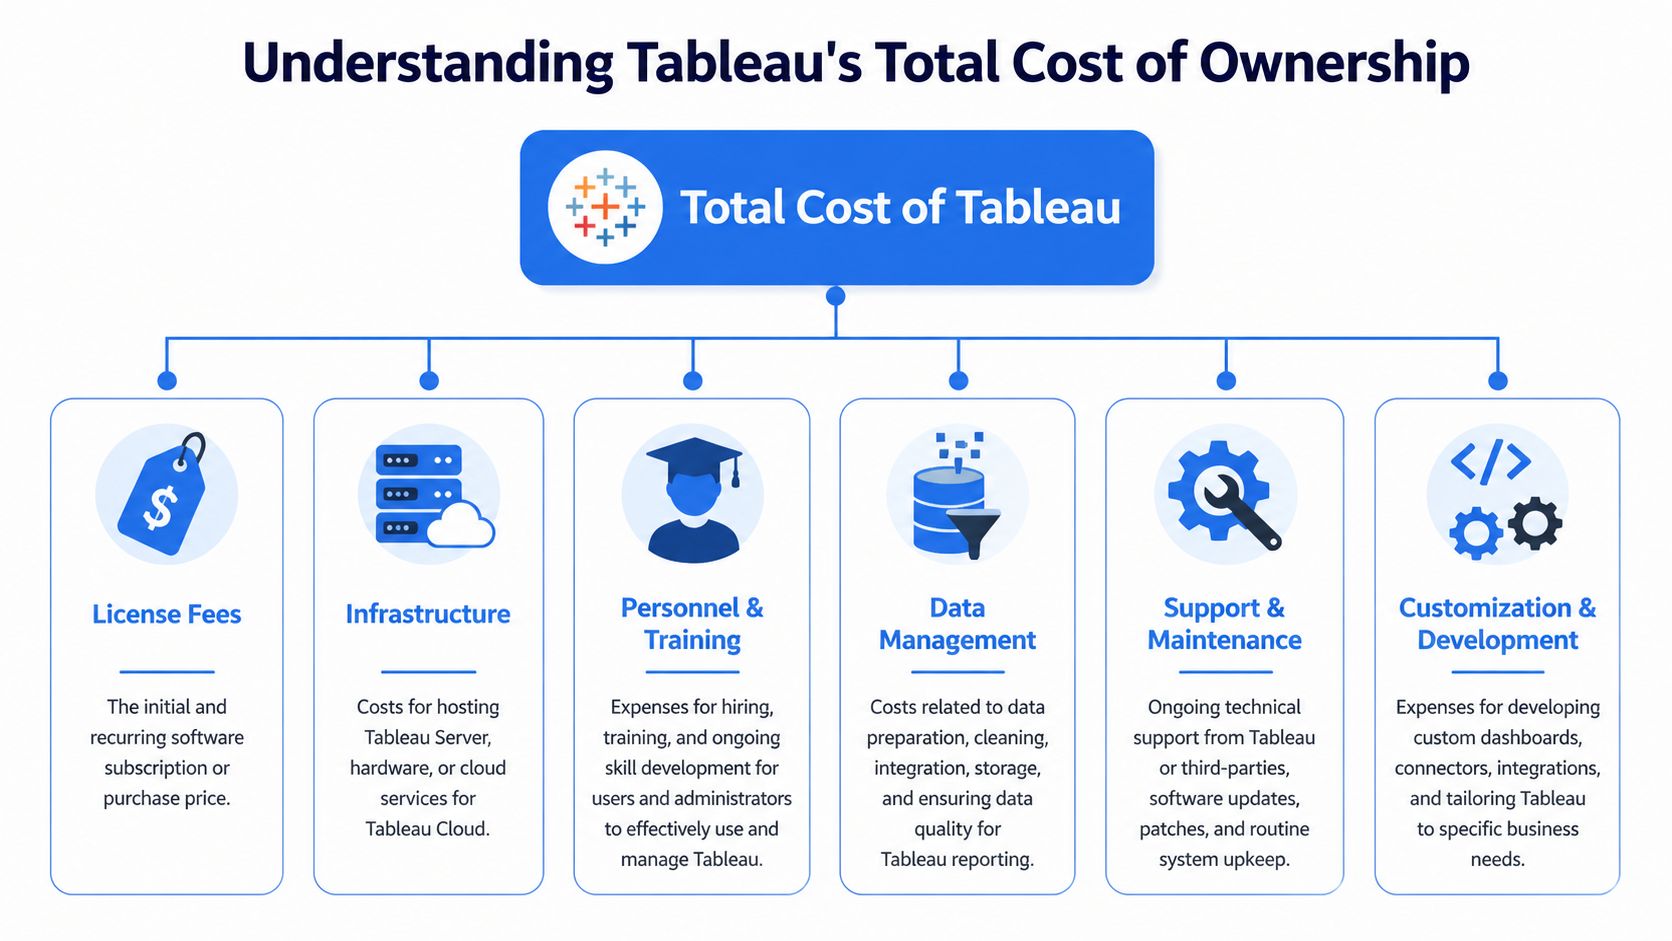
A lot of teams budget for licenses and then discover they’ve purchased a workflow, not just a product. Someone has to define semantic consistency. Someone has to manage data sources. Someone has to troubleshoot refresh schedules, permissions, workbook sprawl, and user onboarding. And if your business users aren’t fluent in Tableau’s way of working, they won’t magically become self-serve because seats exist.
Where teams underestimate Tableau spend
The first hidden cost is implementation effort. Even a straightforward deployment needs decisions around source connections, naming standards, publishing patterns, permissions, and ownership. If you skip that discipline, Tableau gets messy fast. If you do it well, you’re spending time from your best analytics people before the platform has delivered much value.
The second hidden cost is training. Tableau is usable, but effective Tableau is still a craft. Teams need to learn not just where the buttons are, but how to structure workbooks, publish trusted assets, and avoid building the same metric five different ways. That training burden lands somewhere. Usually on the data team.
The third is administration. Someone ends up being the de facto Tableau owner. Sometimes it’s a BI engineer. Sometimes an analytics manager. Sometimes an unlucky senior analyst. In all cases, the platform starts demanding platform work.
It's useful to consider:
Software spend gets approval.
Admin burden gets absorbed.
Analyst time gets reallocated.
Business frustration shows up later when self-service stalls.
For a deeper look at this broader pattern, this article on the hidden costs of traditional BI platforms aligns closely with what teams run into after the contract is signed.
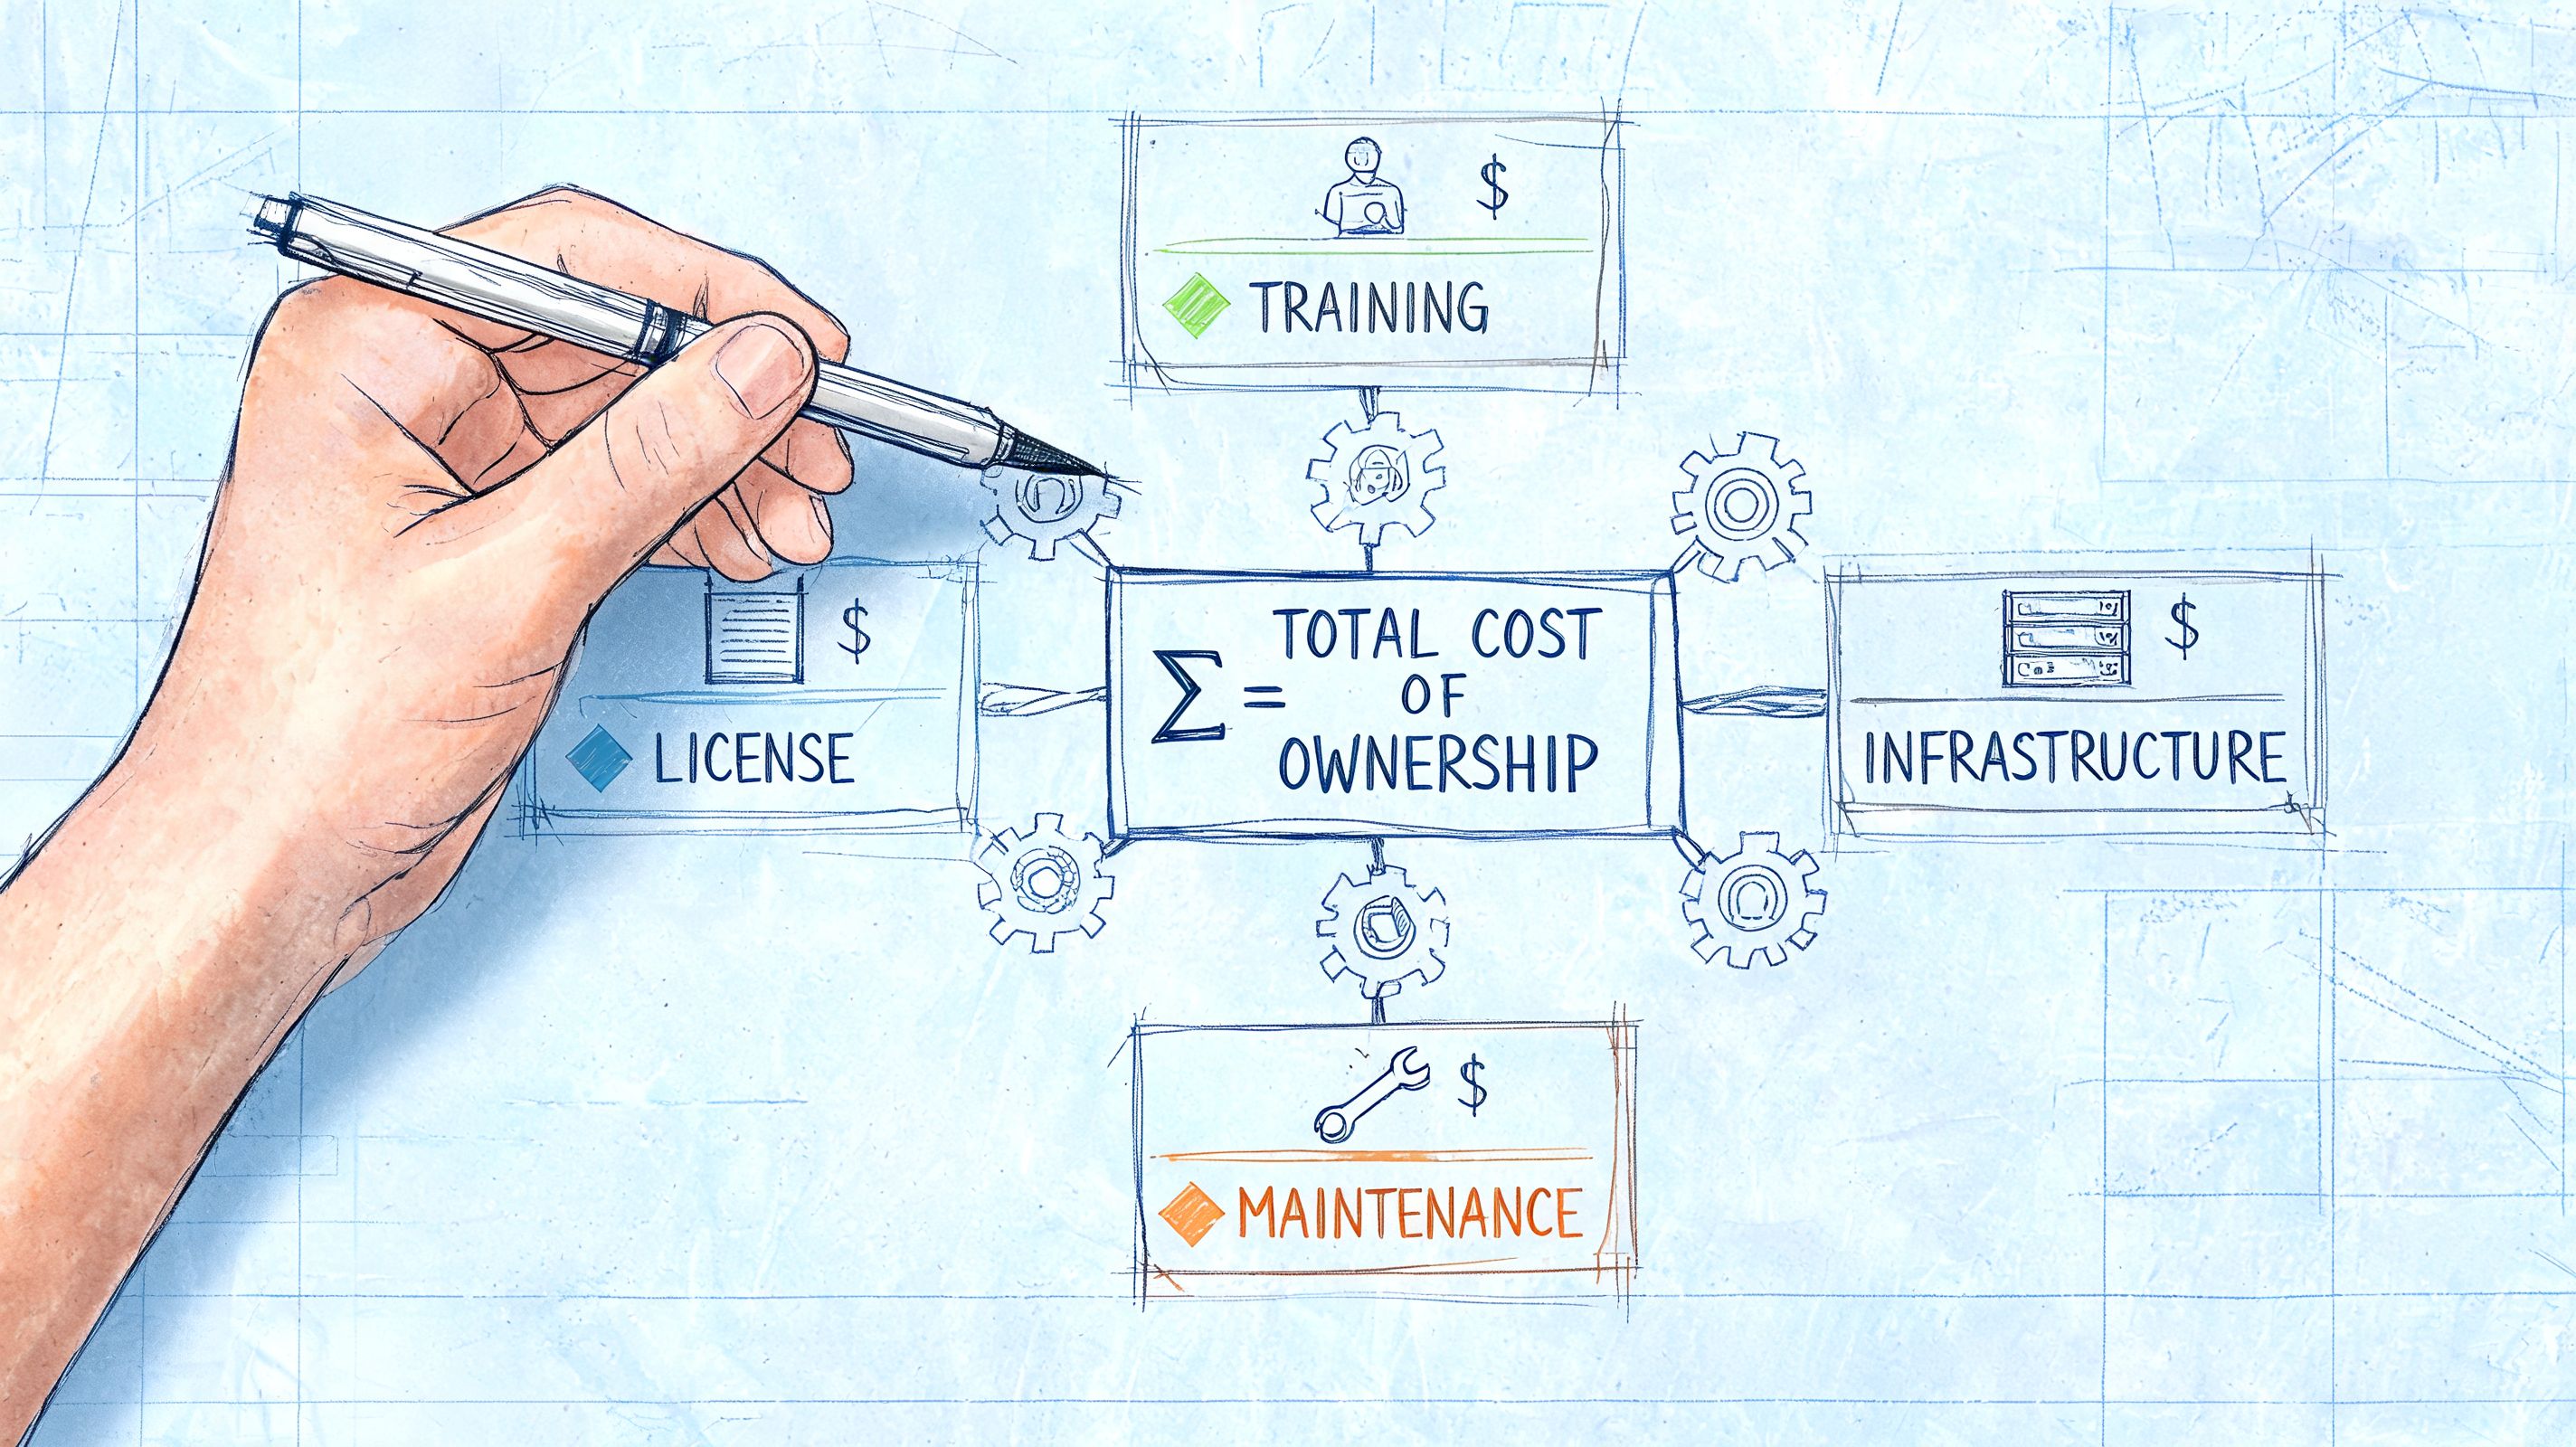
A short walkthrough helps illustrate the TCO mindset:
The collaboration tax in Tableau Desktop pricing
One of the most important pricing realities is that Desktop by itself doesn’t solve collaboration. According to Upsolve’s Tableau pricing analysis, Tableau Desktop is marketed at $75 per month, but sharing dashboards requires purchasing a separate Cloud or Server Creator license at $75 per month as well. That means collaborative use reaches a minimum of $150 per month per creator, which the same analysis describes as a 100% cost multiplication.
That catches a lot of first-time buyers off guard. They think they’re buying an authoring tool. What they’re buying is one part of a publishing system.
This has practical consequences:
A solo analyst can build locally, but the business still can’t rely on that work unless it’s published and managed.
A team can prototype cheaply in theory, but production sharing introduces platform costs quickly.
Budget holders often discover too late that “Desktop” was never the full operating model.
Buying Tableau Desktop without planning for sharing is like buying a presentation tool and forgetting you need a place to publish the deck everyone depends on.
Operational overhead that doesn't appear on the pricing page
This is the part most founders feel in month six.
When teams grow, Tableau can create a queue. Creators become gatekeepers because they own the highest-value capabilities. Explorers can help, but only within the boundaries of published assets. Viewers consume what exists. If the business wants new metrics, new source logic, or new dashboard structures, those requests drift back to a relatively small group.
That’s not a flaw if your company prefers centralized BI. It is a flaw if your company says it wants self-service but funds only a narrow set of creators.
The hidden TCO isn’t just operational labor. It’s the cost of slower iteration. Product managers wait. Analysts spend time translating requests into dashboards. Data teams become a service desk. Leaders think they bought democratized analytics when they really bought governed distribution.
How to Estimate Your Team's Total Cost of Ownership
The cleanest way to estimate Tableau cost is to model behavior, not just users. Headcount alone doesn’t tell you much. Workflow does.
A common mistake is assigning licenses by seniority or department. A better approach is to ask who creates data sources, who edits dashboards, who only consumes, and who will likely outgrow their initial role once the company starts depending on analytics more heavily.
Start with workflow not headcount
Begin with four groups.
People who need full authoring and data prep
People who need browser-based editing on published content
People who only need to read and interact with dashboards
People who will create operational load without obviously needing a license, such as admins, data owners, or support staff
That fourth group matters because they may not increase your seat count directly, but they increase ownership cost.
A useful external benchmark comes from Zoho’s Tableau cost analysis. It notes that for a 500-person team needing 50 Creator-level analysts, monthly costs reach approximately $37,500, or $450,000 annually. The same analysis adds that introducing 200 Explorer users raises cost by another $10,080 monthly. That example captures the core problem with role-based BI pricing. As the organization broadens access, cost grows with every layer of analytical participation.
A practical estimation framework
Use this sequence.
Step | What to calculate | Why it matters |
|---|---|---|
1 | Count true Creators | These are your highest-cost analytical builders |
2 | Count likely Explorers | Browser editing demand is often undercounted |
3 | Count broad Viewers | Reporting audiences expand quickly once dashboards become trusted |
4 | Identify deployment model | Cloud reduces some operational burden, Server adds internal responsibility |
5 | Add support load | Admin, governance, training, and publishing discipline all consume team time |
Then stress-test the estimate with three questions:
What happens if more managers want to edit? Explorer demand often grows after rollout.
What happens if analytics becomes cross-functional? Product, finance, revenue, and operations all start requesting direct access.
What happens if one or two creators become bottlenecks? You may need more premium seats than planned just to keep work moving.
Here’s the practical advice I give founders. Build one budget for what your team needs on day one, then a second budget for what happens when Tableau succeeds. The second number is usually the one that matters.
Budget for adoption, not just deployment. If people actually use Tableau, your first estimate is usually too low.
If you want a rough internal planning model, separate your estimate into two buckets. First, direct license cost by role. Second, operational ownership cost, which includes administration, governance, onboarding, support, and the data team time required to keep self-service from collapsing into dashboard chaos.
That approach won’t give you perfect precision, but it will keep you from making the classic mistake of treating Tableau like a simple desktop software purchase.
Procurement Tips and Securing the Best Price
Once you know your likely license mix, procurement gets more strategic. The worst time to negotiate is when you still don’t understand your operating model. At that point, every discount can hide a bad packaging decision.
A good buyer focuses on fit before price. If you overbuy Creator seats, the discount won’t save you. If you underbuy and your team immediately hits workflow limits, the lower quote won’t matter either.
What to negotiate besides seat price
Seat price matters, but it isn’t the only lever.
Future flexibility matters more than it seems. Ask how adding users later will be handled and whether your initial mix can change as adoption evolves.
Training support can save real internal effort. If your business users need help becoming productive, that should be part of the commercial conversation.
Governance expectations should be explicit. If you need stronger lineage, access controls, or administrative support, address that before signing.
Renewal clarity matters because analytics platforms become sticky. Make sure the contract doesn’t leave you surprised when usage patterns change.
How to avoid buying the wrong mix
Procurement teams often optimize for the visible quote. Operators need to optimize for the likely workflow six months later.
Two habits help:
Run a role audit before the quote is finalized. Don’t accept department-level estimates like “marketing needs five seats.” Name the actual users and what they do.
Model a growth scenario. If Tableau becomes the reporting system of record, ask who will demand editing rights next.
The best Tableau negotiation isn’t just about lowering cost. It’s about reducing future rework. If your contract leaves no room for role changes, usage expansion, or practical support, you may save money upfront and pay for it later in friction.
When to Consider Alternatives or Embedded Analytics
Some teams should buy Tableau. Others should pause and ask a harder question. Not “Which Tableau license should we choose?” but “Is this licensing model aligned with how we want analytics to work?”
That distinction matters because Tableau is opinionated. It works best when a relatively controlled set of people build and govern analytics for a wider audience. If that’s your model, the platform can fit well. If your culture rewards fast iteration, broad analytical curiosity, and more technical workflows, the same structure can become restrictive.
Signals that Tableau's model fits
Tableau is usually a reasonable choice when your company values:
Centralized dashboard ownership with clear publishing control
Polished executive reporting that shouldn’t change casually
A small authoring group with the skill and time to own data prep and dashboard standards
Governance-first analytics where consistency matters more than flexibility
In those environments, role-based licensing reinforces the operating model instead of fighting it.
Signals that it may slow you down
The warning signs are different and usually show up in day-to-day work.
If your product managers constantly want to ask new questions, if analysts are acting as a human API for the rest of the company, or if your teams want analytics to live closer to code, notebooks, workflows, and applications, Tableau may start to feel like a control layer rather than an accelerator.
You should look more carefully at alternatives or embedded analytics approaches when:
Seat-based access discourages experimentation
Too many requests flow back to a few creators
Business users need more than static consumption but less than full BI craftsmanship
You want analytics to live inside products or operational workflows rather than a separate dashboard environment
This isn’t a case against Tableau. It’s a reminder that pricing models shape behavior. A per-seat, role-tiered system pushes companies toward deliberate scarcity around creation. Sometimes that’s smart. Sometimes it clashes with the way a modern startup learns.
If your company is trying to widen access to data without widening bottlenecks, that’s usually the moment to evaluate other patterns, including browser-native analytics, embedded experiences, or file-system and notebook-based approaches that treat collaboration differently from traditional BI.
Tableau Pricing Frequently Asked Questions
Can you buy Tableau Desktop by itself for business use
Not in the way most buyers expect. Tableau Desktop is included in the Creator license rather than offered as a separate low-cost business authoring product. That means Desktop sits inside the role-based licensing structure, not outside it.
What is the entry price for Tableau Desktop pricing
The direct entry point is $75 per user per month for a Creator license on Tableau Server Standard, billed annually, because that’s the tier that includes Tableau Desktop.
Is Tableau Public the same as Tableau Desktop
No. Tableau Public is the free route for public sharing, while paid Tableau Desktop capability for business use sits inside the Creator license. The practical distinction is privacy and production use. Public is not the same as private enterprise deployment.
Do most business users need Creator licenses
Usually no. Most business users fit Viewer or sometimes Explorer better. The risk is that companies underestimate how many people will eventually need more than passive consumption once analytics becomes part of everyday work.
Is Tableau Cloud cheaper than Tableau Server
Not necessarily in total cost terms. Cloud and Server change where the burden sits. Server can introduce more internal operational responsibility, while Cloud can reduce some of that platform ownership overhead.
Why does Tableau feel more expensive over time than at purchase
Because the quote shows software, while the lived cost includes governance, administration, support, training, and the way role-based licensing can create bottlenecks as more teams want analytical access.
If your team is outgrowing dashboard bottlenecks, Querio is worth a look. Querio puts AI coding agents directly on your data warehouse so teams can query, analyze, and build with custom Python notebooks and a file-based workflow, without forcing every analytics decision through a traditional BI seat model.

