Business Intelligence
What is Metabase and Who is it for? Detailed Guide
Open-source BI tool for nontechnical users and analysts—build no-code queries or SQL, create dashboards, set alerts, and embed analytics.
Metabase is an open-source business intelligence tool designed to make data analysis accessible to everyone, including non-technical users. It connects to databases like PostgreSQL, MySQL, and MongoDB, allowing users to create dashboards, charts, and reports without writing code. For advanced users, it includes a SQL editor for custom queries.
Key features include:
A no-code SQL query builder for quick data exploration.
An advanced SQL editor for detailed analysis.
Dynamic data visualizations and dashboards for tracking metrics.
Automated alerts and reporting to keep teams informed.
Flexible permissions to ensure data security.
Who uses it?
Analysts: Run complex queries and standardize metrics.
Executives: Monitor KPIs and receive automated updates.
Teams in industries like e-commerce and fintech: Analyze sales, customer behavior, and financial data.
Metabase simplifies decision-making by turning raw data into actionable insights, whether for tracking KPIs, embedding analytics, or scheduling reports. It supports multiple deployment options, making it suitable for organizations of all sizes.
Metabase tutorial: Everything you need to know in under 40min
What is Metabase?
Metabase is an open-source platform designed to transform your databases into dashboards, charts, and reports. It connects seamlessly with a variety of data sources - like PostgreSQL, MySQL, or MongoDB - and empowers users to explore their data without needing to write code. Essentially, it takes raw data and makes it easier to understand and act on.
Metabase caters to both non-technical users and data professionals. If you're not a coder, the visual query builder lets you point, click, and filter through your data. For advanced users, there's a SQL editor for crafting more complex queries. This dual functionality means teams across different departments - whether it's marketing analyzing campaign results or analysts diving into detailed datasets - can collaborate using the same tool.
The platform focuses on three main goals: asking questions and exploring data, visualizing results through charts and graphs, and sharing insights via dashboards. Whether you're tracking revenue trends, monitoring sign-ups, or studying customer behavior, Metabase helps surface the metrics that matter. You can drill down into specific data points and even embed analytics directly into your applications. Plus, Metabase extends its functionality with AI-driven tools, though it's worth comparing Metabase AI vs Querio to see which better handles natural language queries.
One standout feature is Metabot AI, which allows users to ask questions in plain English. This natural language capability makes it easy for anyone - from executives to support teams - to access insights without needing technical expertise.
Metabase also offers flexible deployment options, making it suitable for organizations of all sizes. Whether you're a small startup or a large enterprise, you can integrate Metabase in a way that aligns with your infrastructure and security needs.
Key Features of Metabase
Metabase Chart Types and Visualization Use Cases Comparison
Metabase is packed with tools designed to make business intelligence easier and more efficient. It caters to users of all skill levels, offering features that simplify data exploration and help teams make sense of their data.
No-Code Query Builder
Metabase’s visual query builder allows anyone to explore data without needing to write SQL. Just pick a table, choose the columns you want, apply filters, and summarize results - all through simple dropdown menus. This self-serve option means business teams can get answers to their basic questions without waiting for analysts.
SQL Editor for Advanced Users
For those who need more control, Metabase offers a powerful SQL editor. Analysts can write custom queries, perform complex joins, create subqueries, and use database-specific functions. The editor also includes syntax highlighting and allows users to save queries as templates, making it easier to conduct in-depth analyses.
Data Visualizations and Dashboards
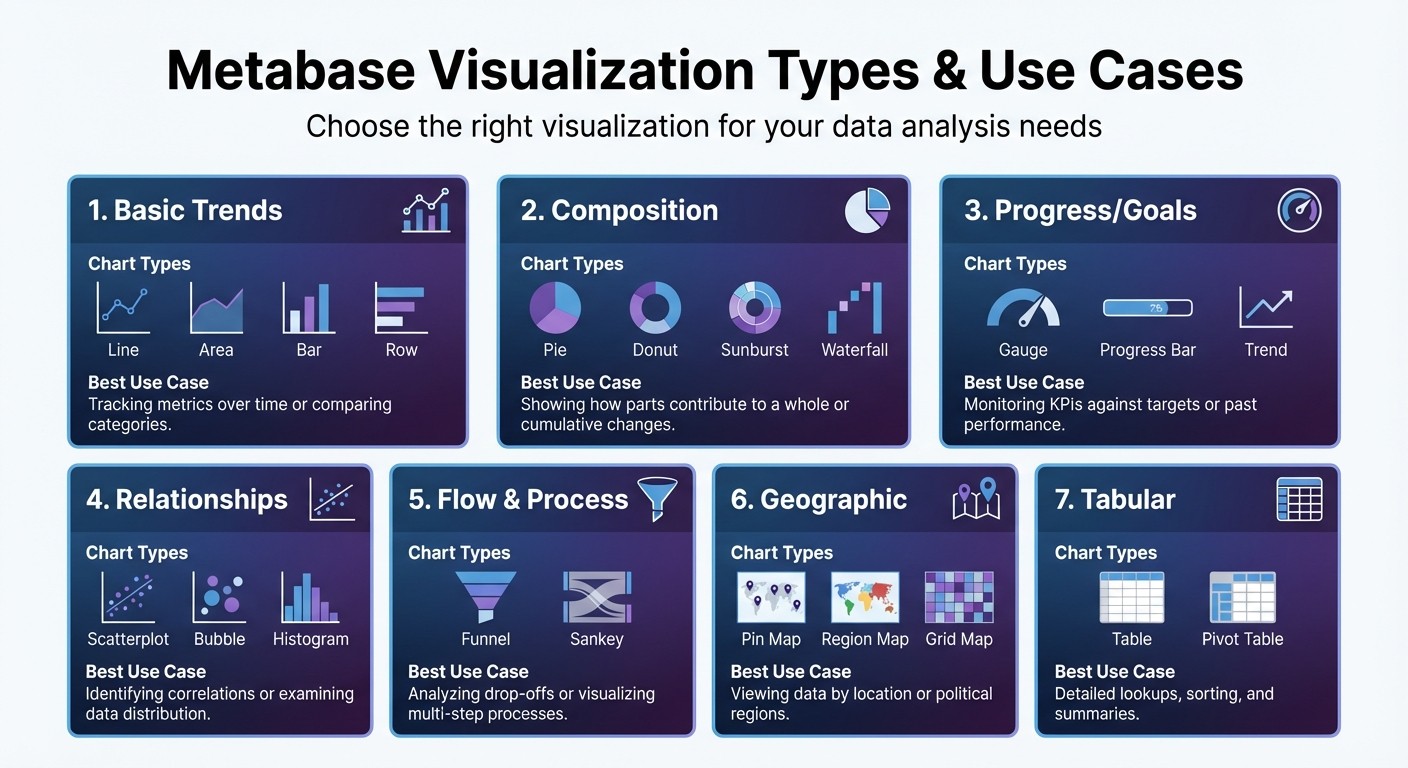
Metabase supports a variety of data visualization dashboards to help users present insights effectively. Whether it’s line charts for tracking trends, pie charts for illustrating proportions, or scatterplots for spotting correlations, there’s a visualization for nearly every need. Geographic data can be displayed on maps, while dashboards combine these visuals into a single, real-time view of key metrics.
Visualization Category | Specific Chart Types | Best Use Case |
|---|---|---|
Basic Trends | Line, Area, Bar, Row | Tracking metrics over time or comparing categories. |
Composition | Pie, Donut, Sunburst, Waterfall | Showing how parts contribute to a whole or cumulative changes. |
Progress/Goals | Gauge, Progress Bar, Trend | Monitoring KPIs against targets or past performance. |
Relationships | Scatterplot, Bubble, Histogram | Identifying correlations or examining data distribution. |
Flow & Process | Funnel, Sankey | Analyzing drop-offs or visualizing multi-step processes. |
Geographic | Pin Map, Region Map, Grid Map | Viewing data by location or political regions. |
Tabular | Table, Pivot Table | Detailed lookups, sorting, and summaries. |
Dashboards update automatically as new data comes in, keeping everyone on the same page without manual updates.
Automated Reporting and Alerts
Stop manually checking dashboards every day. Metabase lets you schedule reports to be sent directly to your email or Slack at regular intervals. Need to know when a key metric crosses a certain threshold? Alerts can notify you right away. This automation ensures decision-makers get the information they need, exactly when they need it.
Permission Management and Governance
Metabase also prioritizes data security with robust permission controls. Administrators can set access levels for databases, tables, and even specific rows or columns. For example, sales reps can be restricted to viewing data for their territories, while sensitive financial data remains accessible only to the finance team. This balance allows teams to access the data they need while keeping confidential information secure.
How Metabase Works
Metabase makes it easy to dive into your data by connecting databases, building queries, and sharing insights. It’s designed to be user-friendly, allowing people with varying technical skills to work efficiently. The platform simplifies decision-making by streamlining the entire process.
Connecting Data Sources
The first step is connecting Metabase to your database. Head to the Admin settings and navigate to the database section. Here, you’ll need to input basic connection details like the host address, port number, database name, and login credentials. Metabase supports a wide array of databases, including traditional options like PostgreSQL and MySQL, as well as cloud-based platforms like Snowflake, BigQuery, and Redshift. Once connected, Metabase scans your database structure, making tables and fields available for use within minutes. With this setup complete, you’re ready to start building queries and visualizing your data.
Building Queries and Visualizations
After setting up your data connection, Metabase offers tools to explore your data, though you might also compare Querio vs Metabase to see which interface better suits your team. You can use the visual builder for quick, straightforward queries or switch to the SQL editor for more advanced analysis. Once your query runs, transforming the results into visualizations is simple. Choose from options like line charts, bar graphs, or pie charts, and Metabase will instantly generate a visual representation of your data. This flexibility ensures both analysts and decision-makers can access the insights they need in a format that’s easy to understand.
Creating and Sharing Dashboards
Dashboards in Metabase bring all your insights together in one place. You can combine multiple visualizations into a single, real-time view and share these dashboards via email or Slack notifications with real data. To keep everything organized, Metabase lets you group related dashboards and queries into Collections, acting like folders for teams or projects. For teams that need more context, Metabase also offers Documents, where you can blend charts with explanatory text and enable asynchronous comments for collaborative discussions. This feature ensures everyone stays aligned and informed.
Who Uses Metabase?
Metabase attracts a diverse group of users within organizations, ranging from technical analysts to executives looking for quick, actionable insights. Its adaptable design allows different teams to interact with data in ways that suit their expertise and responsibilities. Here’s how analysts, executives, and specific industry teams put Metabase to work.
Analysts and Data Teams
For analysts, the SQL editor is a go-to tool for running complex queries involving CTEs, joins, and variables. They also create semantic Models to standardize metrics, which helps enforce data consistency and improve governance across the organization. This setup minimizes the flood of ad-hoc requests that often burden data teams. By configuring permissions properly and using the API to monitor usage analytics, these teams ensure data security, maintain compliance, and keep an eye on system performance - all without needing constant manual intervention.
Decision-Makers and Business Leaders
Executives and business leaders rely on the no-code visual query builder to track KPIs through interactive dashboards. They can set up automated alerts for critical changes, such as a drop in daily active users or unexpected revenue shifts. Features like Metabot AI and Querio Embedded offer intuitive insights, making it easier to share findings and collaborate with others. This shift toward conversational AI data analyst chatbots simplifies complex reporting for non-technical users. This self-sufficiency allows leaders to make faster decisions, while analysts can focus on more complex data challenges instead of routine reporting tasks.
Industry Examples: E-commerce and Fintech
E-commerce teams use Metabase to monitor monthly sales, track inventory levels, and analyze customer behavior. They can identify top-performing products and uncover retention trends directly within vendor dashboards. For example, one online retailer reported a 25% increase in conversions after leveraging Metabase to refine customer segmentation and personalize marketing campaigns [1].
Fintech companies, on the other hand, use the platform to analyze transaction data, detect patterns, and manage risk exposure. They create automated compliance reports and maintain real-time visibility into cash flow and profitability. This ensures they meet regulatory standards while making informed decisions about investments and overall financial health.
Use Cases for Metabase in Business Intelligence
Metabase's features make it a versatile tool for various business intelligence tasks, incorporating many essential features of modern business intelligence tools. From executive-level monitoring to embedding analytics into customer-facing applications, it helps teams streamline workflows and extract actionable insights.
Dashboards for Tracking KPIs
Having real-time insights is essential for teams that need to stay agile. Marketing teams use Metabase to monitor metrics like conversion rates, cost per acquisition, and campaign ROI across channels. Sales teams track pipeline velocity, deal closures, and regional revenue. Operations managers rely on it to watch inventory turnover, fulfillment times, and customer satisfaction scores, ensuring they can address bottlenecks early. Analysts can even use SQL-based calculations to measure advanced metrics like customer lifetime value or churn probability. This comprehensive tracking system allows teams to focus on metrics that directly influence business success. Additionally, Metabase can embed analytics directly into customer-facing applications for extended functionality.
Embedded Analytics for Applications
Metabase's embedding features allow businesses to integrate analytics into their own products, offering customers direct access to data insights. The implementation depends on the level of interactivity and technical needs:
Guest embedding: Provides view-only charts through signed URLs, requiring no authentication.
Full app embedding: Available on Pro and Enterprise plans, it supports advanced features like drill-through functionality, a query builder, and SSO authentication via JWT or SAML. This creates a complete analytics experience for the end user.
Modular SDK: Offers developers the ability to customize analytics at the component level using React and custom CSS, ensuring the analytics blend seamlessly with the product's design.
Feature | Guest Embedding | Full App Embedding | Modular SDK |
|---|---|---|---|
Plan Required | OSS / Starter / Pro | Pro / Enterprise | Pro / Enterprise |
Interactivity | View-only | Full (Drill-through, Query Builder) | Component-level control |
Authentication | None / Signed URLs | SSO (JWT/SAML) | SSO (JWT/SAML) |
Customization | Low (Basic styling) | Medium (URL parameters) | High (React/CSS) |
Scheduled Reporting and Alerts
Metabase also supports automated reporting, helping teams stay informed without constant dashboard checks. These features ensure timely updates and proactive responses:
Results alerts: Trigger notifications when specific conditions are met, such as error logs, negative reviews, or failed transactions.
Goal line alerts: Notify stakeholders when time-series metrics - like daily revenue or active users - cross predefined thresholds.
Progress bar alerts: Track progress toward numerical targets, such as achieving quarterly sales goals or project milestones.
Dashboard subscriptions: Deliver scheduled updates, like sending executives their weekly reports every Monday at 9:00 AM.
Alert Type | Best Use Case | Trigger Condition |
|---|---|---|
Results Alert | Monitoring for errors, bad reviews, or exceptions. | Triggers whenever the query returns any data. |
Goal Line Alert | Tracking KPIs like revenue or DAU. | Triggers when a time-series crosses a defined value. |
Progress Bar Alert | Monitoring progress toward a target. | Triggers when a value reaches or falls below a goal. |
Dashboard Subscription | Regular updates for teams and stakeholders. | Sent on a fixed schedule (e.g., every Monday at 9 AM). |
Conclusion
Metabase offers a powerful way for organizations to access and understand their data without requiring heavy engineering resources. Its design puts users first, making it easier for everyone - from data analysts to executives - to pull insights and act on them.
With self-service analytics, teams can reduce the number of one-off requests that often bog down data departments. Features like verified items and collections ensure that users can rely on accurate reports, while detailed permissions safeguard sensitive data at every level - whether it’s a table, row, or column.
From tracking real-time conversion rates to embedding self-service dashboards into apps or setting up automated alerts, Metabase works across a range of use cases. Teams can make data more accessible by highlighting key tables for non-technical users, adding context with annotated Models, and integrating dashboards with tools like CRMs. This approach simplifies workflows and supports quicker, smarter decisions throughout the organization.
Metabase transforms complex data into insights with its easy-to-use query tools, detailed reporting, and flexible deployment options. Whether you’re a startup looking for a fast setup or a larger company needing scalable data solutions, Metabase makes it possible to bridge the gap between technical expertise and business needs. Its features - like visual query builders and automated reporting - can help streamline your processes and enable more confident decision-making at every level.
FAQs
How long does Metabase take to set up?
Setting up Metabase can be a quick process or take a bit longer, depending on how complex your server setup is. For a straightforward installation, you can get everything up and running in just a few minutes after the software is installed. However, more intricate deployments might require additional time to configure properly.
Can Metabase handle row- or column-level data access?
Metabase offers robust tools for controlling data access at both the row and column levels. With its data permissions and segregation features, you can limit access to specific groups, ensuring that only authorized users can view particular rows or columns in your tables. This adds an extra layer of security and control over sensitive information.
What’s the difference between guest embedding and full app embedding?
The key distinction lies in how they function and integrate. Guest embedding allows external users to access specific dashboards or reports with restricted permissions, making it perfect for sharing data securely with stakeholders or customers. On the other hand, full app embedding incorporates the entire Metabase platform into your product, enabling comprehensive customization, user management, and interactive capabilities. While guest embedding is tailored for targeted, secure data sharing, full app embedding delivers a seamless, all-in-one analytics experience directly within your application.
Related Blog Posts


