Business Intelligence
self-service dashboards embedded
Embed self-service dashboards into your app to give teams live, governed analytics, reduce IT dependence, and speed data-driven decisions.
Accessing data shouldn’t be a hassle. Embedded self-service dashboards let users interact with live data directly within the tools they already use - no separate platforms, no delays. These dashboards empower teams to create custom reports, analyze metrics, and make decisions faster without relying on technical expertise or IT teams.
Querio simplifies this by connecting directly to data warehouses like Snowflake and BigQuery, ensuring real-time insights without duplicating data. With features like natural-language querying and drag-and-drop tools, users can easily visualize data. Meanwhile, robust governance ensures data accuracy and security.
Key Takeaways:
What it is: Dashboards integrated into existing apps for real-time data access.
Who it helps: Teams in sales, finance, marketing, and operations.
Why it matters: Faster decisions, reduced IT dependency, and lower costs.
How Querio helps: Secure connections, AI-driven queries, and consistent data governance.
Embedded dashboards are transforming how businesses approach analytics, making data accessible to everyone while maintaining control and security.
AI/BI Dashboards Embedding - A tutorial
What Are Embedded Self-Service Dashboards?
Embedded self-service dashboards are analytics tools integrated directly into existing applications. Instead of requiring users to log into a separate BI platform, these dashboards allow them to access live data and create custom reports right within their SaaS portal, fintech dashboard, or e-commerce admin panel. The "self-service" aspect means users without technical expertise can explore data, build visualizations, and find answers on their own - no need for SQL knowledge or waiting on analysts to handle requests. This concept highlights both the technology behind these dashboards and their impact on business operations.
Currently, 49% of organizations use embedded BI, and 68% of industry professionals consider it a key component of their operations. Gartner predicts that by 2025, 90% of corporate strategies will treat AI-powered analytics as a standard requirement. This shift reflects a growing trend: companies are moving away from tools designed solely for analysts and embracing platforms that make data accessible to everyone.
Embedded self-service dashboards differ significantly from traditional BI tools in three major ways. First, traditional BI tools often offer limited customization - modifying reports typically requires IT involvement. In contrast, embedded self-service platforms let users easily personalize dashboards and even white-label them to match their brand. Second, while traditional BI relies on legacy, server-based infrastructure, modern embedded analytics tools use cloud-native, container-based architectures for scalability. Finally, traditional setups can be expensive due to ongoing IT support needs, whereas self-service solutions significantly cut down on those resource demands.
How Embedded Dashboards Work
Embedded dashboards connect directly to your data warehouse - whether it’s Snowflake, BigQuery, Postgres, or another platform - pulling real-time data without creating duplicates. This ensures that users always interact with up-to-date information while avoiding the risks associated with copying sensitive data across systems.
At the core of these dashboards is a semantic layer, which acts as a bridge between complex raw data and the user interface. This layer translates technical data structures into familiar business terms. For example, instead of displaying "cust_acq_cost", the dashboard shows "Customer Acquisition Cost" with clear definitions and context. Data teams handle the setup for table joins, metric calculations, and business glossaries once, ensuring consistency across all queries and dashboards.
The user interface is designed for simplicity, featuring drag-and-drop tools that let users create charts without needing technical skills. Users can select dimensions and metrics from dropdown menus, apply filters, and choose visualization types with ease. Many modern platforms also include natural language querying, where users type plain-English questions like "What are our monthly sales by region?" and receive instant visualizations.
For SaaS applications, strict multi-tenant embedded analytics architecture is enforced through native SDKs (like JavaScript or .NET), ensuring that each customer only accesses their own data. This approach provides better performance and security compared to older iframe-based embedding methods.
How Querio Enables Self-Service Dashboards
Querio builds on this architecture to deliver a secure and user-friendly experience tailored to today’s business needs. By leveraging direct connections to data warehouses like Snowflake, BigQuery, and Postgres, Querio ensures your data stays within your warehouse. With SOC 2 Type II compliance and a 99.9% uptime SLA, Querio eliminates the risks of data duplication typically found in traditional BI systems.
One standout feature of Querio is its natural-language querying capability. Users can type questions such as "What’s our monthly recurring revenue by region?" and instantly receive accurate charts. Behind the scenes, Querio’s AI converts these questions into optimized SQL, runs the query on live data, and generates visualizations - all without requiring the user to write a single line of code.
For more advanced analysis, Querio includes AI Python notebooks. These notebooks allow analysts to perform complex calculations, statistical modeling, and custom data transformations, all while using the same governed data as the dashboards. This ensures that advanced users can dive deeper without compromising access controls or business context.
Querio also prioritizes consistency through its governance features. Data teams can define joins, metrics, and glossary terms in one place, and these definitions automatically apply to all user queries. This means everyone - from analysts to business users - works with the same definitions for metrics like "Customer Lifetime Value" or "Churn Rate", maintaining accuracy while empowering users to explore data independently.
Business Benefits of Embedded Dashboards
Adding self-service dashboards directly into your applications can revolutionize how teams work. Instead of reacting to delayed reports, teams can make proactive decisions using live data. By eliminating the need to wait for analysts or juggle multiple tools, organizations can boost efficiency and streamline decision-making across departments.
Faster Decision-Making with Real-Time Data
With real-time dashboards, data updates instantly as it enters your system. This means teams like Product, Finance, and BizOps can quickly identify trends and take action. For example, a product manager can track feature adoption during a launch without submitting a request, while Finance teams can monitor cash flow and revenue metrics throughout the month instead of waiting for end-of-quarter summaries. Access to up-to-the-minute data removes traditional reporting delays.
This kind of live data access brings teams into alignment. Marketing can tweak campaigns on the fly, Finance can track revenue in real time, and Customer Success can immediately spot and assist at-risk accounts.
Better Data Governance and Accuracy
Building a semantic layer ensures everyone in the organization uses consistent definitions for key metrics. For instance, when data teams define metrics like "Customer Acquisition Cost" or "Monthly Recurring Revenue" in Querio's governance layer, those definitions are applied universally across dashboards and queries. This eliminates discrepancies that arise when different departments calculate metrics in conflicting ways.
Having consistent definitions builds trust in the data and ensures accuracy. Additionally, features like row-level security and role-based access control mean users only see the data they are authorized to access. This keeps the organization compliant while empowering self-service.
Lower Costs and Resource Requirements
Self-service dashboards dramatically reduce the strain on analytics teams. With user-friendly tools, non-technical users can answer their own questions using natural language queries or drag-and-drop interfaces. This frees analysts from routine reporting tasks, allowing them to focus on advanced modeling, predictive analytics, and other high-value projects. This shift is part of how AI is transforming data analytics by automating routine tasks.
Building analytics solutions in-house requires significant resources for development, maintenance, and engineering. Embedded analytics solutions remove this burden by offering advanced tools without the need to grow technical teams. This approach helps organizations save on infrastructure and development costs while still delivering powerful data capabilities.
How to Implement Embedded Dashboards with Querio
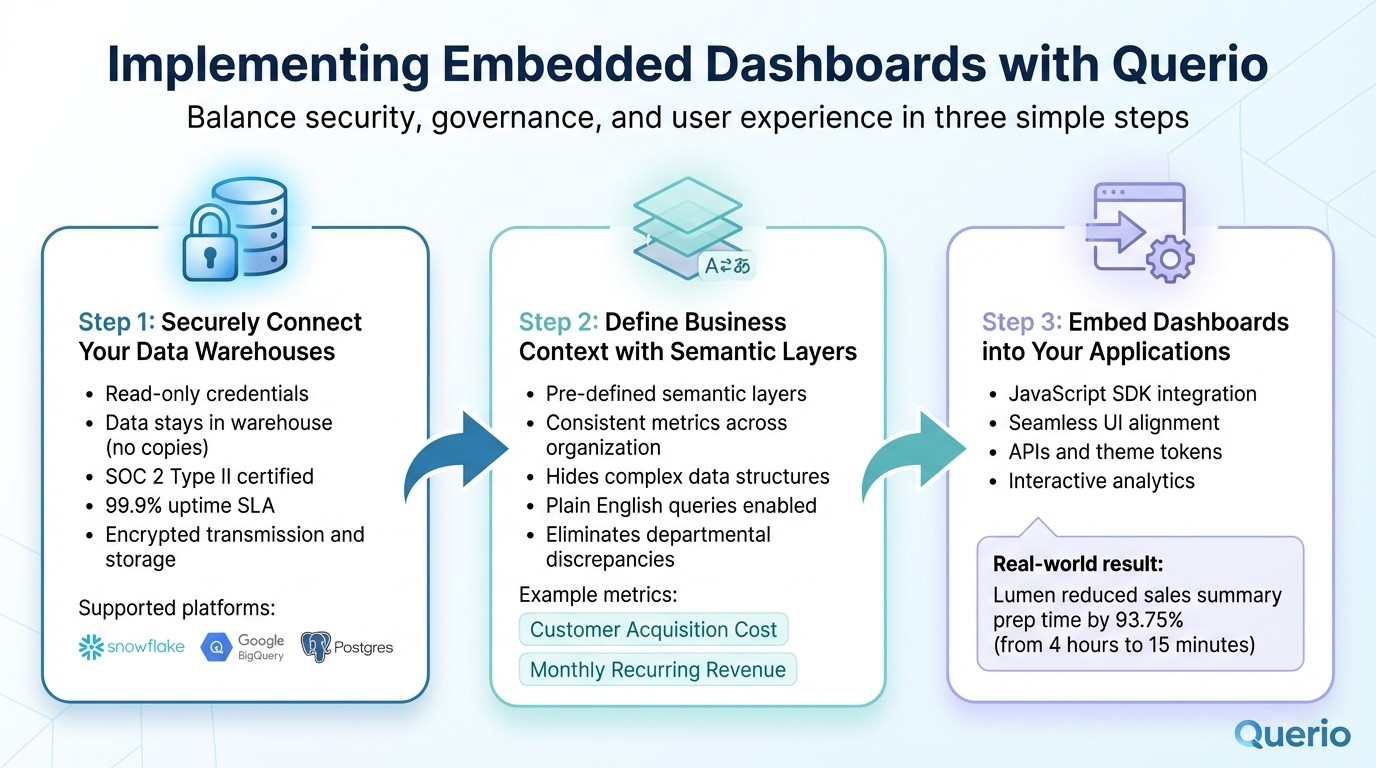
3-Step Implementation Process for Embedded Self-Service Dashboards
Adding self-service dashboards to your applications can be done in just three steps. These steps are designed to balance security, governance, and user experience, giving your users immediate access to live data while ensuring you maintain control over what they see and how they interact with it. Best of all, this process integrates smoothly with your existing data infrastructure, making the transition seamless.
Step 1: Securely Connect Your Data Warehouses
Querio connects directly to Snowflake, Google BigQuery, and Postgres using read-only credentials. This setup ensures your data stays in your warehouse - Querio queries it in place and delivers results without creating copies or exposing your data to risks like accidental modifications.
To establish this connection, you'll need to create a dedicated user account in your data warehouse with read-only permissions. Querio encrypts these credentials during both transmission and storage. This restriction at the database level prevents any write operations or unintended changes to your production data. For organizations with strict compliance needs, Querio is SOC 2 Type II certified and guarantees a 99.9% uptime SLA, ensuring your analytics remain secure and reliable.
Once your connection is secure, the next step is to define your data's business context.
Step 2: Define Business Context with Semantic Layers
After connecting your data, you can refine its business context by using Querio's semantic layers. These pre-defined layers allow you to enforce consistent metrics across your organization. For example, when you define metrics like "Customer Acquisition Cost" or "Monthly Recurring Revenue" in Querio, those definitions are automatically applied across all dashboards and queries.
This consistency eliminates discrepancies between departments. Your Finance and Marketing teams, for instance, will see the same numbers because they’re pulling from the same governed definitions. The semantic layer also simplifies the user experience by hiding complex data structures. Users can ask questions in plain English without worrying about table relationships or column locations.
Once your data is well-defined, embedding interactive dashboards becomes the final step.
Step 3: Embed Dashboards into Your Applications
With your data securely connected and governed, you can embed dashboards directly into your application using Querio's JavaScript SDK. This SDK enables you to seamlessly integrate interactive analytics into your app’s interface, aligning with your design system through APIs and theme tokens. Users can interact with, save, and share visualizations - all while maintaining the same security and governance standards.
For example, in 2024, Lumen reduced their sales summary preparation time by 93.75%, cutting it from 4 hours to just 15 minutes. By embedding Querio dashboards, their sales team could instantly access data within the tools they already used, eliminating workflow bottlenecks and improving efficiency.
Best Practices for Secure and Scalable Embedded Analytics
When embedding analytics, success is shaped by strong governance, real-time data access, and smart integration choices.
Data Governance and Role-Based Access Control
Row-Level Security (RLS) plays a critical role in limiting user access to only the data they’re authorized to see. With Querio, you can set up record- and column-level restrictions tailored to each user's role. For instance, a regional sales manager might only see performance data for their specific territory, while a finance executive can access company-wide metrics. This approach not only minimizes data exposure but also helps meet compliance standards like GDPR, HIPAA, and SOC 2.
For multi-tenant applications, strict controls are essential to prevent data from leaking between tenants. Industry research shows that prioritizing security from the start can help organizations achieve compliance certifications up to 60% faster compared to retrofitting security measures later[1].
Now, let’s look at how live queries can elevate dashboard performance.
Improving Performance with Live Queries
Speed matters. A slow dashboard risks losing users' interest, while real-time querying ensures they’re always working with the freshest data. This eliminates the need for outdated methods like CSV exports or manual data transfers, keeping information current and actionable.
Querio processes large datasets in seconds, even when users ask questions in plain English. This live querying capability ensures teams have up-to-the-minute insights - whether they’re reviewing yesterday’s sales or analyzing trends from the past quarter. With no stale data to worry about, users can make decisions faster and with greater confidence.
But speed isn’t the only factor - how dashboards are embedded also plays a big role in the overall experience.
Embedding Methods: iFrames vs. SDKs
The method you choose to embed dashboards impacts both performance and user experience. Here’s a quick comparison of iFrames and SDKs:
Factor | iFrames | SDKs (like Querio's JavaScript SDK) |
|---|---|---|
Loading Speed | Slower; loads separately | Faster; integrates directly |
Authentication | More complex; separate auth flow | Simpler; inherits your app's authentication |
Customization | Limited; constrained by iframe boundaries | Full control with pixel-level customization |
User Experience | Can feel disconnected | Seamless; feels native |
Performance | Additional overhead | Optimized with no extra layer |
Querio's JavaScript SDK allows you to fully integrate dashboards into your application. This means you can align the design with your app’s style, manage permissions using your existing authentication system, and provide a smooth, cohesive experience. Instead of feeling like an add-on, the dashboards become a natural extension of your product, enhancing both usability and performance.
Conclusion
Embedded self-service dashboards are changing how organizations interact with data. Instead of waiting days for technical teams to generate reports or answer queries, both employees and customers can now dive into data, create visualizations, and make informed decisions in just minutes. This shift from reactive reporting to proactive analysis eliminates bottlenecks and speeds up decision-making, fueling growth.
Querio offers a platform where non-technical users can easily ask questions and instantly view precise, visually appealing charts, all while data teams maintain strict oversight. This approach ensures data is accessible to everyone without compromising accuracy or governance.
But the benefits go beyond just speed. Companies using Querio’s embedded analytics save months of development time that would otherwise be spent building analytics tools from scratch. Support tickets for custom reports become a thing of the past, freeing product teams to focus on innovation. As David Abramson, CTO at Querio, explains:
"All of these helps you deliver not just quickly but also new modules and new opportunities to potentially generate additional revenue."
Querio’s powerful architecture takes these advantages even further. With live queries that process massive datasets in seconds and compliance features that streamline certifications, the platform turns analytics into a strategic asset rather than a cost burden.
The way forward is simple: embed analytics where users already work, empower them to find answers independently, and make data-driven decisions a core part of your organization’s culture. This approach tackles the delays and inefficiencies that have long hindered business progress.
FAQs
How do embedded self-service dashboards improve decision-making?
Embedded self-service dashboards give users the ability to access real-time insights and make decisions more quickly and effectively. These dashboards enable individuals to analyze data, spot trends, and react to changes on their own - without relying heavily on technical support teams.
When dashboards are integrated directly into applications or workflows, they help organizations create a data-focused approach to decision-making. This boosts efficiency while encouraging teams to think creatively and adapt swiftly, keeping businesses ahead in today’s fast-moving landscape.
How does Querio ensure data security and protection?
Querio takes data security seriously, implementing strong protections to safeguard your information at every stage. This includes encryption to secure data both when it's stored and while it's being transferred, role-based access control to restrict access according to user roles, and user authentication options like single sign-on (SSO) for added security.
On top of that, Querio offers data governance tools such as data lineage tracking and audit logs. These tools help uphold data accuracy and ensure compliance with industry standards, giving you confidence that your data is both secure and reliable.
How does Querio maintain consistent and accurate data for all users and teams?
Querio prioritizes reliable and consistent data by implementing role-based access control, advanced data governance tools, and real-time data synchronization. These tools ensure everyone across teams works from a unified, trustworthy source of information.
By minimizing the chances of data inconsistencies and offering secure, role-specific access, Querio enables organizations to make quicker, well-informed decisions grounded in accurate, current data.
Related Blog Posts


