Business Intelligence
Lightdash Review (2026): The dbt-Native BI Contender
Lightdash cuts metric sprawl by enforcing dbt-backed governance, but forces more modeling work and PRs for new questions.

Lightdash is a strong pick in 2026 if you already run on dbt and want governed self-serve BI from that model layer. If you do not have dbt set up well, the tool can feel slow to launch because every metric, join, and filter depends on that setup first.
Here’s the short version:
- Best for: analytics teams that already use dbt + Git + YAML
- Works well for: governed dashboards, shared metrics, and audit-friendly reporting
- Main limit: new business questions often need a dbt change and PR
- Security note: row-level access in Lightdash still depends on warehouse policy
- AI note: Lightdash AI stays tied to the governed model, but its reported BI Bench accuracy is 23.8%
- Best team fit: B2B SaaS, finance, and some healthcare teams with a strong analytics engineering workflow
What I see in this review is simple: Lightdash cuts metric sprawl, but it shifts more work into dbt upkeep. That tradeoff is fine if your team already treats dbt as the source of truth. It is less ideal if your users want open-ended self-serve without waiting on YAML edits.
Streamlining Governed BI with Lightdash and dbt: The Ideal Workflow
::: @iframe https://www.youtube.com/embed/6isCYO1CONk :::
Quick Comparison
| Area | Lightdash |
|---|---|
| Core strength | dbt-based metrics and governed Explores |
| Setup need | Working dbt project with clean models |
| Self-serve | Good, but limited to modeled fields |
| Dashboards | Solid for shared reporting |
| Permissions | Space controls + user attributes + warehouse rules |
| AI | Governed and inspectable, but accuracy is modest |
| Best fit | Teams that want control more than free-form analysis |
If you’re choosing between Lightdash and tools like Querio, ThoughtSpot, Hex, or Looker, the key question is not feature count. It’s how much modeling work your team is willing to do before users can answer new questions on their own.
How Lightdash works with dbt models, metrics, and semantic definitions
Connecting dbt to Lightdash in a warehouse workflow
Lightdash pulls in dbt artifacts like the manifest, model YAML, joins, tags, and metrics to build governed explores on top of your warehouse layer in Snowflake, BigQuery, Redshift, or Postgres. In practice, the warehouse is only part of the story. What matters more is whether the dbt layer stays up to date enough for Lightdash to rely on it.
Here’s the simple version: when models, joins, or metrics change in Git, Lightdash has to reflect those changes. Otherwise, the UI shows an old snapshot instead of the latest governed definitions. And that’s where teams can get tripped up. A clean warehouse setup doesn’t help much if the semantic logic shown to users is a step behind.
Metrics in YAML: strengths and overhead
Defining metrics in YAML gives teams one place for metric logic, which helps keep calculations consistent across reports and dashboards. That’s the upside.
The tradeoff is the work that comes with it. Naming, joins, descriptions, and tags all need steady attention. As the dbt project gets bigger, that YAML upkeep turns into regular data-team work, not a one-time setup.
Once ownership is settled, the next thing to check is pretty practical: does Lightdash carry that logic through as-is, or does it push teams toward duplicate metric definitions in another layer?
MetricFlow and semantic-layer boundaries to verify before rollout
"dbt-native" can mean a few different things, depending on where the metric definitions actually live. That’s why three boundaries need a close look before rollout:
- Where metrics are defined: in Lightdash's YAML layer, in the dbt semantic layer, or in MetricFlow and other semantic tools
- Which layer governs them: Git-based PRs control all three, but the owning definition determines what Lightdash surfaces
- How Lightdash queries them: Lightdash generates SQL against the warehouse via MetricFlow, so the path from definition to query must be mapped explicitly
Before rollout, make sure each metric has a clear home and a clear path into Lightdash. If the mapping across dbt, Lightdash, and MetricFlow is messy, teams usually end up with duplicate metric logic and conflicting numbers across tools.
And that only holds together if the governed layer still feels easy to use once people start digging in, saving charts, and sharing results.
Self-serve exploration, dashboards, and permissions in practice
From governed metric to saved chart: an end-to-end workflow
Business users can use Lightdash without pulling in an analyst every time. But there’s a catch: dbt needs to already define the metric, dimensions, and access rules.
When that setup is in place, the workflow is pretty smooth. A business user opens an Explore, picks approved measures, adds dimensions like region or date, applies a filter, and saves the chart to a shared space.
The slowdown shows up when someone wants to filter by a dimension that hasn’t been defined in dbt YAML yet. Then the data team has to update the model and push a PR before that filter becomes available. That’s the tradeoff with governance in self-service analytics: users get clean, approved fields, but new filters require a dbt change and a PR first.
That same governed setup carries over into dashboards.
Dashboards and collaboration for SaaS, healthcare, and finance reporting
Lightdash’s dashboard builder handles the core use cases well. Teams can arrange saved charts in shared spaces, and the same governed metric definitions flow into each dashboard. For SaaS and finance teams, that helps keep reporting lined up around the same numbers.
Healthcare gets a bit more tricky. Lightdash can support governed reporting for sensitive data, but visibility depends on how spaces, user attributes, and warehouse-level policies are configured. In plain English: access still comes back to warehouse policies.
Permissions, row-level controls, and sensitive data handling
Lightdash handles access at a few layers, mainly space permissions and user attributes for row-level filtering. So if you have a regional team, you can limit row visibility based on a user’s assigned territory. If you’re working with finance teams, you can restrict which Explores or dashboards people can even see based on role.
| Control Layer | Lightdash | Warehouse |
|---|---|---|
| Metric selection | Select metrics and dimensions in Explores | Data team defines metrics in dbt YAML |
| Filtering/drill-down | UI-based filtering by region, date, and other defined dimensions | Dimensions must be defined in dbt |
| Dashboard creation | Save charts to shared spaces | Admins set space permissions |
| Row-level security | Controlled via user attributes | Must align with warehouse-level policies |
For U.S. healthcare and finance teams, Lightdash is only as secure as the warehouse policy behind it. If warehouse access is broader than the Lightdash attribute rules, the warehouse decides the outcome.
Those same permission rules also shape how row-level security meets NLQ to ensure AI-assisted answers only return authorized data.
AI-assisted analysis, tradeoffs, and product fit
Testing AI against governed metrics and permissions
Lightdash AI runs on the same governed layer used for exploration, so model gaps show up in answers right away. Its answers come from YAML-defined metrics and dimensions in the dbt Semantic Layer, not from raw tables. You see Lightdash AI in Slack and in the dashboard builder, and the output stays tied to the dbt model.
For teams that care about audit trails, that’s a big plus. You can trace answers back to the model instead of treating the AI like a black box.
The flip side is pretty simple: Lightdash only performs as well as the dbt model under it. If the semantic layer has holes, the AI will have those same holes. Its BI Bench accuracy is 23.8%, which is a useful reminder that governed AI still leans on clean modeling.
| Feature | Lightdash AI Workflow |
|---|---|
| Grounding | Strictly tied to dbt Semantic Layer (YAML) |
| SQL Visibility | Fully inspectable in-product |
| Permission Model | Project and space permissions plus inherited warehouse access |
| Auditability | High |
| Accuracy (BI Bench) | 23.8% |
What the team must maintain after launch
That governance layer also means AI quality depends on the dbt model, not just the AI feature itself. Lightdash is not something you set up once and forget. Teams still need to keep a close eye on:
- Clean joins
- Consistent field names
- Aligned permissions
If those pieces are off, AI answers will reflect the same problems. And because Lightdash inherits warehouse access, role changes can shift what users can see. In practice, Lightdash depends on dbt tests, warehouse governance, and clear metric ownership.
Teams that fit Lightdash well and teams that do not
Lightdash fits best when a team already lives in dbt, is comfortable with Git and YAML, and wants governed, warehouse-native exploration. Analytics engineering teams at B2B SaaS companies using Snowflake or BigQuery tend to get the most from it. The PR-based governance model also works well for finance reporting, where auditability and change control matter.
The fit gets weaker when a team wants broad self-serve and less modeling work. In that setup, every new dimension or filter still needs a YAML change and a PR. Teams that aren’t ready to keep the dbt layer in shape over time will feel that friction fast. That tradeoff becomes clearer in the comparison that follows.
Comparison and verdict: Lightdash vs Querio, ThoughtSpot, Hex, and Looker
::: @figure 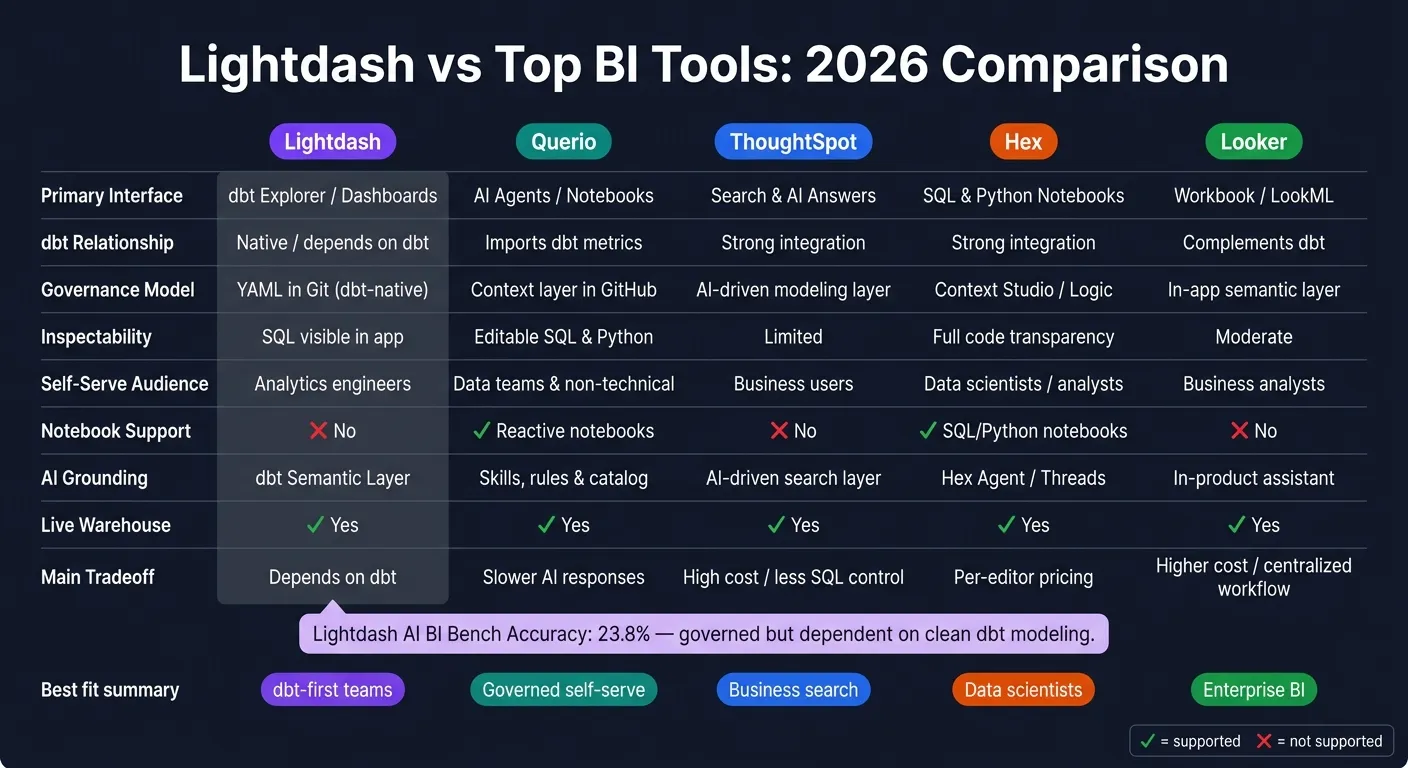 {Lightdash vs Querio vs ThoughtSpot vs Hex vs Looker: BI Tool Comparison 2026}
:::
{Lightdash vs Querio vs ThoughtSpot vs Hex vs Looker: BI Tool Comparison 2026}
:::
After testing Lightdash’s core workflows, the next step is simple: figure out which setup matches the way your team works.
Here’s how these tools stack up across dbt fit, governance, self-serve, and AI grounding.
| Dimension | Lightdash | Querio | ThoughtSpot | Hex | Looker |
|---|---|---|---|---|---|
| Primary Interface | dbt Explorer / Dashboards | AI Agents / Notebooks | Search & AI Answers | SQL & Python Notebooks | Workbook / LookML |
| dbt Relationship | Native to dbt / depends on dbt | Imports dbt metrics | Strong integration | Strong integration | Complements dbt |
| Governance Model | YAML in Git (dbt-native) | Context layer in GitHub | AI-driven modeling layer | Context Studio / Logic | In-app semantic layer |
| Inspectability | SQL visible in app | Editable SQL & Python | Limited | Full code transparency | Moderate |
| Self-Serve Audience | Analytics engineers | Data teams and non-technical users | Business users | Data scientists / analysts | Business analysts |
| Notebook Support | No | Reactive notebooks | No | SQL/Python notebooks | No |
| AI Grounding | dbt Semantic Layer | Skills, rules & catalog | AI-driven search layer | Hex Agent / Threads | In-product assistant |
| Live Warehouse | Yes | Yes | Yes | Yes | Yes |
| Main Tradeoff | Depends on dbt | Slower AI responses | High cost / less SQL control | Per-editor pricing | Higher cost / more centralized workflow |
Where Querio fits relative to Lightdash
Lightdash works well for teams that already run analytics through dbt. Querio makes more sense for teams that want governed self-serve analytics around a shared context layer without pushing every new question into YAML.
Querio’s context layer stores joins, metrics, and trusted queries as plain SQL, Markdown, and Python files, then syncs them to GitHub alongside the dbt project. That gives teams a governed way to support self-serve without making a YAML edit every time someone asks a new question. Its agent writes inspectable SQL and Python inside a reactive notebook, so analysts can check each answer line by line. Non-technical users can also ask questions in Slack, and each query inherits that user’s warehouse permissions through OAuth.
Lightdash has no reactive notebooks, and self-serve is limited to fields exposed in YAML [1]. Querio is the better match for ad hoc work, but there’s a catch: the team needs to keep the shared context layer up to date over time.
Final fit by team type
Use this summary to match the tool to your team’s working style.
Choose Lightdash when dbt is already the system your analytics team runs on, the team is fine working in Git and YAML, and strict metric control matters more than conversational analysis.
Pilot carefully if sensitive reporting or broad non-technical self-serve sits near the center of your rollout plan. Those are the areas that need the most checking before a wider launch.
Consider Querio when your team wants a context layer it owns in GitHub, editable SQL and Python behind every answer, and self-serve that reaches non-technical users without waiting for an analytics engineer to model each new field in dbt first [1].
FAQs
::: faq
How much dbt setup do we need first?
Lightdash needs a mature dbt project before it can do much.
That’s because Lightdash leans on your existing dbt models and YAML files as its semantic layer. So your metrics, dimensions, and relationships need to be defined there first.
If data hasn’t been modeled in dbt, it won’t show up in Lightdash. Put simply: you need to build and validate your core dbt models before rolling Lightdash out to non-technical users. :::
::: faq
Can business users answer new questions without PRs?
Usually not. In Lightdash, new questions still often need help from the data team because the semantic layer sits on top of dbt.
Business users can dig into approved content on their own. But metric definitions and dimensions are controlled in YAML and Git. So when a new need comes up, it usually means a pull request or a change in the dbt project to keep everything consistent. :::
::: faq
How secure is Lightdash for sensitive data?
Lightdash’s approach to sensitive data is only as strong as the controls in your dbt project and data warehouse. In plain English, Lightdash doesn’t open the floodgates. Self-serve analysis stays limited to what your dbt setup exposes, and access is handled at the project and space level. That means users can’t wander beyond approved content.
For row-level protection, the referenced guidance points to row-level security through Postgres policies on Pro plans and above. If you need tighter, enterprise-grade governance, that depends on two things: your Lightdash edition and the security setup in your warehouse. :::