Business Intelligence
How growth teams at SaaS startups use AI BI to run experiments without analytics support
SaaS growth teams use AI BI to run faster, consistent experiments without SQL or analyst support.
SaaS growth teams face a common challenge: waiting on analytics teams for data slows down experimentation. AI-powered business intelligence (AI BI) solves this by enabling non-technical teams to query data, analyze results, and make decisions independently - without needing SQL skills or analyst support.
Key takeaways:
Faster experiments: AI BI replaces the "request-and-wait" model with an "ask-and-iterate" approach.
Plain English queries: Teams can ask questions like, "What’s the trial-to-paid conversion rate last month vs. this month?" and get instant insights.
Consistency in metrics: Governed logic ensures everyone uses the same definitions for metrics like "activation rate", avoiding confusion.
Real-world impact: Companies like Fyxer have scaled experiments (541 in one year) and achieved massive ARR growth ($1M to $35M).
With tools like Querio, SaaS teams can run experiments faster, maintain data accuracy, and focus on growth - all without relying heavily on analytics teams.
Why SaaS Growth Teams Need AI BI for Experimentation
Common Blockers in Experimentation
Growth teams often struggle, not because they lack ideas, but because of how long it takes to get actionable data. Imagine this: a product manager notices a dip in activation and requests data. But by the time the analytics team delivers - sometimes a week or two later - the team has already shifted focus, losing momentum.
Three recurring issues tend to slow things down:
Delayed SQL turnaround: Analytics teams are often juggling multiple priorities, which means data requests take time.
Inconsistent metric definitions: One team's "active user" might not align with another team's definition, leading to confusion and delays.
Scattered reporting: Experiment results end up all over the place - spreadsheets, Slack threads, or random reports - making it hard to track progress over time.
These challenges mean growth teams can only run a limited number of experiments - maybe a few each quarter. That’s a big problem because roughly 75% of experiment ideas don’t pan out [1]. To find the 25% that actually drive growth, teams need to test a lot more. AI BI changes the game by making data access faster and keeping metrics consistent.
How AI BI Speeds Up Experimentation
AI BI removes these bottlenecks by giving teams direct access to live data - no SQL or tickets required. Instead of waiting on an analyst, a product manager can simply ask a question in plain English, like, "What’s the 30-day retention rate for users who completed onboarding in April versus March?" Within seconds, they get a real answer, powered by accurate SQL.
What makes AI BI stand out is its consistent logic. Key metrics like "activation rate" or "trial conversion" are defined once and applied across all queries. This eliminates debates over numbers and lets teams focus on action, building confidence in their results.
The impact of this approach can be huge. Take Fyxer, an AI email assistant startup. Using AI BI, they ran 541 experiments in a year with just a four-person team. The result? They grew their ARR from $1M to $35M in just 12 months [1][2]. Kameron Tanseli, Growth Engineering Lead at Fyxer, summed it up perfectly:
"A/B testing isn't just an optimization tool. It's a learning tool... it's the fastest way to develop the intuition you don't have yet." [1]
What Growth Teams Are Responsible For
Beyond running experiments, growth teams oversee the entire customer journey - from the first time someone hears about the product to when they become a loyal, paying user. This involves experimenting across key stages: acquisition, activation, conversion, retention, and monetization.
Each stage comes with its own set of questions and metrics, and growth teams need fast, reliable data to make decisions. Relying solely on analytics teams for every data request would slow them down. AI BI empowers growth teams to take control of their data needs while ensuring accuracy and consistency, enabling them to move quickly and confidently.
Latest Innovations in AI/BI Dashboards and Genie
AI BI Features That Support Independent Experimentation
The right features can turn a business intelligence tool from a flashy demo into a practical resource for growth teams. Three standout capabilities make independent experimentation achievable: natural-language querying with cohort analysis, automated code generation with governed logic, and live dashboards with scheduled reporting.
Natural-Language Querying and Cohort Analysis
Accessing data can be a major hurdle for non-technical growth teams. Natural-language querying removes this roadblock. Instead of needing SQL expertise or submitting data requests, a growth manager can simply type a question like, "Show me a funnel from signup to paid for U.S. users who came from paid search in April 2025," and get a visual answer instantly.
A semantic layer ensures consistency by mapping terms to predefined metrics, so every experiment or query uses the same standards. This unified approach means teams can work independently without worrying about conflicting data interpretations. In fact, Gartner predicts that by 2026, half of analytics queries by business users will rely on natural-language interfaces [4].
Cohort and funnel analysis works just as seamlessly. Teams can define cohorts conceptually - say, "users on a monthly plan who invited at least three teammates in their first 14 days" - and the tool converts this into precise filters. These defined cohorts can then be reused across multiple experiments, ensuring consistency and accuracy over time.
Automated Code Generation and Governed Logic
AI BI tools don't just simplify querying - they also instill confidence in the results. For instance, when Querio generates an answer, it provides fully inspectable SQL code. This transparency shows exactly how the query was constructed, including which tables were joined and which filters were applied. Growth teams can review and validate these outputs without waiting for technical support.
This level of clarity serves two purposes. First, it lets data teams audit outputs to catch any edge cases before they impact decisions. Second, it builds trust across the organization. When leadership sees that experiment results are tied to centrally governed metric definitions, they can rely on the data. Governed logic - where metrics like MRR, churn rate, and activation are defined once and applied consistently - eliminates debates over conflicting numbers, which often slow down decision-making. For example, ThoughtSpot reports that customers using self-serve AI BI have cut their ad-hoc reporting backlog by as much as 95% [3].
Dashboards and Scheduled Reporting
Once queries are simplified and outputs are trustworthy, monitoring experiment results should be effortless. Live dashboards, directly connected to your data warehouse, provide real-time access to key metrics like trial-to-paid conversion, activation rates, or average revenue per account. These dashboards can segment metrics by cohort, channel, or plan type, ensuring relevant insights are always available.
Scheduled reports make staying informed even easier. For instance, a weekly Slack summary might include plain-English updates like, "Variant B increased trial-to-paid conversion by 7.4% with 95% confidence." This keeps stakeholders informed without requiring them to log into yet another tool. Additionally, threshold-based alerts can notify teams immediately if critical metrics - such as churn in an experiment group - suddenly spike. This ensures all teams, no matter how distributed, remain aligned and ready to act without the need for manual reporting work.
How to Run Experiments Without an Analytics Team
How SaaS Growth Teams Run Experiments with AI BI (Step-by-Step)
Step-by-Step Experiment Workflow with AI BI
Running experiments effectively requires a clear process, especially when you don't have an analytics team to lean on. For SaaS growth teams, tools like AI BI streamline the workflow - from forming a hypothesis to analyzing results - without needing heavy technical support.
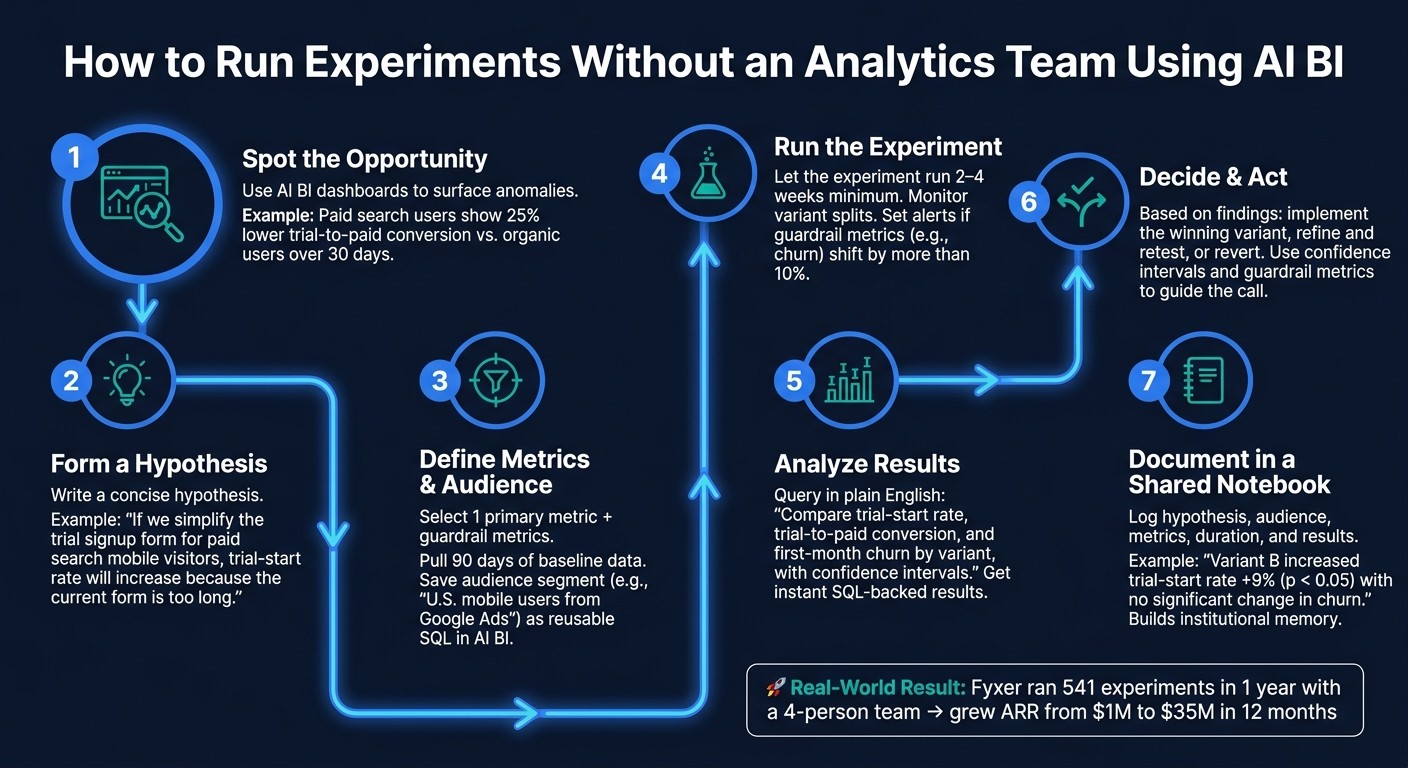
Start by spotting opportunities in your dashboards. For example, Querio might highlight that paid search users have a 25% lower trial-to-paid conversion rate compared to organic users over the past 30 days. That insight becomes your starting point.
Next, craft a concise hypothesis: "If we simplify the trial signup form for paid search visitors on mobile, then more of them will complete the sign-up process, as measured by the trial-start rate, because the current form is too long."
From there, select one primary metric and a few guardrail metrics. Use Querio to pull the last 90 days of data for these metrics, saving definitions alongside your audience segment (e.g., "U.S. mobile users from Google Ads reaching signup"). Querio transforms this into reusable SQL, making future queries easier.
Once the experiment is live, let it run for at least two to four weeks before drawing conclusions. During this time, monitor its health by checking actual user counts against your expected split. Set alerts to flag if guardrail metrics, like churn, shift by more than 10%. When the test wraps up, analyze results with a plain-English query like: "Compare trial-start rate, trial-to-paid conversion, and first-month churn by variant, with confidence intervals." Based on the findings, decide whether to implement the change, refine it, or revert to the original setup. Document everything in a shared notebook to avoid repeating similar experiments unnecessarily.
Finally, ensure your data is accurate and consistent to maintain reliable results.
Checking Data Readiness and Quality
Before trusting your experiment's results, verify the data's accuracy. Even without analytics expertise, growth teams can handle most of these checks directly in Querio.
Start with event volume sanity checks. Look at daily event volumes to identify any anomalies. Then, check data completeness by asking: "For users who started a trial, what percentage also have at least one session_started event?" If the percentage is unusually low, it could indicate integration issues that might distort your findings.
For experiment-specific checks, confirm that variant assignment is functioning as expected. For instance, query: "For experiment X in the last 7 days, show user counts and percentages by variant." If you planned for a 50/50 split but one variant is getting 65% of traffic, there's an issue with the assignment logic. Identifying this within the first 48 hours is much easier than explaining flawed results later.
To simplify this process, create a Data Readiness Checklist dashboard in Querio. This dashboard might include tiles for event volume, missing dimensions (like device type or traffic source), and the last schema change date. Growth teams can quickly review this dashboard before launching experiments and only escalate to engineering if something looks off. This approach allows non-technical teams to handle most readiness checks on their own.
Once your data is validated, focus on keeping your experiments consistent over time.
Keeping Experiments Consistent Over Time
The biggest challenge when running experiments without a dedicated analyst isn’t making a single mistake - it’s getting inconsistent answers to the same question over time. This often happens when metric definitions change, audience filters are adjusted, or date ranges differ slightly between queries.
The solution? Reusable, versioned logic. In Querio, once you define a metric like "trial-start rate" (e.g., users who fire trial_started divided by unique visitors to the signup page, using a 7-day first-touch window), that definition is saved in a shared context layer. Every future query referencing "trial-start rate" will automatically use the same calculation.
Pair this with experiment notebooks to document each test. A good notebook should include the hypothesis, audience definition, metrics, experiment duration, and a summary of the results. For example: "Variant B increased trial-start rate by +9% (p < 0.05) with no significant change in churn." These notebooks become invaluable over time, serving as a reference for new hires or when planning similar experiments in the future. For instance, you might note: "For paid search mobile traffic, always use short signup forms."
Governance and Accuracy in AI BI Workflows
For long-term success in self-service analytics, it's crucial to rely on trustworthy data. Without proper governance, growth teams can run into issues like conflicting numbers, broken dashboards, and decisions based on unreliable data. Governance provides the guardrails needed to maintain data integrity, allowing teams to operate quickly and confidently. With these practices in place, growth teams can independently run experiments without constantly questioning their results.
Governance Features That Keep Analytics Accurate
A semantic layer plays a key role in maintaining consistency. It connects business terms to SQL logic, ensuring that every query - whether written in plain English or embedded in a dashboard - uses the same definitions. For instance, in Querio, metrics like "active user" or "trial-start rate" are defined once and applied consistently across all teams, preventing discrepancies in how metrics are interpreted or calculated.
Other governance tools, like RBAC (role-based access control) and audit logs, further strengthen accuracy. RBAC ensures sensitive data, such as PII or revenue figures, is only accessible to authorized individuals. Meanwhile, audit logs provide transparency, making it easier to troubleshoot and maintain compliance. Additionally, versioned logic, stored in formats like YAML or JSON, ensures that a single source of truth is maintained across tools and experiments.
"No-code analytics is a governance design problem first, and an interface problem second." - Ambrus Pethes, Growth Expert, Mitzu [5]
Governance Feature | Purpose in AI BI | Impact on Accuracy |
|---|---|---|
Semantic Layer | Maps business terms to SQL logic | Prevents AI errors in understanding data joins |
RBAC / Permissions | Restricts data access by role | Protects sensitive information like PII |
Audit Logs | Tracks every query and access event | Ensures transparency for compliance and reviews |
Versioned Logic | Stores formulas in YAML/JSON | Maintains consistency across all tools |
By combining these governance features with clear role-sharing, teams can stay aligned on metric definitions and avoid confusion.
How Growth, Product, and Data Teams Can Share Ownership
When multiple teams manage their own analytics, "metric drift" becomes a common problem. For example, the growth team might define "conversion" differently than the product team, and these discrepancies often go unnoticed until a major review. Clear ownership is key to avoiding this.
In an effective system, the data team takes responsibility for the semantic layer, defining and versioning core metrics. Meanwhile, growth and product teams focus on asking the right questions and running experiments. With this setup, a growth manager using Querio can confidently ask, "What's the trial-to-paid conversion rate for mobile users this quarter?" knowing the answer is based on an approved, consistent formula.
Using Dashboards and Reports to Keep Teams Aligned
Governance doesn’t stop at technical controls - it extends into daily workflows through shared dashboards. Instead of creating separate views for each team, a unified experiment health dashboard can serve as a single source of truth. This dashboard might include variant splits, primary metrics, and guardrail metrics, making it an essential tool for standups and reviews. Scheduled reports can also deliver key summaries automatically, reducing the need for manual data pulls.
Over time, reusable analytics assets become a major advantage. For example, saving notebooks from past experiments allows new team members to review previous decisions, understand what’s already been tested, and avoid duplicating efforts. This kind of institutional memory turns isolated experiments into a continuous growth process, compounding value over time.
Conclusion: What AI BI Makes Possible for Growth Teams
AI BI changes the game for growth teams by turning long waits into quick learning opportunities. Instead of waiting a week to validate a hypothesis, a growth manager can simply type a question in plain English, get a reliable answer within minutes, and move directly to action. This faster turnaround - cutting days down to hours - means more experiments can be run each quarter, increasing the odds of finding strategies that work.
Speed is only part of the equation; dependable data is just as critical. When teams rely on the same metrics, the results are consistent and credible. This consistency is invaluable when sharing updates with leadership or comparing experiments conducted over time.
For early-stage SaaS companies in the U.S., especially those with small data teams, this self-reliance is a game-changer. While data teams focus on big-picture tasks like fundraising or building infrastructure, growth efforts don't have to slow down. Analysts can concentrate on advanced work, such as instrumentation and modeling, while growth teams independently handle analytics.
Querio is designed to make this shift possible. By connecting directly to your data warehouse, generating inspectable SQL, and enforcing shared business logic, it ensures every query, dashboard, and report is accurate and aligned. This setup enables self-serve analytics without sacrificing precision or control.
The teams that truly excel with AI BI see it as more than just a tool - they treat it as a workflow upgrade. By reusing query templates, standardizing dashboards, and building knowledge over time, they turn sporadic experiments into a continuous, agile growth process. This approach transforms how growth teams operate, making them faster, smarter, and more effective.
FAQs
What data is needed before running experiments with AI BI?
To effectively run experiments with AI BI, you'll need a few key elements in place. First, ensure you have live, up-to-date data from your sources - this is essential for accurate analysis. Next, establish standardized metrics and definitions to maintain consistency across your data. Finally, craft clear business questions in plain English. This helps the AI understand what you're looking for, enabling it to query and analyze the data effectively to deliver actionable insights.
How do we keep metrics consistent across teams in AI BI?
We maintain consistent metrics across teams in AI BI by implementing a governed semantic layer. This ensures uniformity in metric definitions, formulas, and data governance policies, allowing everyone to work with the same reliable data. By doing so, we reduce errors and improve overall efficiency.
How can we trust AI BI results without knowing SQL?
AI-powered BI platforms like Querio simplify data analysis by leveraging natural language processing (NLP) to transform plain English into precise queries - no SQL skills needed. They promote consistency through shared semantic layers, which help standardize metrics and definitions across the board. With automated governance and secure access controls, these platforms ensure data remains reliable and protected. Plus, real-time data connections empower users to confidently validate insights, all without needing technical know-how.
Related Blog Posts