Business Intelligence
How to do product analytics without a dedicated data analyst
Run funnels, retention, and feature analyses with 10–15 core events and AI self-serve tools—no SQL or dedicated analyst required.
You don’t need a data analyst to unlock actionable insights from your product data. Teams can now make faster, informed decisions using tools like Querio, which enable non-technical users to analyze data without SQL expertise.
Key Points to Get Started:
Understand Product Analytics: Focus on event tracking, funnels, retention, and user journeys to see how users interact with your product.
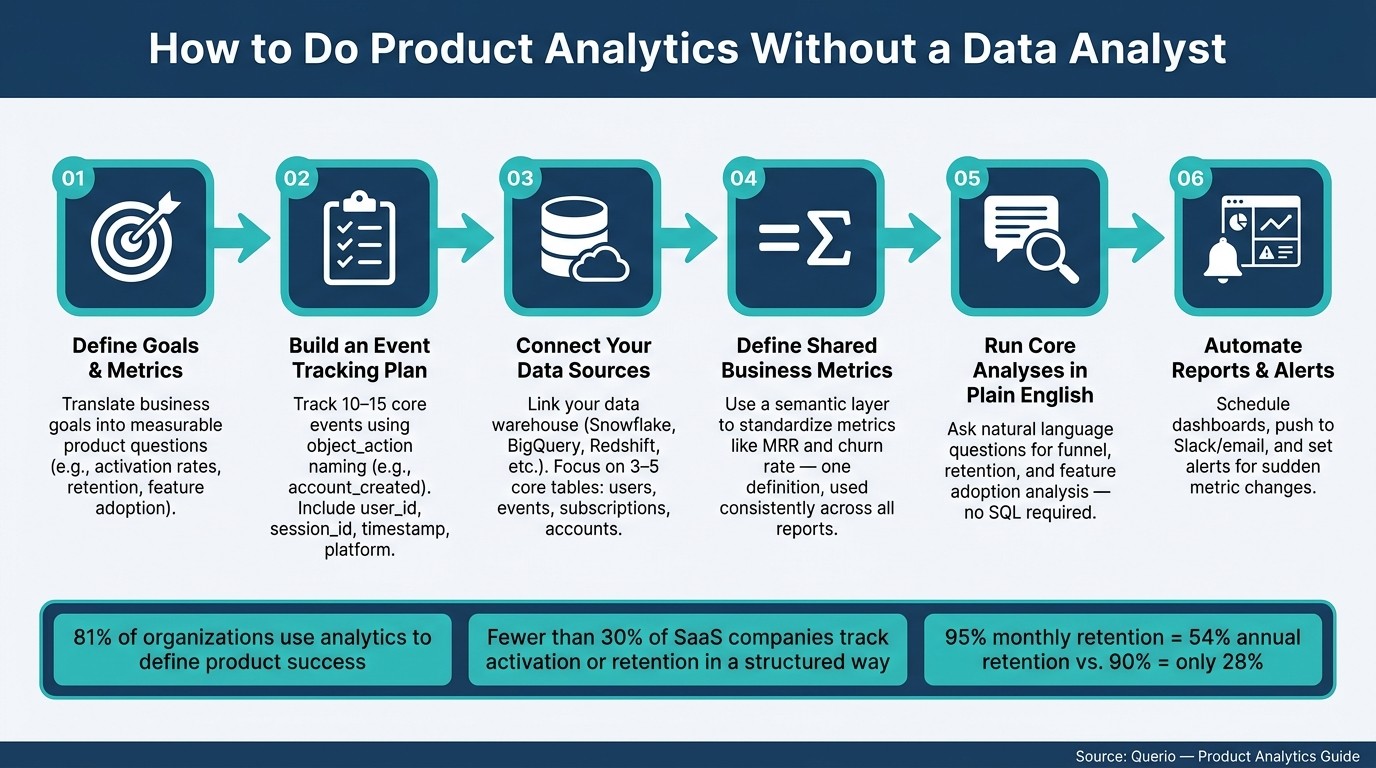
Define Goals & Metrics: Start with clear business goals and translate them into measurable product questions. Examples include activation rates, retention, and feature adoption metrics.
Streamline Event Tracking: Track 10–15 core events with a clear naming convention and attach relevant properties like
user_idandtimestamp.Use Self-Serve Tools Like Querio: Querio’s AI-driven interface allows plain English queries, connects directly to your data warehouse, and ensures consistent metric definitions.
Run Core Analyses Without SQL: Easily perform funnel, retention, and feature adoption analyses to identify drop-offs, track cohorts, and measure engagement trends.
Automate Reports & Alerts: Save time with automated dashboards and alerts for key metrics or sudden changes. You can also deliver instant customer insights by embedding AI-powered dashboards directly into your product.
Takeaway: With the right tools and a structured approach, product teams can independently access and analyze data, making decisions faster and more effectively.
How to Do Product Analytics Without a Data Analyst
Your 24/7 Data Expert: Query Data with AI (No SQL)
Define Goals, Metrics, and Events Before Picking Tools
Creating a strong analytics strategy starts with defining what success looks like. This step ensures your efforts are focused and actionable. Diving into tools or dashboards without a clear plan is a common misstep, especially for non-technical teams. The result? A pile of data that no one knows how to use. By clarifying your goals upfront, you set the stage for choosing the right tools and workflows down the line.
"If you track everything without knowing upfront the types of questions you want to be able to answer, you're going to end up with a lot of data and no idea of what to do with it." - Giustino, Donux [1]
Translate Business Goals Into Product Questions
It’s not enough to have broad goals - you need to turn them into specific, actionable questions tied to user behavior. For example, saying you want to “increase revenue” isn’t measurable on its own. But asking, "Which users who adopt three or more integrations upgrade from a $50/month plan to a $200/month plan within 90 days?" gives you something concrete to track and analyze.
A helpful approach is to work backward from your most successful users. Look at those who’ve been with you for 90+ days. What did they do in their first week that others didn’t? Identifying those shared behaviors can help you set activation benchmarks and define key product questions.
Pick the Right Metrics for Your Product
Not all metrics are equally useful. The goal is to focus on a small set that links user behavior directly to business outcomes. Here are four key metric categories to consider:
Metric Category | Example | Why It Matters |
|---|---|---|
Activation | % of sign-ups completing onboarding within 24 hours | Shows if users reach first value quickly |
Retention | Day 7 and Day 30 return rates | Indicates if your product keeps users coming back |
Feature Adoption | % of active users using a core feature monthly | Identifies which features drive engagement |
ARPU | Average revenue per user in USD | Links product usage to revenue growth |
To understand the stakes, consider this: a monthly retention rate of 95% leads to 54% annual retention, while a 90% rate drops it to just 28% [3]. That 5% difference compounds over time. Yet, fewer than 30% of SaaS companies track activation or retention metrics in a structured way [3]. Mastering this can give you a real edge.
Once you’ve defined your metrics, the next step is to create a targeted event tracking plan to ensure the data you collect is actionable.
Build an Event Tracking Plan
An event tracking plan is a roadmap connecting what you want to measure with specific user actions in your product. This document keeps your team aligned and ensures consistent data collection.
Instead of tracking everything, start with 10–15 core events. Trying to capture every click will only create noise, making the data harder to analyze. Use a clear naming convention like object_action - examples include account_created, report_exported, or member_invited [2]. For each event, document these four things:
Event name
The business goal it supports
The trigger (what the user does to fire it)
Key properties attached to it
"A tracking plan with 200 events that nobody maintains is less useful than 15 well-documented events that your team actively uses." - Donux [1]
At a minimum, every event should include: user_id, session_id, timestamp, and platform (web, iOS, or Android) [2]. These standard properties make it easier to segment data later without needing to overhaul your setup. Start simple, and track your core events systematically.
Set Up a Self-Serve Analytics Workflow with Querio
After your event tracking plan is ready, the next step is to create a workflow that allows your team to access data independently and immediately. With this setup, you can turn raw data into actionable insights - no need to rely on analysts for every query.
Connect Your Data Sources
To make your data accessible, start by integrating all critical data sources. Querio connects directly to your cloud warehouse using encrypted, read-only access. Supported platforms include Snowflake, Google BigQuery, Amazon Redshift, PostgreSQL, MySQL, MariaDB, Microsoft SQL Server, and ClickHouse. By skipping CSV exports, manual pulls, and complex ETL pipelines, you keep the process simple and efficient.
If you're using Snowflake, Querio's Partner Connect integration can reduce setup time dramatically - what might take hours can be done in just minutes. To ensure security and avoid disruptions to production workloads, it's best to create a dedicated service account with read-only access limited to your analytics schemas, such as ANALYTICS or PROD_ANALYTICS.
Start small by focusing on 3–5 core tables like users, events, subscriptions, and accounts. These tables provide the foundation for answering key product questions about activation, retention, and revenue.
Define Shared Business Metrics in Querio
One common challenge teams face is inconsistent metric definitions. For example, Marketing might report MRR as $120,000, while Finance says it’s $118,500. Both could be correct - they’re just using different calculations. Querio addresses this with its semantic layer (also called a context layer), which allows your team to define metrics once and use them consistently across all reports and dashboards.
Here’s how it works: link your core business entities - such as users, accounts, and subscriptions - to your data tables. Then, create clear metric definitions like MRR (calculated as the sum of the mrr field from active rows, aggregated monthly) or logo churn rate (canceled accounts divided by active accounts at the start of the month). These definitions become the single source of truth for your team.
To make the metrics even more accessible, add plain-English descriptions. For instance, "Monthly recurring revenue in USD from active subscriptions, excluding trials" helps everyone understand exactly what the number represents, building confidence in the data.
Ask Questions in Plain English
Once your metrics are standardized, enabling your entire team becomes much easier. Querio’s natural language interface lets anyone ask questions like "What is our weekly activation rate for new sign-ups over the last 90 days?" or "Which features are most used by Pro plan users?" and get answers backed by SQL generated automatically in the background.
Every response includes the SQL or Python code used, so team members like product managers or engineers can double-check the logic before taking action. To build trust in the system, create a set of "golden queries" to validate the AI’s outputs.
This streamlined workflow shows how Querio can turn raw data into meaningful insights - without the constant need for analyst intervention.
Run Core Product Analyses Without Writing SQL
With Querio's user-friendly interface, you can dive into analytics for product managers - like conversion, retention, and feature engagement - without needing to write a single line of SQL.
Funnel and Conversion Analysis
Funnel analysis helps you identify where users drop off as they move through key actions, such as signing up or making a purchase. For example, with Querio, you can simply ask, "What’s the conversion rate from sign-up to first purchase over the last 90 days?" and get a clear, actionable breakdown.
Want to dig deeper? Follow up with questions like, "Which step has the highest drop-off rate?" or "How does conversion differ between users from paid ads and those from organic search?" Start by analyzing your most critical user flow - usually onboarding or the primary purchase path - then expand to secondary flows for a broader view.
Cohort and Retention Analysis
Once you've identified conversion insights, it's time to explore retention. Cohort analysis groups users based on when they signed up, tracking how many return over time. This is a powerful way to gauge product-market fit. Using Querio, you can ask, "Show me weekly retention cohorts for users who signed up in Q1 2026," and instantly get a clear cohort table showing retention trends.
Comparing cohorts offers even deeper insights. For instance, if January’s retention rate is 42% and February’s jumps to 51%, that’s a clear sign of shifting user behavior - possibly due to a new feature, pricing change, or onboarding improvement. Querio also allows you to segment data by factors like acquisition channels or subscription plans for even more context.
Feature Adoption and Engagement
Understanding how users engage with specific features can shape your product decisions. For example, you can ask Querio, "What’s the daily usage count for our collaboration feature over the last 30 days, segmented by user plan?" This helps you see whether a feature appeals broadly or is more popular among specific user groups.
Segmenting further - say, by acquisition channel or plan type - can reveal patterns. If Enterprise users rely heavily on a feature that free-tier users barely touch, that might signal an opportunity to refine messaging or highlight upgrade incentives. Once you’ve honed in on key metrics, pin them to a shared Feature Adoption dashboard. This is a key step when you build analytics features that drive user value. This ensures your team stays aligned with real-time updates. You can even set alerts to flag drops in engagement for critical features, helping you address issues early before they impact retention.
Build a Long-Term Self-Serve Analytics Process
Extracting insights is one thing; maintaining them over time without relying on a dedicated analyst is a whole other challenge. Here's how you can establish a self-serve analytics process that stands the test of time.
Set Standards for Data Governance
The biggest roadblock to effective self-serve analytics isn't the tools - it's inconsistency. Imagine one team defining an "active user" as someone who logged in during the month, while another team defines it as someone who completed a specific action. The result? Confusing, unreliable reports.
To avoid this, start by agreeing on clear definitions for your key metrics - terms like Active User, Churned Account, or Monthly Revenue. Document these definitions in a central location, and use your existing context layer to ensure consistency across all reports. This way, any updates - like a new pricing model or a product tier - only need to be made once, rather than across multiple reports.
Also, standardize event names and maintain a consistent naming convention in your tracking plan. A little upfront effort here saves a lot of headaches down the road.
Tailor Workflows for Different Roles
Once your analytics setup is streamlined, the next step is to make sure each team member has access to the data they actually need. By 2025, it was estimated that 41% of companies would embed data analytics and AI into their product development processes [4]. This means more roles than ever will need direct access to data.
Align tools and data views with specific job responsibilities. Here's a simple framework to consider:
Role | Focus Areas | Training Format | Success Metrics |
|---|---|---|---|
Executives | Strategic dashboards, top KPIs | 30-minute guided sessions | Dashboard usage rates |
Managers | KPI tracking, basic filtering | Scenario-based simulations | Frequency of report creation |
Analysts | Advanced queries, data modeling | Hands-on workshops | Query performance improvements |
For example, Querio’s role-based access controls make this easier. A marketing manager can focus on metrics like acquisition and engagement, while a product manager zeroes in on feature adoption and retention. Everyone gets what they need - nothing more, nothing less.
Automate Reports and Alerts
Manual reporting? That’s a recipe for burnout. Automate your dashboards and alerts to ensure consistency and save time.
With Querio, you can turn plain-English queries into live dashboards, schedule them for email delivery, or push them to Slack channels where your team collaborates. Whether it’s a weekly retention update, daily active user count, or monthly revenue overview, these automated reports ensure your team always has the insights they need.
You can also set up alerts for critical changes, like a sudden drop in feature engagement. This allows your team to act quickly before small issues turn into big problems. Additionally, schedule a quarterly review of your context layer to ensure all metric definitions stay aligned with your business's current state. As your product evolves - whether through new pricing tiers or renamed features - this review keeps your reports accurate and actionable.
Conclusion: Give Your Team the Tools to Work With Data
Product analytics doesn’t require a dedicated analyst - it needs a strong foundation, the right tools, and a clear process.
Start by focusing on decisions, tying them to key metrics, and building your approach from there. Whether it’s funnel analysis or retention cohorts, the insights you need are available without requiring complex technical queries.
This is where Querio steps in. By connecting directly to your data warehouse and enabling plain English queries, Querio eliminates the bottleneck between your team and the data they need. With features like a unified context layer, automated reports, and customized access, your team can align metrics and automate insights, making data-driven decisions easier and faster.
The results speak for themselves. Today, 81% of organizations use analytics to define and measure product success[4]. AI-driven automation is projected to manage up to 80% of routine product management tasks[4]. The teams that succeed aren’t necessarily the ones with the biggest data departments - they’re the ones that embrace scalable, self-serve analytics.
With the right tools and governed metrics, your team can access the answers they need instantly, turning data-driven decision-making into a daily habit.
FAQs
How do I know which 10–15 events to track first?
To get started, align the events you track with your main business goals and the key actions your users take. Ask yourself questions like, "Where are users dropping off?" or "Which features are getting the most attention?". Then, pinpoint the related user actions - things like signups, clicks on specific features, or purchases.
Zero in on the most important points in the user journey, such as onboarding, using essential features, or completing conversions. This approach helps you build a focused, actionable tracking plan without drowning in unnecessary data.
How do I define “activation” and “active user” for my product?
Activation refers to the critical actions users take that demonstrate they're experiencing the main value of your product. This could include steps like completing onboarding or interacting with a key feature. Meanwhile, an active user is someone who engages with your product within a defined period, such as daily or weekly.
To measure user engagement effectively, it's essential to define these metrics around meaningful actions and relevant time frames that align with your product's purpose.
How can I verify the AI’s answers are correct?
To ensure the accuracy of the AI's responses, take the time to cross-check the information against reliable sources or any original references it provides. For instance, if the AI mentions particular tools or strategies, look up related articles or guides to verify the details. Make sure the information reflects the most current data and follows established best practices by consulting trustworthy materials directly.
Related Blog Posts


