Business Intelligence
How to Give Business Users Self-Service Analytics on Databricks
Govern data, standardize metrics, and use Databricks SQL plus scoped AI to deliver trusted self-service analytics.

If you want self-service analytics on Databricks, don’t start by giving business users raw data. Start by giving them governed data, fixed metric definitions, and a safe place to ask questions.
Here’s the short version: I’d set up Unity Catalog for access control, build gold tables and metric logic in dbt, use Databricks SQL for dashboards, and limit AI tools to approved datasets. Then I’d roll access out in 2–3 repeatable workflows first, not across the whole company at once.
That approach helps business teams answer common questions on their own while keeping numbers like SaaS metrics like MRR, ARR, and churn and win rate consistent across dashboards, notebooks, and AI answers.
What matters most:
- Governance first: Keep raw and intermediate tables out of reach for non-technical users.
- One metric definition: Define KPIs once so sales, finance, and support see the same number.
- Curated datasets only: Build dashboards from certified gold tables and metric views.
- AI with limits: Scope Genie or Querio to one business domain and approved data only.
- Phased rollout: Start small, track usage, and fix gaps before adding more teams.
A simple example: if even 5% to 10% of dashboard answers don’t match finance numbers, user trust can drop fast. That’s why the article’s main point is simple: self-service works only when the data layer is controlled before access expands.
If I were putting this in place, I’d think about it in four parts:
- Build a governed analytics layer
- Set up Databricks SQL for business reporting
- Add AI-assisted querying with guardrails
- Roll out permissions and adoption in stages
For teams comparing AI options, this is the plain-English split:
| Area | Databricks Genie | Querio |
|---|---|---|
| Best fit | Databricks-heavy teams with narrow domain scope | Teams that want live warehouse querying with inspectable logic |
| Data scope | Limited to the space you define | Shared context layer across metrics, joins, and terms |
| Answer review | Governed inside Genie spaces | SQL and Python are visible for each answer |
| Main use | Plain-English Q&A in Databricks | Plain-English analysis with reusable logic |
So the big idea is simple: business users should self-serve inside guardrails, not outside them. The rest of the article shows how I’d set up those guardrails in Databricks without making every question depend on an analyst.
::: @figure 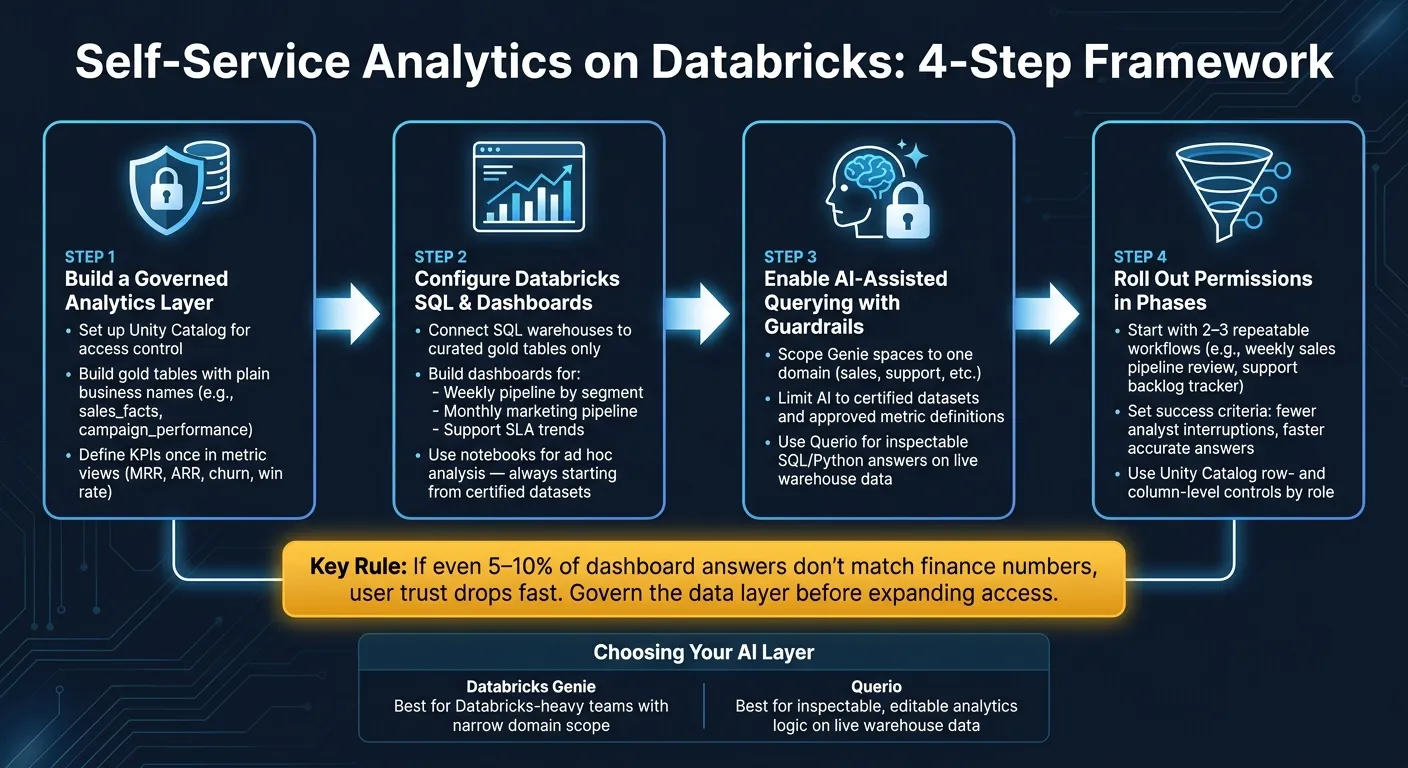 {How to Set Up Self-Service Analytics on Databricks: 4-Step Framework}
:::
{How to Set Up Self-Service Analytics on Databricks: 4-Step Framework}
:::
Analyst Roadmap to Databricks: From SQL to End-to-End BI
::: @iframe https://www.youtube.com/embed/yA7R6RNPsIo :::
Build a governed analytics layer before opening access
Self-serve business intelligence tends to fall apart when business users land on raw operational tables. They run into fields like evt_ts, acct_id, or rev_recog_flg, then one of two things happens: they guess, or they ping an analyst. Neither path builds trust. Before people can rely on Databricks SQL, dashboards, or AI-assisted queries, they need a business-ready layer that makes the data make sense.
Use Unity Catalog, gold tables, and metric views
Unity Catalog is where you set access and keep control over who can see what. Raw and intermediate data should stay behind the curtain. What business users should see are gold tables with plain business names like sales_facts, campaign_performance, and customer_support_tickets.
It also helps to define metrics once in metric views so sales, finance, and support all use the same logic. That way, a sales leader checking MRR and a finance analyst pulling that same number get the same answer. The math lives in one place, not in five slightly different dashboard formulas.
Model SaaS KPIs with dbt and clear business definitions
If you already use dbt, use it to build tested models in Databricks. For a B2B SaaS team, that usually means clear models for ARR, MRR, NRR, churn rate, pipeline coverage, win rate, CAC payback, and ticket backlog. Each one should have a plain-English definition in the dbt description field.
Names and grain matter more than people think. A model named fct_arr_monthly with a grain of one row per account per month is much harder to misuse than a vague revenue table. It tells people what they're looking at right away.
You should also add dbt tests like:
not_nulluniqueaccepted_values
Run those on key fields, and keep everything versioned in Git. Those certified models then become the source for dashboards and self-serve analysis.
Add a governed semantic context layer with Querio
Even with clean gold tables and dbt models, most business users still don't want to write SQL. That's where Querio comes in. Querio connects straight to your warehouse and lets you define joins, metrics, and business terms once. It then uses that same logic across AI-generated answers, dashboards, and notebooks.
One detail matters a lot here: every Querio answer shows the SQL or Python behind it. So if a sales manager asks "What's our NRR for Q2?" and the result looks off, an analyst can open the query, fix the definition in the shared context layer, and have that fix flow everywhere.
Querio also connects live to the warehouse, which means no CSV exports and no stale extracts. As products, pricing, or definitions like "active customer" shift over time, the context layer needs version control and review before those changes reach business users. Keep that layer versioned and reviewed as definitions change. Once it's set up, business users can query the same governed logic through Databricks SQL and dashboards.
Configure Databricks SQL and dashboards for non-technical users
Once your definitions are governed, the next step is simple: put them where business teams already work. That usually means Databricks SQL and dashboards. The goal is to turn curated models into reports that non-technical users can open, trust, and use without asking an analyst to step in.
Set up SQL warehouses for live business reporting
For live reporting, start with a SQL warehouse that fits your first dashboard workload. It should handle the reports that sales, marketing, and support need during the day, without paying for more capacity than you need.
As rollout begins, watch query patterns, refresh timing, and cost. That gives you a clear read on where things slow down and where money starts to leak. If a dashboard lags at 9:00 AM every day, you want to catch that early, not after users stop trusting it.
For scheduled reporting, keep the datasets underneath those dashboards stable. That helps repeat dashboard loads stay predictable. But speed alone isn't enough. The performance layer only matters if every dashboard points to the same trusted datasets.
Build dashboards from curated datasets, not raw tables
Dashboards should read only from approved gold tables or metric views. In plain English: business users should see only the datasets they need, and every report should have one clear source of truth behind it.
Good dashboard use cases include:
- Weekly pipeline by segment
- Monthly marketing-sourced pipeline
- Support SLA trends by team
Each dashboard should use the same tested dbt model or certified dataset as its source. That way, the numbers stay consistent whether someone opens the dashboard, exports the data, or asks the same question somewhere else.
Use notebooks for deeper analysis
Use dashboards for repeatable reporting. Use notebooks for investigation and metric debugging.
Notebooks make sense for analyst-led work like ad hoc cohort analysis, single-use forecasting, or debugging a metric that looks off. They're great when you need to poke around, test ideas, and figure out what's happening under the hood.
The big risk is metric drift. If a notebook calculates churn one way and the dbt model calculates it another way, you've suddenly got two versions of the truth. And that's where trust starts to crack.
To avoid that, analysts should begin with the same gold tables and metric definitions that power the dashboards. Keep notebook logic inspectable and reusable. If a piece of logic proves stable, move it back into dbt instead of letting a one-off calculation sit hidden in notebook cells.
sbb-itb-284a532
Enable AI-assisted querying without losing control
Once your dashboards and notebooks are governed, AI can sit on that same certified layer. That matters because AI-assisted querying works best when it uses governed data and approved metric definitions. If it pulls from raw tables, answers can drift fast and stop matching what the business trusts.
Create focused Genie spaces for specific business domains
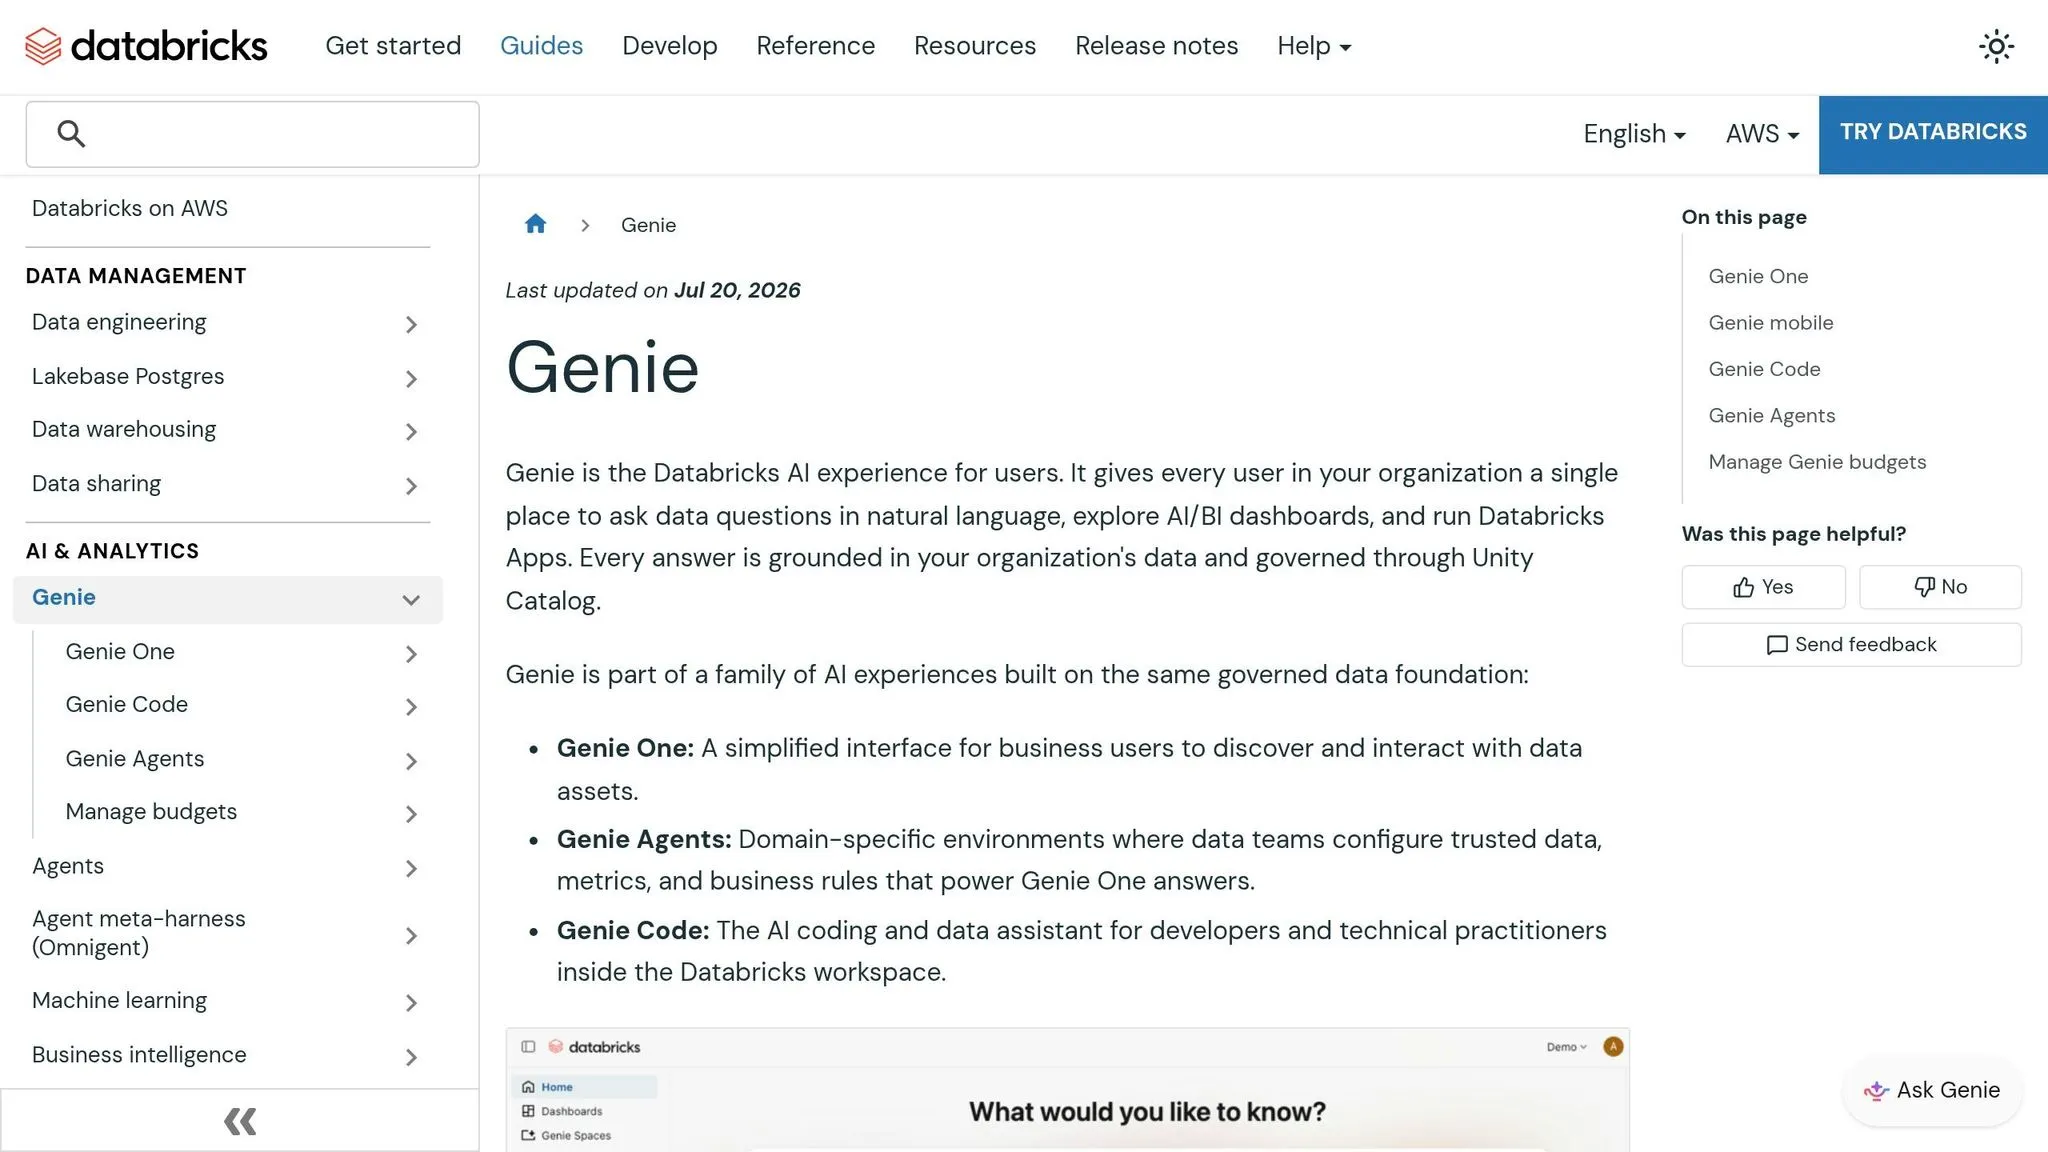
Set up each Genie space around one domain, like sales or support. That way, it only reasons over certified tables and approved terms.
Keep the space tight:
- Limit it to certified datasets
- Use only approved metric definitions
- Require the agent to stay inside that scope before answering
That guardrail helps keep answers in line with the numbers people already use.
Review and govern AI-generated answers before broad rollout
Start with a small pilot group. Compare AI-generated answers against trusted dashboard results, then tighten the scope or instructions before giving more teams access.
Keep the space limited to the certified datasets approved for that domain. If the AI starts from the same governed layer as your dashboards, you're much less likely to get mismatched results.
When Querio is the better layer for governed AI self-serve
If business users want plain-English querying on live warehouse data - and they need logic they can inspect - Querio can be a good fit here.
Querio connects straight to your warehouse, generates inspectable SQL and Python, and keeps logic governed through a shared context layer for joins, metrics, and business definitions. In practice, that gives you one governed layer for ad hoc analysis, notebooks, dashboards, and AI answers.
That means users can move faster without giving up the trusted metrics your team depends on.
Here’s a simple rule of thumb: if your team is already deep in Databricks and your domains are tightly scoped, Genie fits those Databricks-heavy use cases. If you need inspectable, editable analytics logic on live warehouse data, Querio is built for that workflow.
Use the comparison below to pick the right AI layer for a domain.
| Capability | Databricks AI/BI (Genie) | Querio |
|---|---|---|
| Governance | Best when scoped to a specific domain with approved datasets and permissions | Shared context layer for joins, metrics, and business definitions |
| Inspectability | Answers are governed within the space | Every answer is backed by inspectable SQL and Python |
| Data access | Native to Databricks | Live warehouse connection, no extracts or data duplication |
| User experience | Plain-English questions in a focused domain | Plain-English questions with reusable governed logic |
Roll out access, permissions, and adoption in phases
Set permissions, certification, and sensitive-data controls
With the governed layer in place, roll out access by role and workflow, not by dataset. Set up Unity Catalog permissions and row- and column-level controls so each team sees only the data and workflows they need.
For sensitive workflows, apply data-retention and audit-log controls that line up with your compliance policy. Also, label source-backed answers and AI-inferred answers clearly, so users can tell how much confidence to put in each result.
Start small. Scope access to one workflow first, then expand with care.
Start with 2–3 repeatable workflows before expanding
Once access is scoped, test a small set of predictable workflows before opening the model to more teams. Pick two or three repeatable use cases where the questions are easy to anticipate and the data is already well understood.
Good starting points include:
- A weekly sales pipeline review
- A customer support backlog tracker built with self-service dashboards built with Databricks SQL and certified datasets
Set success criteria before launch. Track fewer analyst interruptions and faster time to accurate answers for business users. After those workflows settle in, use usage logs and escalation patterns to spot gaps in the data model, tighten definitions, and approve changes before rolling out to the next team.
Conclusion: A clear blueprint for trusted self-service on Databricks
The rollout is pretty simple: scope access by role, validate 2–3 workflows, measure adoption, and expand with care. The goal is governed self-service, not raw-table access.
As you scale, Querio can help keep that experience governed with a shared semantic/context layer, which acts as a data interface for LLMs, inspectable SQL and Python, and live warehouse connections. That gives business users fast, reliable answers from the same governed logic analysts use.
FAQs
::: faq
How do we decide which workflows to roll out first?
Start with the metrics that spark the most debate across sales, finance, marketing, and product. Focus on 3 to 5 core KPIs like revenue or customer lifetime value, where mismatched definitions tend to create the most friction.
Then get stakeholders aligned on clear formulas and business logic. After that, test the semantic layer with a pilot group of 5 to 10 non-technical users. Their feedback can help you refine it before rolling it out more broadly. :::
::: faq
What should be in a certified gold dataset?
A certified gold dataset should include vetted, high-demand data assets that act as a reliable single source of truth for business decisions.
It should also include:
- standardized, documented metric definitions
- centralized join logic
- clear business term mappings
- role-based access controls
- a review process before certification
This setup helps cut down on metric drift and keeps dashboards and AI-driven insights consistent across teams. :::
::: faq
How do we keep AI answers aligned with finance metrics?
Make finance definitions your single source of truth inside a governed semantic or context layer. That means documenting metric logic, time windows, and edge-case rules in one place, so numbers like revenue and margin don't slowly drift across dashboards, reports, and teams.
Just as important, put that layer under version control and assign clear ownership. If a metric changes, finance should be able to see what changed, when it changed, and who approved it.
Then send AI-generated questions through that same layer. Pair it with warehouse-native, user-appropriate access controls, and keep all SQL and Python fully inspectable. That way, finance can check exactly how each answer was produced instead of taking the output on faith. :::