Business Intelligence
ChatGPT for Excel Data Analysis: 2026 Methods
Use ChatGPT file uploads for one-offs, Excel AI for in-sheet work, and warehouse analytics for governed reports.

If you use Excel in 2026, the main choice is simple: use ChatGPT file uploads for one-time reviews, Excel AI for formula and sheet work, and a warehouse tool for reports that must stay in sync and hold up under review.
I’d sum it up like this:
- Static file? Use ChatGPT with file upload.
- Working inside Excel? Use Excel-native AI.
- Need the same metric every week or month? Move it to the warehouse.
That matters because uploaded files are just snapshots. They do not stay connected to Snowflake, BigQuery, Redshift, or Postgres. And that’s where many teams run into trouble: the workbook answer looks fine, but the board deck, finance close, and warehouse query don’t match.
A few points stand out from the article:
- AI is now common for formula writing, data cleanup, chart summaries, and plain-English Q&A
- 95% of AI analyst tools now include natural-language Q&A
- 91% include chart creation
- But only 45% include a governed semantic layer, which is why metric drift is still a big issue
- Multi-tab files, messy workbook structure, and macro-heavy sheets still cause errors
::: @figure 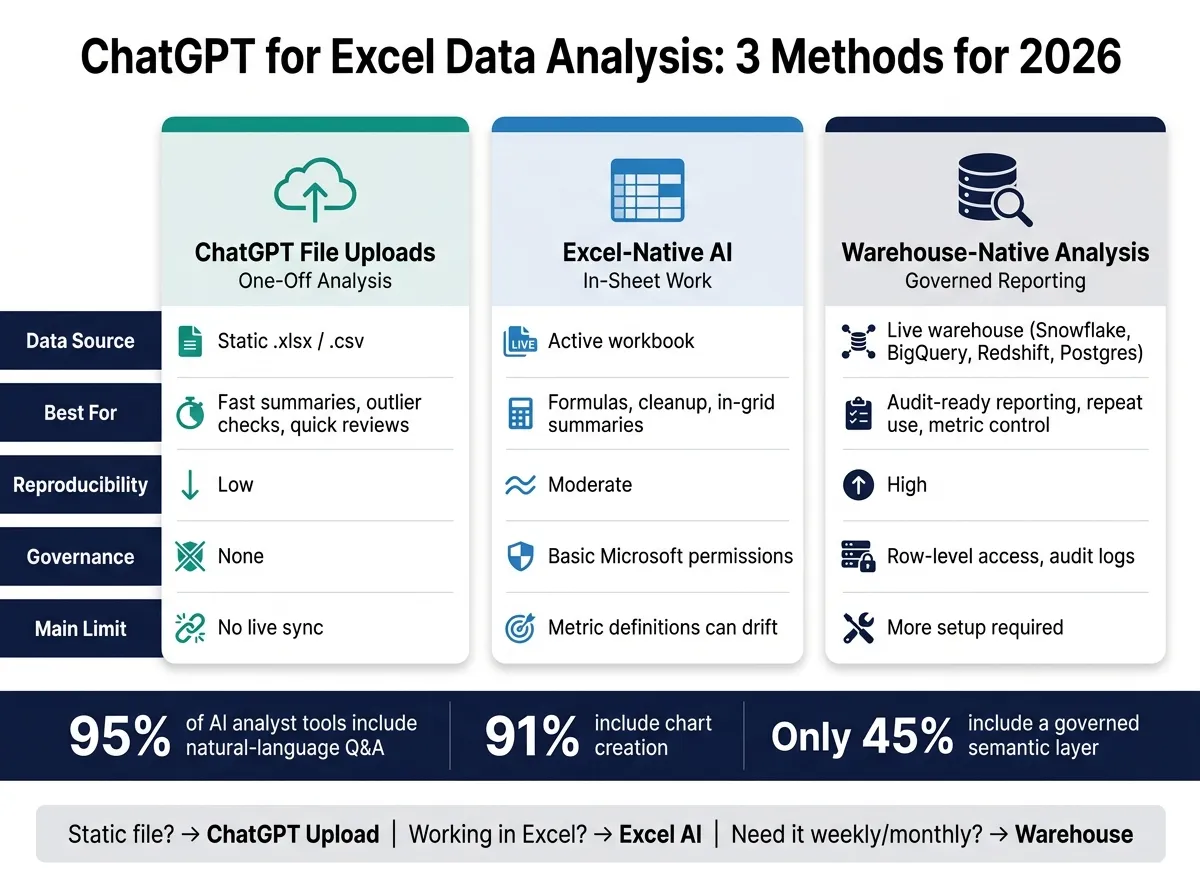 {ChatGPT vs Excel AI vs Warehouse Analytics: 2026 Comparison Guide}
:::
{ChatGPT vs Excel AI vs Warehouse Analytics: 2026 Comparison Guide}
:::
I Gave ChatGPT a Messy Excel File. Here's What Happened
::: @iframe https://www.youtube.com/embed/0PzmVXPdkuk :::
Quick Comparison
| Method | Best use | Data type | Good for | Main limit |
|---|---|---|---|---|
| ChatGPT file uploads | One-off analysis | Static .xlsx / .csv |
Fast summaries, outlier checks, quick review | No live sync |
| Excel-native AI | In-sheet work | Active workbook | Formulas, cleanup, in-grid summaries | Definitions can drift |
| Warehouse-native analysis | Reused reporting | Live warehouse data | Audit-ready reporting, repeat use, metric control | More setup |
My takeaway: Excel AI is fine for short-lived work. But once a number shows up in a weekly review, month-end close, or board deck, it should stop living only in a workbook.
That’s the lens for the rest of this piece: use best AI data analytics tools where they save time, but keep repeat-use metrics tied to live warehouse logic.
The 3 methods that matter most
Pick the method based on where your data lives: a static file, an active workbook, or a live warehouse.
ChatGPT file uploads with Advanced Data Analysis
Upload a .xlsx or .csv file to ChatGPT, and Advanced Data Analysis can use Python to clean data, group rows, join tabs, and flag outliers [1]. It’s a good fit for quick sales reviews, budget checks, or a fast outlier scan.
There’s one catch: the file is only a snapshot in time. It does not stay connected to Snowflake, Redshift, or any other live source [1]. So if the workbook needs to keep changing after the meeting, it makes more sense to shift that work into the workbook itself or into the warehouse.
Excel Copilot-style AI for formulas, summaries, and in-grid analysis
Excel-native AI workflows run inside the workbook. They can write and explain formulas, build PivotTable-style summaries, and explain formulas in the sheet [2]. If your team already works in Microsoft 365 all day, this usually feels like the easiest path.
It works best when the data is clean: one row per record, clear headers, and a table that’s easy to read. Where it starts to wobble is metric consistency. If ARR or NRR definitions need to stay the same across teams and files, Excel is a shaky place to manage that [3][5]. Use this route when Excel is the main workspace. Step outside Excel when metric definitions need tighter control.
Warehouse-native analysis when Excel should not be the source of truth
Sometimes the warning sign is simple: the same metric gives different answers depending on the file or the person using it. When that happens, Excel should stop being the source of truth. ARR and NRR need steady definitions that live somewhere more durable than a shared tab [3][5].
Querio connects live to Snowflake, BigQuery, Redshift, or Postgres, keeps metric definitions in version-controlled SQL, Markdown, and Python, and makes every query inspectable [3][5]. That setup is a better fit for repeatable business reporting, like board decks, weekly revenue reviews, and finance closes.
Seen side by side, these three methods come down to a simple tradeoff: speed, in-grid convenience, and governed reporting.
| Method | Best for | Data source | Metric control |
|---|---|---|---|
| ChatGPT file uploads | One-off exploration | Static .xlsx / .csv |
None |
| Excel Copilot-style AI | Daily in-grid tasks | Active workbook | Basic |
| Warehouse-native (Querio) | Repeatable reporting | Live warehouse | Full (semantic layer, dbt, GitHub) |
The next section shows which method fits cleaning, summaries, anomaly checks, and workbook Q&A.
How each method handles real Excel analysis tasks
Cleaning messy tabs and writing formulas
This is where the differences show up in day-to-day workbook work.
Excel-native AI is the best fit for quick cleanup inside a sheet. You can use plain-English prompts to fix dates, phone numbers, currencies, and duplicates without leaving Excel. It can also draft XLOOKUP, SUMIFS, and dynamic-array formulas from a simple request.
Still, don’t trust a generated formula just because Excel accepts it. Test it on rows where you already know the right answer. A formula can be syntactically correct and still pull from the wrong column.
If the file includes PHI or PII, mask it before upload, or keep the work inside Excel.
For a one-off workbook, that may be all you need. But if the same logic has to run every week, move it into governed reporting. Clean rows help, sure - but only if they feed a summary, model, or report you can rely on.
Building pivot-style summaries and reading charts
Once the data is clean, the next step is turning it into a summary that people can scan fast.
For a one-off summary - say, revenue by region from a Q3 sales export - file uploads are the fastest route. ChatGPT can return a summary table or a quick visual from the file.
Use Excel-native AI when the summary needs to stay in the workbook. It can suggest layouts and generate recurring in-grid reports, like budget-to-actual by cost center. But there’s a catch: if the metric definition lives somewhere else, spreadsheet summaries can drift.
For board decks, weekly revenue reviews, or month-end close, warehouse-native analysis is the safer pick. Querio connects live to Snowflake, BigQuery, Redshift, or Postgres and runs the summary against current data, with metric definitions stored in a governed context layer. That way, the number in the deck matches the number in the close.
And once the summary is on the page, the next question hits fast: does the pattern actually make sense?
Spotting anomalies and asking workbook questions in plain English
This is the hard part. Cleanup is one thing. Summaries are manageable. Explaining why a number changed is where things get serious.
Questions like "Why did West region revenue drop after 07/01/2026?" or "Which budget lines drove the $125,000 variance?" are where the method choice matters most. File uploads can help spot simple outliers in a static export before a meeting. What they can’t do is tell you whether the change is real, whether the data is stale, or whether the metric was defined differently.
For root-cause work that needs to stand up in a finance audit or an ops postmortem, you need logic you can inspect. Querio writes real SQL and Python for every answer in an inspectable notebook, so you can open the query, check the filter, and confirm the join before the number goes into a report. That traceability makes the answer reviewable before it reaches a report, which is why reproducible anomaly investigation belongs in governed warehouse analytics, not a spreadsheet prompt.
Ad hoc analysis vs. repeatable reporting: which setup fits each
The right setup comes down to a simple split: is the answer one and done, used again and again, or tied to review and audit? That’s the real decision point. Not what the tool can do, but whether the number should stay in a workbook or move into governed reporting.
| Dimension | ChatGPT file uploads with Advanced Data Analysis | Excel-native AI | Querio |
|---|---|---|---|
| Data source | Static CSV/XLSX uploads | In-grid Excel data | Live warehouse (Snowflake, BigQuery, Redshift, Postgres) |
| Best use case | One-off exploratory analysis | Formula drafting, quick cleanup | Repeatable, governed reporting |
| Reproducibility | Low - results live only in the chat thread [1] | Moderate - saved in the workbook | High - warehouse-backed SQL and Python in inspectable notebooks |
| Governance | None | Basic Microsoft permissions | Row-level access, audit logs |
When a spreadsheet prompt is enough
This route works when the question is temporary and the file won’t turn into a shared report.
Say you get a Q3 sales export and need to figure out what’s inside before a meeting. No one needs to rerun the same answer next month. In that case, ChatGPT file uploads with Advanced Data Analysis is a good fit: upload the file, ask the question, and get an answer in under a minute.
Excel-native AI works in much the same way. It’s useful for drafting a SUMIFS formula, cleaning up a vendor list, or putting together a quick budget-to-actual layout for a single review cycle. Think small static file, one user, and no refresh.
When to move the workflow into governed analytics
Move beyond spreadsheet prompting when the same metric gets reused, questioned, or checked. The clearest sign is when two people ask the same question and land on different numbers.
That usually isn’t a raw data issue. It’s a definitions issue.
If “revenue” means one thing in a sales export and something else in a finance model, spreadsheet cleanup won’t solve it. You’re not fixing a typo at that point. You’re dealing with mismatched logic.
A few other signs show up fast:
- An analyst gets the same Slack question every Monday morning
- A metric in a board deck is recalculated from scratch every month
- The workflow depends on joining live tables in Snowflake or BigQuery that a CSV export can’t fully represent
Querio connects live to the warehouse, stores metric definitions in a context layer synced to the same GitHub repo as your dbt project, and writes real SQL for every answer. That means the number in the board deck and the number finance uses at close stay aligned, and anyone can trace how it was produced.
Only 45% of AI data analyst tools offer a governed semantic layer [4]. That helps explain why metric disputes still show up on teams already using AI tooling. Use governed analytics when the same number needs to be reused, audited, and traced back to live warehouse logic.
Conclusion: the 2026 playbook for data teams using ChatGPT with Excel
After you’ve cleaned tabs, written formulas, summed up the data, and checked for anomalies, the main decision is simple: where should the answer live?
In 2026, ChatGPT for Excel analysis breaks into three clear jobs:
- One-off file uploads for ad hoc work
- Excel-native AI for in-sheet tasks
- Warehouse-native analysis for governed reporting
That rule of thumb explains why one-off uploads and recurring reporting should sit in different systems. Use the tool that fits how long the answer needs to last. A one-time upload can be handy for a meeting, but it shouldn’t be the source for recurring board metrics.
There’s also a clear signal for when it’s time to move past spreadsheet prompting: the same question starts returning different numbers. When two people get different answers, the issue usually isn’t the prompt. It’s the definition. That’s where governed analytics comes in, especially when the same metric shows up across teams again and again.
For data teams working in Snowflake, BigQuery, Redshift, or Postgres, ChatGPT and Excel-native AI make sense for temporary work. But repeatable reporting belongs in a governed layer with live warehouse connections and inspectable SQL.
The more reusable the workflow, the less it belongs inside the workbook.
FAQs
::: faq
When should I stop using a spreadsheet as the source of truth?
Move away from a spreadsheet as your source of truth when you need recurring reports, joins across multiple tables, or high-stakes metrics that need audited consistency.
Spreadsheets start to break down when your data pushes past file limits, needs daily refreshes, or relies on multi-step logic that formulas and manual work can’t hold together without mistakes. In those cases, a warehouse-connected platform like Querio gives you a governed semantic layer, so teams can use the same metric definitions every time. :::
::: faq
What kinds of Excel files cause the most AI errors?
Files with structural problems cause the most AI analysis errors. The biggest trouble spots are merged cells, blank rows, repeated header rows, mixed data types, and column names that don’t say much. Files with multiple header rows sitting below empty lines can also throw off the schema.
To cut down on errors, turn the data into a structured Excel table, give each column a unique, non-blank header, and do some basic cleanup before you upload the file. :::
::: faq
How do I keep recurring metrics consistent across Excel and my warehouse?
Use a governed semantic layer instead of static CSV uploads. ChatGPT on exported files can drift because those snapshots don’t carry shared definitions or a live connection to the warehouse.
The setup that tends to work best combines natural-language querying with a centralized semantic layer. That way, metrics like revenue or churn rate are calculated the same way for everyone.
If you still want Excel-like flexibility, use live warehouse connections and SQL you can inspect. You get room to explore without losing consistency. :::