Business Intelligence
CamelAI vs Julius AI: Chat-Based Analysis Tools Compared
Compare CamelAI and Julius AI on accuracy, calculation visibility, workflow friction, privacy, and cost for file vs warehouse analysis.

I’d shortlist Julius AI for uploaded-file analysis and consider CamelAI for live warehouse work - but neither recommendation is backed by measured results here. Before choosing, check your data connection and compare each tool’s calculations with independent SQL or Python.
I focus on five things: accuracy, calculation visibility, workflow friction, privacy, and cost. The proposed tests use 12 months of sales data, from October 1, 2025, through September 30, 2026, to check monthly trends and explain the August-to-September revenue change.
Quick Comparison
| Criterion | CamelAI | Julius AI |
|---|---|---|
| Suggested workflow | Live warehouse analysis, if connectors are confirmed | Ad hoc uploaded-file analysis, if inputs are supported |
| Calculation review | Not confirmed | Editable Python and R code |
| Accuracy and workflow | No measured results supplied | No measured results supplied |
| Pricing | Prices and limits not confirmed | Credit- and RAM-based pricing described; prices not confirmed |
| Privacy and team controls | Terms and controls need review | Terms need review; shared metric definitions described as lacking |
My rule: don’t choose on chat answers alone. Check repeatable calculations, data-access controls, and total team cost first. For shared reporting, I’d also review metric definitions and inspectable SQL - the same checks I’d apply to Querio.
Julius AI Review: Can It Really Replace a Data Analyst?
::: @iframe https://www.youtube.com/embed/-zz3yU1k0zs :::
Data Sources and Analysis Features
Start with source fit: do you need live warehouse access or analysis of uploaded files? Julius AI is described as requiring no setup for individual analysis and handling large datasets. CamelAI’s source support is unverified here.
These limits matter because the matched tests below use the same dataset and prompts. Check source fit first, then compare analysis depth and how each tool handles outputs.
| Capability | CamelAI | Julius AI |
|---|---|---|
| Data sources, file types, and live connections | Unverified | Unverified |
| Individual setup and dataset scale | Unverified | Described as zero-setup and able to handle large datasets |
| Charts, sharing, and exports | Unverified | Unverified |
| Security | Unverified | Unverified |
CamelAI: Database and Warehouse Connections
CamelAI’s database and warehouse connectors are not confirmed here. Verify live warehouse access before choosing it for warehouse-connected work.
Julius AI: File and Notebook Analysis
Julius AI’s supported file types and live connections are not confirmed here. This is a key consideration when building a conversational AI tool for real-time analytics.
Charts, Sharing, and Exports
The side-by-side sales and revenue tests that follow build on these source-fit checks.
Matched Tests: Sales Trends and Revenue Changes
::: @figure 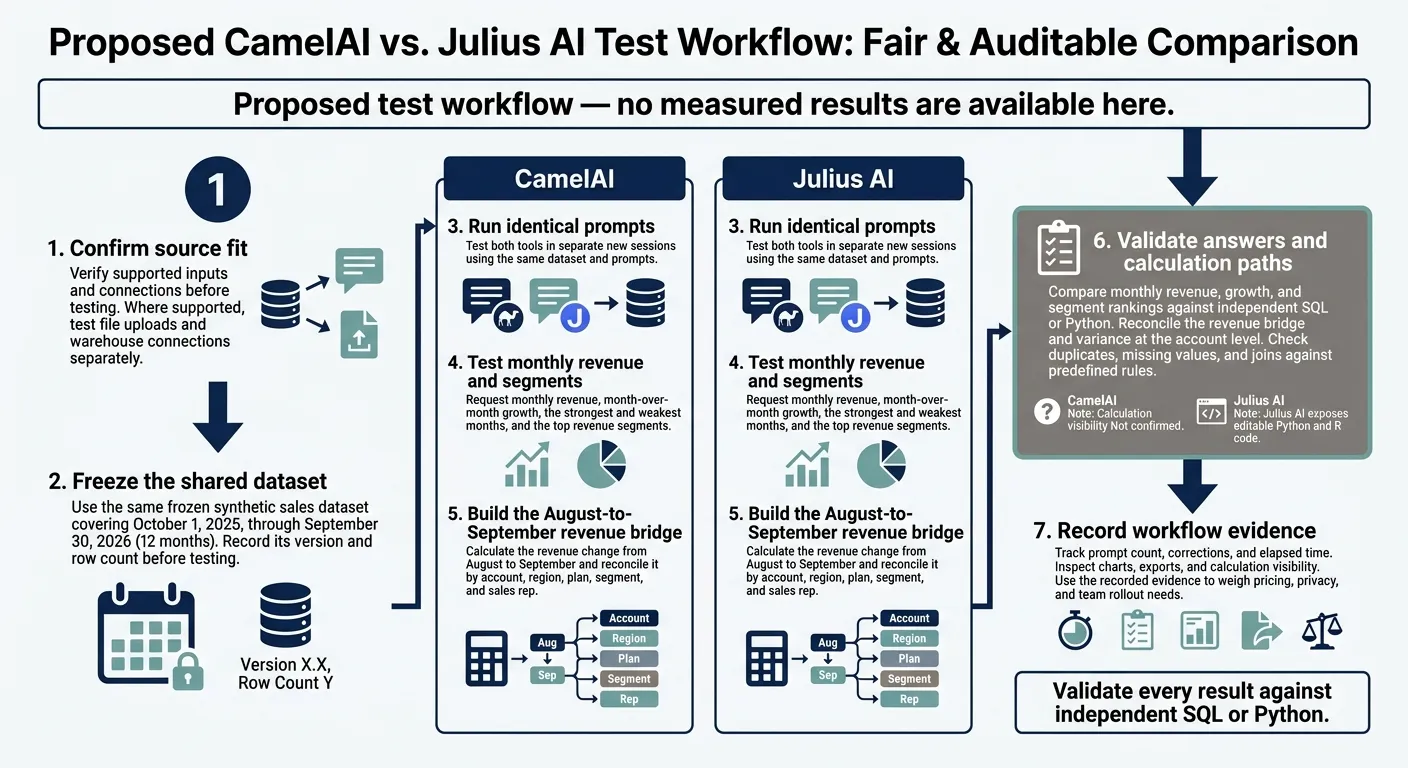 {CamelAI vs Julius AI: Matched-Test Workflow}
:::
{CamelAI vs Julius AI: Matched-Test Workflow}
:::
Once you’ve confirmed source fit, run matched tests to see whether each tool gives repeatable answers your data team can trust.
Use the same frozen synthetic sales dataset covering October 1, 2025, through September 30, 2026. Record its version and row count before testing. Run identical prompts in separate new sessions. Where supported, test file uploads and warehouse-native data analysis tools separately. Validate every result against independent SQL or Python.
Monthly Revenue and Top Segments
Ask both tools for monthly revenue, month-over-month growth, the strongest and weakest months, and the top revenue segments.
August-to-September Revenue Bridge
Ask both tools to calculate the revenue change from August to September, then reconcile that change by account, region, plan, segment, and sales rep.
Accuracy, Calculation Review, and Workflow Results
Review the answer and the calculation path so finance and analytics teams can audit the results. Julius AI exposes editable Python and R code.[1]
No measured results are available here. Compare monthly revenue, growth, and segment rankings with the independent reference. Reconcile the revenue bridge and variance at the account level, and check how each tool handles duplicates, missing values, and joins against predefined rules.
Track prompt count, corrections, and elapsed time. Inspect charts, exports, and how much of the calculation logic each tool makes visible. Use these results to weigh pricing, privacy, and team rollout needs.
Pricing, Privacy, and Team Needs
Once you’ve checked accuracy and workflow, cost and data governance help determine whether a tool fits daily warehouse use.
Plan Prices and Usage Limits
| Product | Current pricing and seat info | What to confirm |
|---|---|---|
| CamelAI | Unverified | Price in USD, seat requirements, usage limits, and warehouse access cost |
| Julius AI | Unverified; pricing is described in terms of monthly credits and computational resources (RAM) | Usage limits, warehouse access cost if supported, and total cost for one analyst versus a small team |
Compare the cost for one analyst with the cost for your team. If both fit your budget, check whether the contract meets your data and access requirements.
Data Retention, Model Training, and Compliance
The supplied material does not confirm either product’s retention, deletion, training-use, or compliance terms. Teams using Snowflake, BigQuery, Redshift, and Postgres should request the following details before purchasing:
| Procurement check | CamelAI evidence needed | Julius AI evidence needed |
|---|---|---|
| Retention/deletion | Retention schedule and deletion terms | Retention schedule and deletion terms |
| Training use / subprocessors | Training-use terms, subprocessors, and data residency | Training-use terms, subprocessors, and data residency |
| Warehouse access controls | How warehouse access controls work | How warehouse access controls work |
| Team administration | SSO, roles, and audit logs | SSO, roles, and audit logs |
| SOC 2, DPA, BAA | SOC 2 evidence, DPA, and any available HIPAA BAA | SOC 2 evidence, DPA, and any available HIPAA BAA |
If your team needs shared metrics, account for Julius AI’s focus on individuals and small teams. It lacks enterprise-grade governance features such as shared metric definitions.[2]
Conclusion: Choose by Workflow and Test Results
Choose Julius AI for ad hoc file analysis and CamelAI for live warehouse-connected analysis - if it supports your connection and the workflow produces repeatable results you can audit.
Compare the matched test results to decide which workflow you can rely on for daily use.
| Your workflow | Best fit | What to verify |
|---|---|---|
| One-off analysis of CSV, Excel, Google Sheets, or PDF data | Julius AI | Your inputs are supported, work as expected, and produce repeatable calculations. |
| Analysis requiring live database or warehouse access | CamelAI | Your specific connection works, calculations match warehouse results, and governance requirements are met. |
| Shared reporting with unresolved accuracy or governance questions | Neither | Check calculation visibility, governance, and budget fit before standardizing. |
If your team shares dashboards across finance, RevOps, or analytics, governance matters as much as source access.
Warehouse Governance for Querio Readers
For teams using Snowflake, BigQuery, Redshift, and Postgres, focus on consistent metric definitions, SQL/Python you can inspect, live connections, and governed self-serve access. These help reduce conflicting answers from separate exports. Querio’s governed context layer and editable logic support this workflow.
FAQs
::: faq
How do I spot errors in chat-based revenue analysis?
Don’t rely on the final output alone. Request and review the generated SQL or Python to check each calculation step [1][2]. Querio lets you inspect and correct that logic directly in a reactive notebook [3][4].
For file-based tools, preview uploaded data to check headers, date formats, and currency units [1]. Prioritize a governed semantic layer with shared metric definitions so inconsistent filters or logic don’t produce conflicting revenue numbers [3][4][5]. :::
::: faq
How can I estimate my team’s total analysis cost?
Estimate your total analysis cost based on user count, analysis volume, and pricing structure. Julius AI’s per-seat subscriptions cost more as you add users. Message caps, RAM ceilings, or credit limits may also push your team to a higher tier.
A flat workspace fee covers unlimited users and AI usage, with no per-question charges. When comparing costs, consider whether your team needs one-off file analysis or repeatable warehouse reporting with governance controls. :::
::: faq
What safeguards do I need for sensitive warehouse data?
Choose live, read-only warehouse connections over exports. They preserve row-level permissions and help prevent outdated or insecure copies of your data.
Look for SOC 2 Type II certification, HIPAA compliance with signed BAAs, SSO, role-based access control, and OAuth so AI agents inherit each user’s permissions.
Confirm that your data isn’t used for model training and that LLM providers receive only the metadata they need - not row-level data. :::