Descriptive Predictive Prescriptive Analytics A Guide to Data Mastery
Unlock the power of your data. This guide explains descriptive predictive prescriptive analytics with real-world examples to drive smarter business decisions.
https://www.youtube.com/watch?v=8jgBM8SjXYM
published
Outrank AI
descriptive predictive prescriptive analytics, data analytics, business intelligence, predictive modeling, decision making
dad4571f-aa22-4f74-9b0f-dec11cf23e03

Imagine your business data is like a patient visiting a doctor. Descriptive analytics is the initial check-up—taking vital signs, reviewing medical history, and understanding what has already happened. Predictive analytics is the diagnosis, where the doctor uses those symptoms to forecast what could happen next. And finally, prescriptive analytics is the treatment plan, a set of specific, recommended actions to get the best possible outcome.
Your Journey Through the Three Stages of Analytics
This evolution from descriptive to predictive, and then to prescriptive, is a common path for businesses looking to get more from their data. It’s less about picking one tool and more about a journey of growing sophistication. Each stage builds on the one before it, turning raw historical data into a powerful guide for what to do next. It’s how you move from simple hindsight to game-changing foresight.
You can't really predict what's coming if you don't have a solid grasp of what's already happened. And without a reliable forecast, you’re just guessing at the best course of action. This logical flow is what building a truly data-driven culture is all about.
From Hindsight to Foresight
It all starts with descriptive analytics. This first stage is about getting the essential context—organizing your historical data into dashboards and reports that answer the simple but crucial question: "What happened?" This is the foundation, revealing trends in sales, customer behavior, or operational hang-ups.
Next up is predictive analytics, which takes that historical data and uses it to look around the corner. By applying statistical models and machine learning, it helps answer the question: "What is likely to happen?" This is where you start becoming proactive, anticipating things like which customers might churn or when you’ll need to restock inventory.
Finally, prescriptive analytics turns that foresight into a concrete plan. It doesn’t just predict an outcome; it actually recommends specific actions to achieve the best result, answering the ultimate question: "What should we do about it?"
Think of it like a smart GPS. Descriptive analytics shows you the route you’ve already driven. Predictive analytics estimates your arrival time based on the traffic ahead. But prescriptive analytics is what actively reroutes you around a sudden accident to make sure you get there as fast as possible.
This diagram shows how each stage adds more value, building on the insights from the previous one.
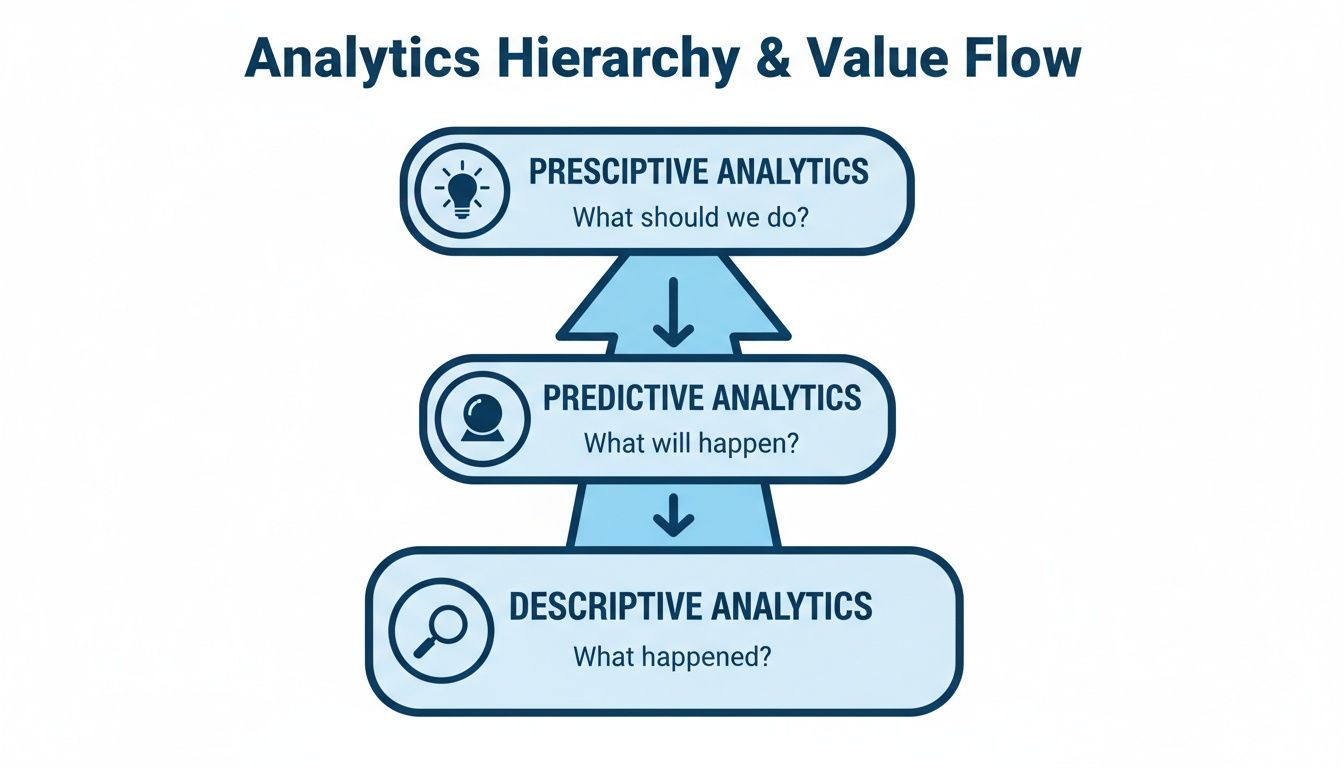
As you can see, moving up the ladder from descriptive to prescriptive analytics unlocks more powerful and valuable business guidance.
The Three Types of Analytics at a Glance
To make the roles of each analytics type crystal clear, it helps to see them side-by-side. Each one answers a different kind of question and brings a unique value to the table. Knowing the difference helps you understand where your company is now and where you want to go.
This table gives a quick snapshot of descriptive, predictive, and prescriptive analytics.
Analytics Type | Core Question Answered | Primary Business Value |
|---|---|---|
Descriptive Analytics | What happened? | Gives you a clear picture of past performance and uncovers historical trends. |
Predictive Analytics | What is likely to happen? | Lets you build proactive strategies by forecasting future outcomes and identifying risks. |
Prescriptive Analytics | What should we do? | Recommends the best actions to take to hit your goals and improve efficiency. |
Mastering this progression is what allows a business to stop just reacting to the market and start actively shaping its own success.
Building a Strong Foundation with Descriptive Analytics
Every great data strategy starts by looking back before it looks forward. This is the world of descriptive analytics, the first and most fundamental step in making sense of your business data. Its entire job is to answer one simple, powerful question: "What happened?"
Think of it as the scoreboard for your business. It doesn't tell you who will win the next game, but it gives you a crystal-clear summary of the score, key plays, and player stats from the games you've already played. The dashboards you glance at over your morning coffee, the sales reports that land in your inbox each week—these are all descriptive analytics at work. It’s all about turning a mountain of raw data into a coherent story about your past performance.
Without this baseline, trying to predict the future is just shooting in the dark. A retailer, for instance, might use descriptive analytics to see which products flew off the shelves last Christmas. An operations manager could look at historical data to pinpoint which factory line had the most downtime last quarter. These aren't predictions; they are hard facts that create the foundation for smarter decisions.
Key Tools and Techniques for Descriptive Analytics
Answering "What happened?" doesn't require complex, futuristic models. It's about taking large, messy datasets and boiling them down into something clean and digestible.
Here are the workhorse techniques you'll see most often:
Data Aggregation: This is simply grouping raw data into summaries. Think of calculating total monthly revenue from thousands of individual sales or summing up daily website visits to get a weekly total.
Data Mining: This is about sifting through your data to find interesting patterns and relationships. It’s how you might discover that customers who buy your coffee machine are also very likely to come back for your premium coffee beans.
Measures of Central Tendency: These are your classic statistical summaries—mean (the average), median (the middle value), and mode (the most common value)—that give you a quick snapshot of your data.
Measures of Dispersion: Metrics like range and standard deviation tell you how spread out your data is. Are your sales numbers consistent every month, or do they swing wildly? This is how you find out.
These methods are the engine that turns raw numbers into a clear narrative about your business's history.
Visualizing the Past for Clearer Insights
Let's be honest: spreadsheets full of numbers are hard for anyone to get excited about. That's why data visualization is so critical here. A good chart or graph can transform historical data from a boring table into an insightful story that anyone can understand in seconds.
Descriptive analytics is fundamentally about storytelling with data. A well-designed bar chart showing monthly sales trends can communicate insights far more effectively than a spreadsheet filled with the same numbers.
The key is picking the right visual for the job. A line chart is perfect for showing how a metric has changed over time. A pie chart can break down a whole, like showing market share by region. To learn more about making your data pop, check out our data visualization guide on choosing the right charts. It’s packed with practical tips to make sure your historical insights land with impact.
Essential KPIs for Tracking Performance
Descriptive analytics runs on Key Performance Indicators (KPIs). These are the specific, measurable values that show how your company is doing against its most important goals. Without clear KPIs, you’re just collecting data for the sake of it.
Here are some common examples from across the business:
Sales: Monthly Recurring Revenue (MRR), Customer Acquisition Cost (CAC), Average Deal Size.
Marketing: Website Traffic, Conversion Rate, Cost Per Lead (CPL).
Operations: On-Time Delivery Rate, Production Downtime, Inventory Turnover.
Product: Daily Active Users (DAU), Customer Churn Rate, Feature Adoption Rate.
By tracking these KPIs consistently, you build a reliable historical record. This record becomes the solid ground on which all other types of analytics—from predicting future trends to recommending the best course of action—are built. It ensures every future strategy is rooted in a real understanding of what has already happened.
Seeing the Future with Predictive Analytics

If descriptive analytics is like looking in the rearview mirror, predictive analytics is your GPS showing you the road ahead. It takes all that rich historical data and uses it to answer the most pressing question in business: “What is likely to happen next?” This is the critical shift from being reactive to truly proactive.
You’re no longer just figuring out why customers left last quarter. Now, you can spot who is at risk of leaving next month and step in before it's too late. Think of it as a weather forecast for your business. It won't tell you with 100% certainty what will happen, but it gives you a highly probable outlook so you can prepare for rain or shine. It’s a huge leap forward, moving you out of simple reporting and into the world of strategic foresight.
Predictive analytics isn't just a niche tool; it's a powerhouse. It consistently outpaces other analytics segments in revenue and adoption. In fact, Grand View Research found that predictive analytics generated USD 27,899.8 million in a single year, capturing a massive 40.12% revenue share of the entire global data analytics market. Its dominance comes from its ability to forecast future trends using historical data, AI, and machine learning, making it essential for everything from demand planning to risk assessment. You can dig into the global data analytics market trends for more details.
How Predictive Analytics Works
At its heart, predictive analytics is all about sophisticated pattern recognition. It uses statistical algorithms and machine learning to find subtle relationships and trends in your historical data to calculate the probability of future outcomes.
The process involves feeding large datasets—everything from customer demographics to past purchase behavior—into a predictive model. This model "learns" from the data and then applies that knowledge to current information to forecast what will happen next.
A great example is a credit card company’s fraud detection system. It analyzes millions of transactions to learn what "normal" spending looks like for you. The moment a transaction pops up that breaks your pattern—say, a big purchase in another country—the predictive model flags it as potentially fraudulent, often in real time.
This isn't magic; it's just math and data working together on a massive scale.
Common Predictive Modeling Techniques
Several types of models drive predictive analytics, and each is built for a different kind of problem. Getting familiar with them helps pull back the curtain on how these forecasts are made.
Regression Models: Use these when you need to predict a continuous number. Think forecasting next quarter's sales revenue based on your marketing spend or estimating a house's price based on its square footage and location.
Classification Models: These models give you a categorical answer, usually a "yes" or "no." They're perfect for jobs like identifying which customers are likely to churn or flagging a transaction as fraudulent.
Time Series Models: When your data has a time component, these are the go-to. They analyze historical data points in chronological order to predict future values, which is why they are indispensable for demand forecasting and stock price analysis. You can learn more in our deep dive on how to do time series analysis.
Clustering Models: This technique is all about grouping similar things together without any prior labels. A marketing team could use clustering to segment customers into distinct personas based on their behavior, paving the way for hyper-targeted campaigns.
Real-World Applications and Business Value
The real value of descriptive, predictive, and prescriptive analytics comes to life when you apply them to solve real business problems. Predictive analytics, in particular, creates tangible results by enabling forward-thinking strategies across the organization.
An e-commerce retailer can forecast inventory needs for the holiday rush, making sure popular items don't sell out while avoiding overstocking on duds. This directly impacts cash flow and keeps customers happy. In another scenario, a subscription service can predict which users are about to cancel, giving the customer success team a chance to step in with targeted offers to keep their business.
In operations, factories use predictive maintenance models that analyze sensor data from machinery to predict when a part is about to fail. This allows technicians to schedule repairs before a catastrophic breakdown occurs, saving a fortune in downtime and lost production. By looking ahead, businesses can get a handle on risks, jump on opportunities, and gain a serious advantage over competitors who are still stuck looking at the past.
Driving Optimal Outcomes with Prescriptive Analytics

This brings us to the final—and most powerful—stage of the analytics journey. While predictive analytics gives you a glimpse into the future, prescriptive analytics tells you exactly what to do about it. It answers the ultimate business question: “What is the best course of action?”
This is where analytics gets really exciting. Instead of just forecasting what might happen, it combines predictions with business rules, constraints, and complex algorithms to recommend specific steps that will get you the best possible result.
A perfect analogy is a modern GPS navigator. It doesn’t just predict your arrival time based on traffic. It actively suggests a different route to avoid a sudden jam, making sure you get to your destination faster. That proactive recommendation is the essence of prescriptive analytics. It’s the leap from seeing the future to changing it.
Ultimately, the goal is to enable true AI-powered decision-making, turning mountains of complex data into clear, optimized choices that fuel business growth. It's a capability that's quickly becoming a major competitive advantage.
How Prescriptive Analytics Guides Your Business
So, how does it actually work? Prescriptive analytics operates by running countless "what-if" scenarios at incredible speed. It weighs the potential outcomes of different decisions against your company’s goals and constraints—like budget, resources, or regulations—to find the absolute best path forward.
Take an airline, for example. It can use prescriptive models to dynamically adjust ticket prices. The system doesn't just look at one or two factors; it considers demand forecasts, competitor pricing, fuel costs, and even weather patterns to recommend the perfect price for every single seat, at any given moment, to maximize profit. This isn't just a prediction; it's a specific, actionable instruction.
Prescriptive analytics is the engine that closes the loop between data and action. It takes the guesswork out of complex decisions, recommending the most effective steps to achieve strategic goals with a high degree of confidence.
This kind of power is driving huge market growth. A market analysis by Technavio projects the global prescriptive analytics market will surge by USD 10.96 billion over a four-year period, growing at an impressive compound annual growth rate (CAGR) of 23.3%. Businesses everywhere are eager to move beyond simple forecasting.
Real-World Applications and Advantages
The applications for prescriptive analytics are popping up across every industry, automating and fine-tuning complex operations to deliver real, tangible value.
Here are a few compelling examples of prescriptive analytics in action:
Logistics and Supply Chain: A delivery company can optimize its routes in real-time. The system continuously analyzes traffic, delivery windows, and fuel consumption to reroute drivers on the fly, saving millions in operational costs.
Manufacturing: A factory can perfect its production schedule. A prescriptive model considers machine availability, raw material inventory, and order deadlines to create the most efficient plan possible, cutting downtime and boosting output.
Finance: Investment firms can use it to build optimal portfolios. The models assess risk tolerance, market predictions, and financial goals to recommend the ideal mix of assets for a client.
Healthcare: Hospitals can optimize staff scheduling. Algorithms analyze patient admission forecasts and staff availability to create schedules that ensure top-notch care without burning out employees.
By implementing these kinds of solutions, companies aren't just improving efficiency; they're strategically setting and achieving more ambitious goals. To support this, many are turning to advanced tools; you can read our guide on AI tools for smarter KPI target setting to learn more. The clear progression through descriptive, predictive, and prescriptive analytics gives businesses the power to transform their operations from the ground up.
How to Implement Your Analytics Strategy
So, you understand the differences between descriptive, predictive, and prescriptive analytics. That’s a great start. But making them work for your business is a whole different ball game. It’s a journey, not a sprint, and it requires a clear, methodical plan to build a culture that truly runs on data.
The biggest mistake I see companies make? Rushing to buy the fanciest new tool. The real starting point isn't technology—it's your business goals. What problem are you actually trying to solve? Forget vague ambitions like "we need to be more data-driven." Get specific. Think: "we need to cut customer churn by 15% this year" or "let's improve our supply chain efficiency by 10%."
These concrete targets become your North Star. They guide every decision you make, from the data you collect to the models you build, ensuring that every ounce of effort contributes real, measurable value.
Defining Goals and Gathering Data
With a sharp, clear goal in hand, you can move on to the next—and often toughest—phase: wrangling your data. This means pulling information from all the places it lives, whether that’s your CRM, ERP system, or marketing platforms.
Let’s be clear: data quality is everything. If your data is a mess—full of errors, gaps, or inconsistencies—your analytics will be useless. This is why a staggering 80% of the time on any analytics project is spent just getting the data ready. This prep work involves a few key steps:
Cleaning: Fixing errors and figuring out what to do with missing values.
Standardizing: Making sure data formats are consistent everywhere.
Integrating: Pulling different datasets together to create one complete picture.
Before you get too far, it's smart to take stock of where you stand. Our guide on how to assess data readiness for AI adoption offers a great framework for spotting gaps in your data foundation so you can fix them early.
Choosing Your Tools and Starting Small
Once your data is clean and organized, it’s time to think about tools. You need a tech stack that can grow with you, from simple descriptive dashboards all the way to advanced prescriptive recommendations. Modern BI platforms like Querio are built for this, helping teams get insights without needing a PhD in data science.
Resist the urge to launch a massive, company-wide analytics revolution all at once. It’s a recipe for disaster. Instead, start with a pilot project. Pick one well-defined business problem where you can score a quick, visible win.
A pilot project is your proof of concept. It minimizes risk, shows the tangible ROI of analytics, and makes it much easier to get the buy-in you need to go bigger.
This approach—start small, prove the value, and then scale—is the most reliable way to weave analytics into the very fabric of your company.
Scaling and Integrating Insights
After your pilot project succeeds, you've earned the right to scale. Now you can expand to other departments, take on more complex challenges, and begin climbing the ladder from descriptive insights to predictive forecasts and prescriptive actions. A practical AI implementation roadmap can be a huge help here, giving you a structured way to connect your tech investments to real business outcomes.
The final piece of the puzzle is integration. Analytics is only valuable if it drives action. This means getting insights out of a forgotten report and into the hands of the people doing the work every day. Embed dashboards into the tools your team already uses, set up automated alerts based on predictive models, and make sure decision-makers can get the information they need, right when they need it. This is how you close the loop and turn data from a static report into a dynamic engine for growth.
To bring it all together, here's a simple roadmap you can follow. It breaks down the journey into manageable phases, highlighting what to do and what to avoid at each step.
Analytics Implementation Roadmap
Phase | Key Actions | Common Pitfalls to Avoid |
|---|---|---|
1. Strategy & Goals | Define specific, measurable business objectives (e.g., "Reduce cart abandonment by 20%"). Identify KPIs. | Vague goals like "become data-driven." Starting with a tool instead of a business problem. |
2. Data Foundation | Inventory data sources. Clean, standardize, and integrate data. Assess overall data readiness. | Underestimating the time needed for data prep. Ignoring data quality and governance issues. |
3. Pilot Project | Select a high-impact, low-risk project. Build a small, cross-functional team. Choose the right tools. | Trying to boil the ocean with a massive first project. Failing to define success criteria. |
4. Scale & Expand | Replicate pilot success in other departments. Move from descriptive to predictive analytics. | Scaling too quickly without a solid foundation. Lack of training for new users. |
5. Integration & Action | Embed analytics into daily workflows and tools. Automate recommendations. Foster a data-driven culture. | Keeping insights siloed in dashboards. Not connecting analytics to decision-making processes. |
Following a structured path like this transforms analytics from an abstract concept into a powerful, practical asset for your entire organization. It ensures you build momentum, prove value, and create lasting change.
Common Questions About Analytics
As you start to explore what analytics can do for your business, you're bound to have some questions. It's a natural part of the process. Let's tackle some of the most common ones that come up when teams move from looking at the past to actively shaping their future.
Can I Skip Descriptive Analytics and Go Straight to Predictive?
It’s tempting to jump right into the exciting world of predictions, but honestly, that’s a recipe for disaster. Think of it like trying to build a house on a shaky foundation. You just wouldn't do it.
Predictive models are only as good as the historical data they learn from. Descriptive analytics is the crucial first step where you clean, organize, and actually understand that data. If you skip this, you're essentially feeding garbage into your predictive algorithms. The result? Unreliable forecasts and bad business decisions that could cost you dearly.
What Is the Main Difference Between Predictive and Prescriptive Analytics?
This is a great question because the two sound so similar, but their purpose is fundamentally different. It really comes down to foresight versus action.
Predictive analytics tells you what’s likely to happen. Prescriptive analytics tells you what to do about it.
Predictive Output: A forecast or a probability. For example, "This customer has an 85% chance of churning next month."
Prescriptive Output: A direct recommendation. For example, "To prevent churn, offer this specific customer a 10% discount on their next renewal."
A prediction gives you a warning. A prescription gives you the cure. That final step is what turns a powerful insight into a concrete, value-driving action.
How Much Data Do I Need to Get Started?
There's no single magic number here—it really depends on what you're trying to accomplish.
For descriptive analytics, the barrier to entry is quite low. You can start uncovering meaningful trends with just a few months of clean sales or operational data. Of course, the more history you have, the clearer the picture becomes.
Predictive analytics is a bit more demanding. Machine learning models need a lot of examples to learn from, so you'll generally want at least a year's worth of detailed data. For really complex problems, like forecasting intricate market shifts, you might need several years of data to find reliable patterns.
Remember, the quality of your data is always more important than the quantity. A smaller, well-organized dataset that’s directly relevant to your question will always beat a massive, messy data swamp.
The best advice? Start with what you have. You can almost always begin with descriptive reporting right away and build your data reserves over time to tackle more advanced projects later.
Do I Need a Team of Data Scientists?
Not necessarily, especially not right out of the gate. Modern analytics tools have put a ton of power into the hands of regular business users.
For Descriptive Analytics: A business analyst or even a curious, tech-savvy manager can use a platform like Querio to build dashboards and reports with zero code. The main skill here is understanding the business and asking the right questions.
For Predictive & Prescriptive Analytics: As you get more advanced, data expertise certainly helps. But even here, many modern platforms have built-in AI that automates much of the heavy lifting. This "augmented analytics" approach lets your team get predictive insights without needing a PhD in statistics for every single project.
You'll typically only need a dedicated data science team if you're building highly specialized, custom prescriptive models from the ground up. For most companies, the right tools paired with a data-literate team are more than enough to get the job done.
Which Type of Analytics Offers the Most Business Value?
This is a bit of a trick question because they're not really in competition with each other. Their value is stacked—each one builds on the last, and you can't have one without the one before it.
Descriptive Analytics: This is your foundation. It gives you a clear, honest look at what’s happened and where you stand. Without it, you're just guessing. Its value is in creating a single source of truth for everyone.
Predictive Analytics: This is where you gain a strategic edge. Being able to anticipate demand, spot at-risk customers, or see supply chain issues before they happen is a huge advantage. It allows you to be proactive instead of reactive.
Prescriptive Analytics: This delivers the biggest and most direct ROI. By telling you the best action to take in any given scenario, it directly optimizes for efficiency and profit. It's the engine for automated, intelligent decision-making.
So while prescriptive analytics might have the most impressive impact on the bottom line, it’s completely powerless without the context from descriptive and the foresight from predictive. The real magic happens when you master the entire descriptive, predictive, and prescriptive analytics journey.
Ready to unlock the power of your data and empower every team with self-serve analytics? Querio’s AI-powered platform lets you move from simple questions to deep insights in seconds. Eliminate manual reporting, standardize your metrics, and start making decisions that drive real growth.

