Business Intelligence
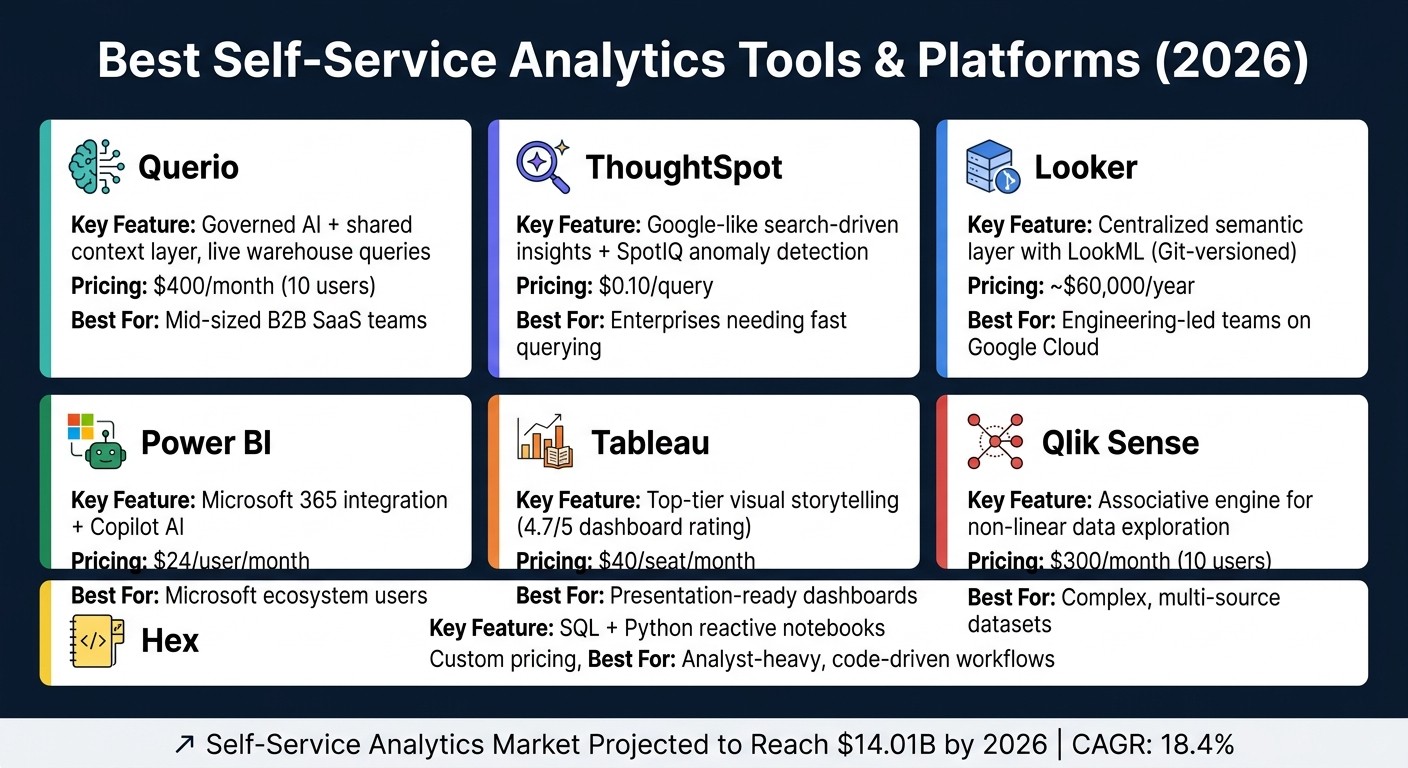
Best Self-Service Analytics Tools & Platforms (2026)
Compare AI-driven self-service analytics platforms, governance, NLQ, and pricing for warehouse-native teams.
Self-service analytics tools in 2026 are revolutionizing data access for non-technical users. With AI-driven capabilities like natural language querying (NLQ), teams can now ask questions in plain English and get real-time insights directly from live data warehouses. The best platforms - Querio, ThoughtSpot, Looker, Power BI, Tableau, Qlik Sense, and Hex - offer unique solutions depending on your needs, from advanced governance to intuitive interfaces.
Key Highlights:
Querio: AI-powered with a shared context layer for consistent metrics. Built for teams using Snowflake, BigQuery, or Redshift. Starting at $400/month for 10 users.
ThoughtSpot: Google-like search for data with SpotIQ anomaly detection. Priced at $0.10 per query.
Looker: Centralized semantic layer with LookML for governance. Tailored for Google Cloud users. Enterprise pricing starts at ~$60,000/year.
Power BI: Affordable and integrates well with Microsoft 365. Premium plans start at $24/user/month.
Tableau: Top-tier visual storytelling with live data connections. Pricing from $40/seat/month.
Qlik Sense: Associative engine for non-linear exploration. Starts at $300/month for 10 users.
Hex: Combines SQL and Python in reactive notebooks. Ideal for analyst-heavy teams.
Quick Comparison:
Platform | Key Feature | Pricing | Best For |
|---|---|---|---|
Querio | Governed AI, live queries | $400/month (10 users) | Mid-sized B2B SaaS teams |
ThoughtSpot | Search-driven insights | $0.10/query | Enterprises needing fast querying |
Looker | Semantic layer with LookML | ~$60,000/year | Engineering-led teams |
Power BI | Microsoft 365 integration | $24/user/month | Microsoft ecosystem users |
Tableau | Visual storytelling | $40/seat/month | Teams needing presentation-ready dashboards |
Qlik Sense | Associative data exploration | $300/month (10 users) | Complex, multi-source datasets |
Hex | SQL + Python notebooks | Custom pricing | Analyst-heavy workflows |
Each tool has its strengths and trade-offs. Whether you prioritize governance, usability, or advanced visuals, the right choice depends on your team’s specific needs and technical setup.
Best Self-Service Analytics Tools Compared (2026)
How AI Tools can Finally Solve the Self-Service Analytics Problem?
1. Querio
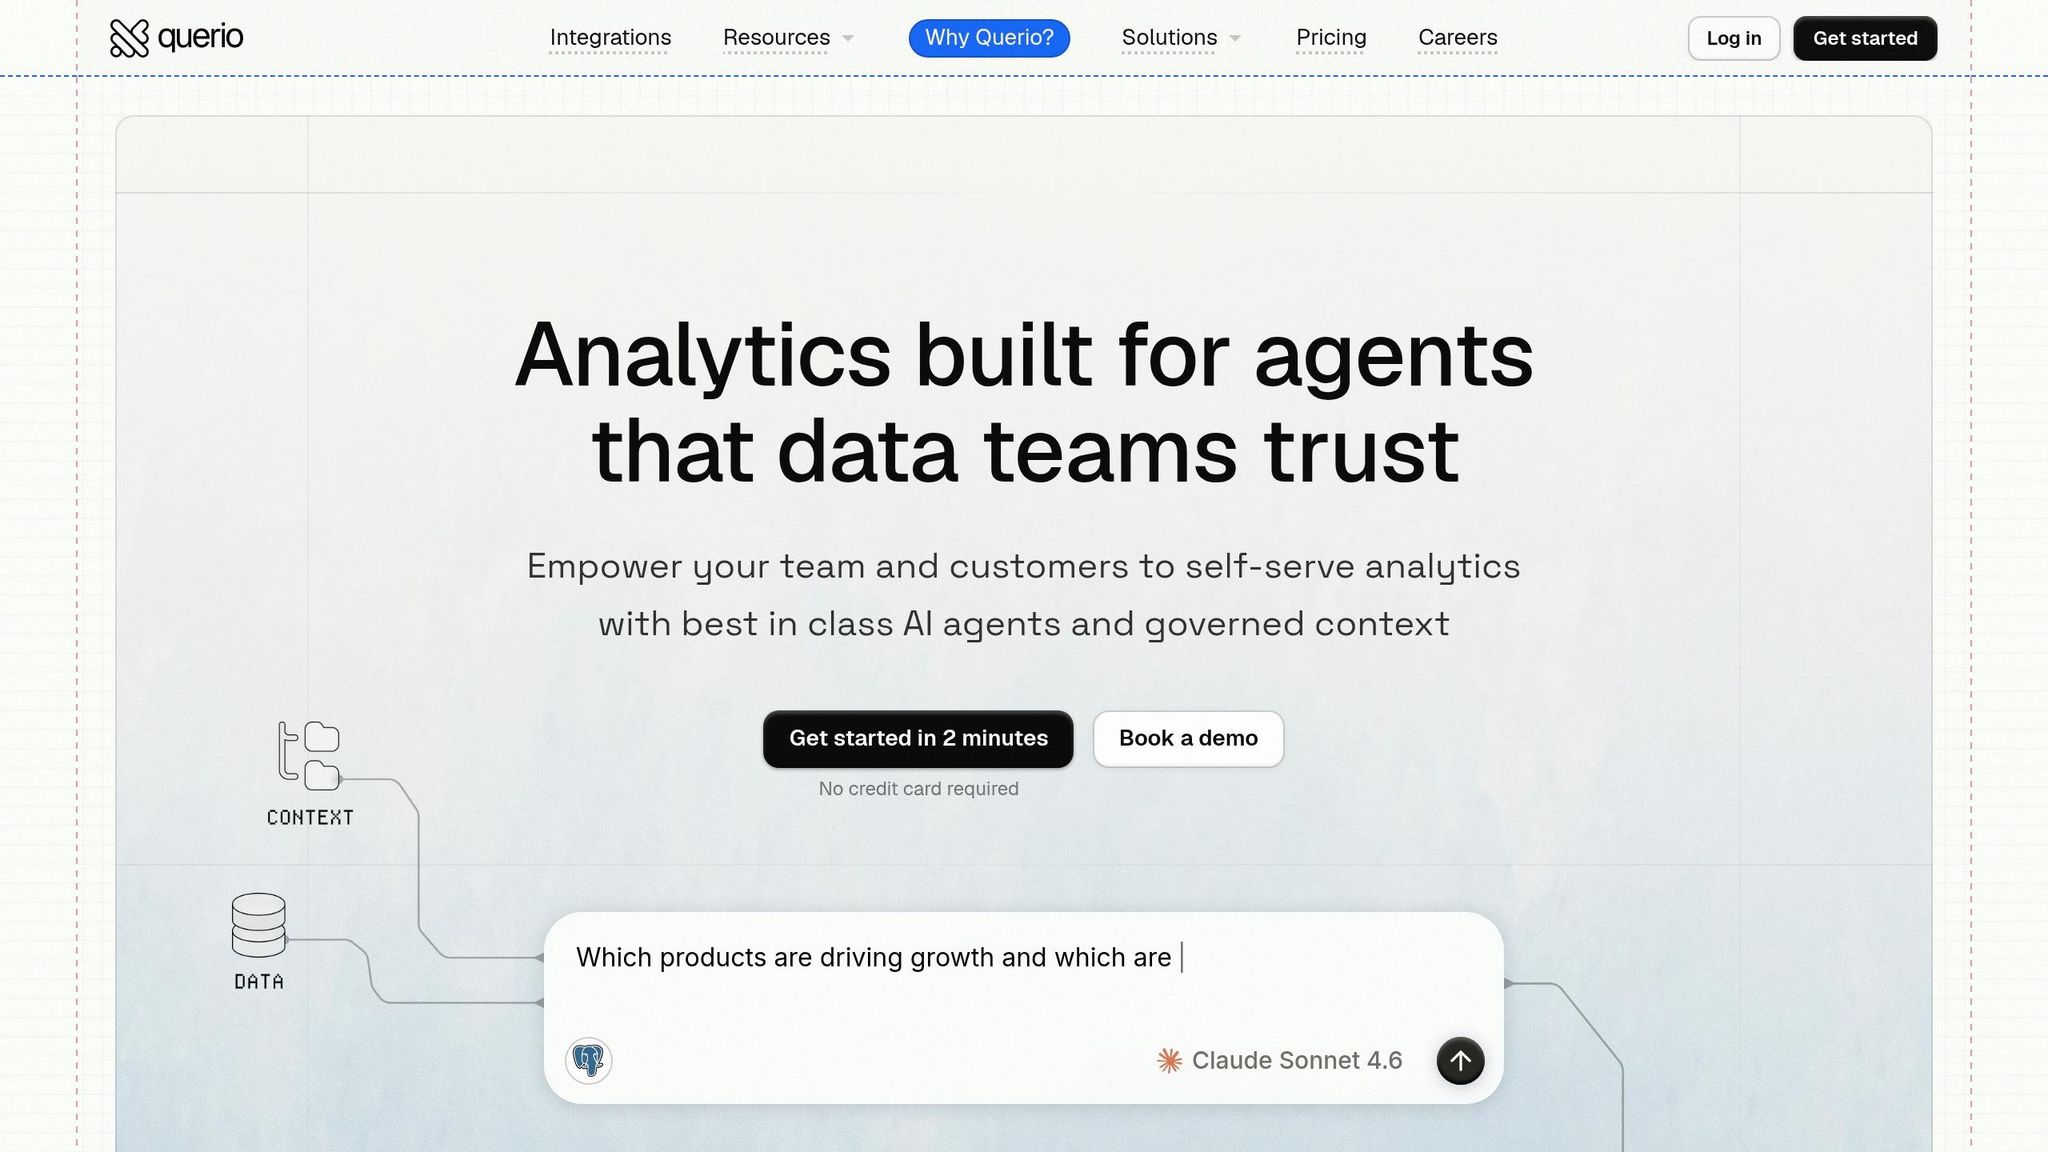
Querio is an analytics workspace powered by AI, built specifically for teams that rely on modern analytics stack components like Snowflake, BigQuery, Redshift, or Postgres. It enables business users to ask questions in plain English and receive data-backed answers in the form of executable SQL or Python. For data leaders in B2B SaaS companies, this approach scales analytics access while maintaining precision - an essential distinction.
AI Capabilities
Querio's AI agents excel at transforming natural language questions into inspectable and editable SQL or Python. This means every response is backed by a query that analysts can review, tweak, or reuse. For example, if a business user asks, "What was our net revenue retention last quarter by customer segment?", Querio generates the SQL query behind the scenes, ensuring full transparency. This level of openness helps build trust - a critical factor for AI adoption within data teams.
Governance and the Shared Context Layer
What makes Querio stand out is its shared context layer. Here, data teams can define key elements like joins, metrics, and business terms - such as how "active user" or "MRR" is calculated - just once. These definitions are then consistently applied across all queries, dashboards, notebooks, and reports. By enforcing these standardized definitions, Querio eliminates metric drift, ensuring everyone works with the same data logic.
Warehouse Integration
Querio connects directly to your data warehouse using encrypted, read-only credentials. There’s no need for data extracts, CSV exports, or duplicated data layers. This ensures that dashboards and reports always reflect real-time data, keeping insights accurate and up-to-date.
User Experience
The platform is designed with reactive notebooks at its core. Non-technical users can rely on the plain-English interface to handle complex tasks, while analysts can dive into the full SQL and Python environment with a single click. Updates made by analysts automatically refresh dependent queries, ensuring that all analyses remain synchronized without manual intervention.
Feature | What It Means in Practice |
|---|---|
Natural language to SQL/Python | Empowers business users to get answers without needing coding skills |
Inspectable, editable queries | Analysts can verify and trust every AI-generated query |
Shared context layer | Standardized metrics ensure consistency across teams |
Zero-copy warehouse connection | Real-time data access without outdated extracts |
Reactive notebooks | Keeps analyses accurate as logic evolves automatically |
Querio is priced at $400 per month for 10 users, with most plans offering unlimited seats. This flat-fee pricing model removes the hassle of per-user licensing, making it easier for growing teams to adopt.
Its emphasis on governed, transparent analytics sets a strong benchmark for platforms designed to work natively with data warehouses.
2. ThoughtSpot
ThoughtSpot is designed to make data exploration accessible to everyone, even those without technical expertise. By simply typing a question - like “show me churn rate by plan type this quarter” - users can instantly receive visual answers. Its clean, search-focused interface is ideal for organizations that want to give business teams direct access to data insights.
AI Capabilities
At the heart of ThoughtSpot’s AI functionality is Spotter, which translates natural language questions into queries capable of handling massive datasets, even those with billions of rows. SpotIQ works behind the scenes to identify trends and anomalies, ensuring users don’t miss unexpected changes in key metrics. Another standout feature, SpotterViz, allows users to create fully interactive dashboards with a single natural language prompt [3]. To maintain transparency, the Answer Explainer tool provides a detailed view of the data lineage behind any result. This mix of AI-powered tools highlights ThoughtSpot’s focus on combining advanced analytics with usability.
Feature | What It Does |
|---|---|
Spotter AI | Translates natural language into queries for large datasets. |
SpotIQ | Automatically identifies trends and anomalies. |
SpotterViz | Generates interactive dashboards from a single prompt [3]. |
Answer Explainer | Provides a clear view of data lineage for transparency. |
Spotter Coach | Improves AI accuracy through ongoing user feedback. |
Warehouse Integration
ThoughtSpot integrates seamlessly with major data warehouses like Snowflake, BigQuery, and Redshift, enabling live data connections.
Pricing
Pricing begins at $0.10 per query [3]. The upcoming sections will explore how ThoughtSpot and other platforms balance AI features with smooth integration to empower business teams.
3. Looker
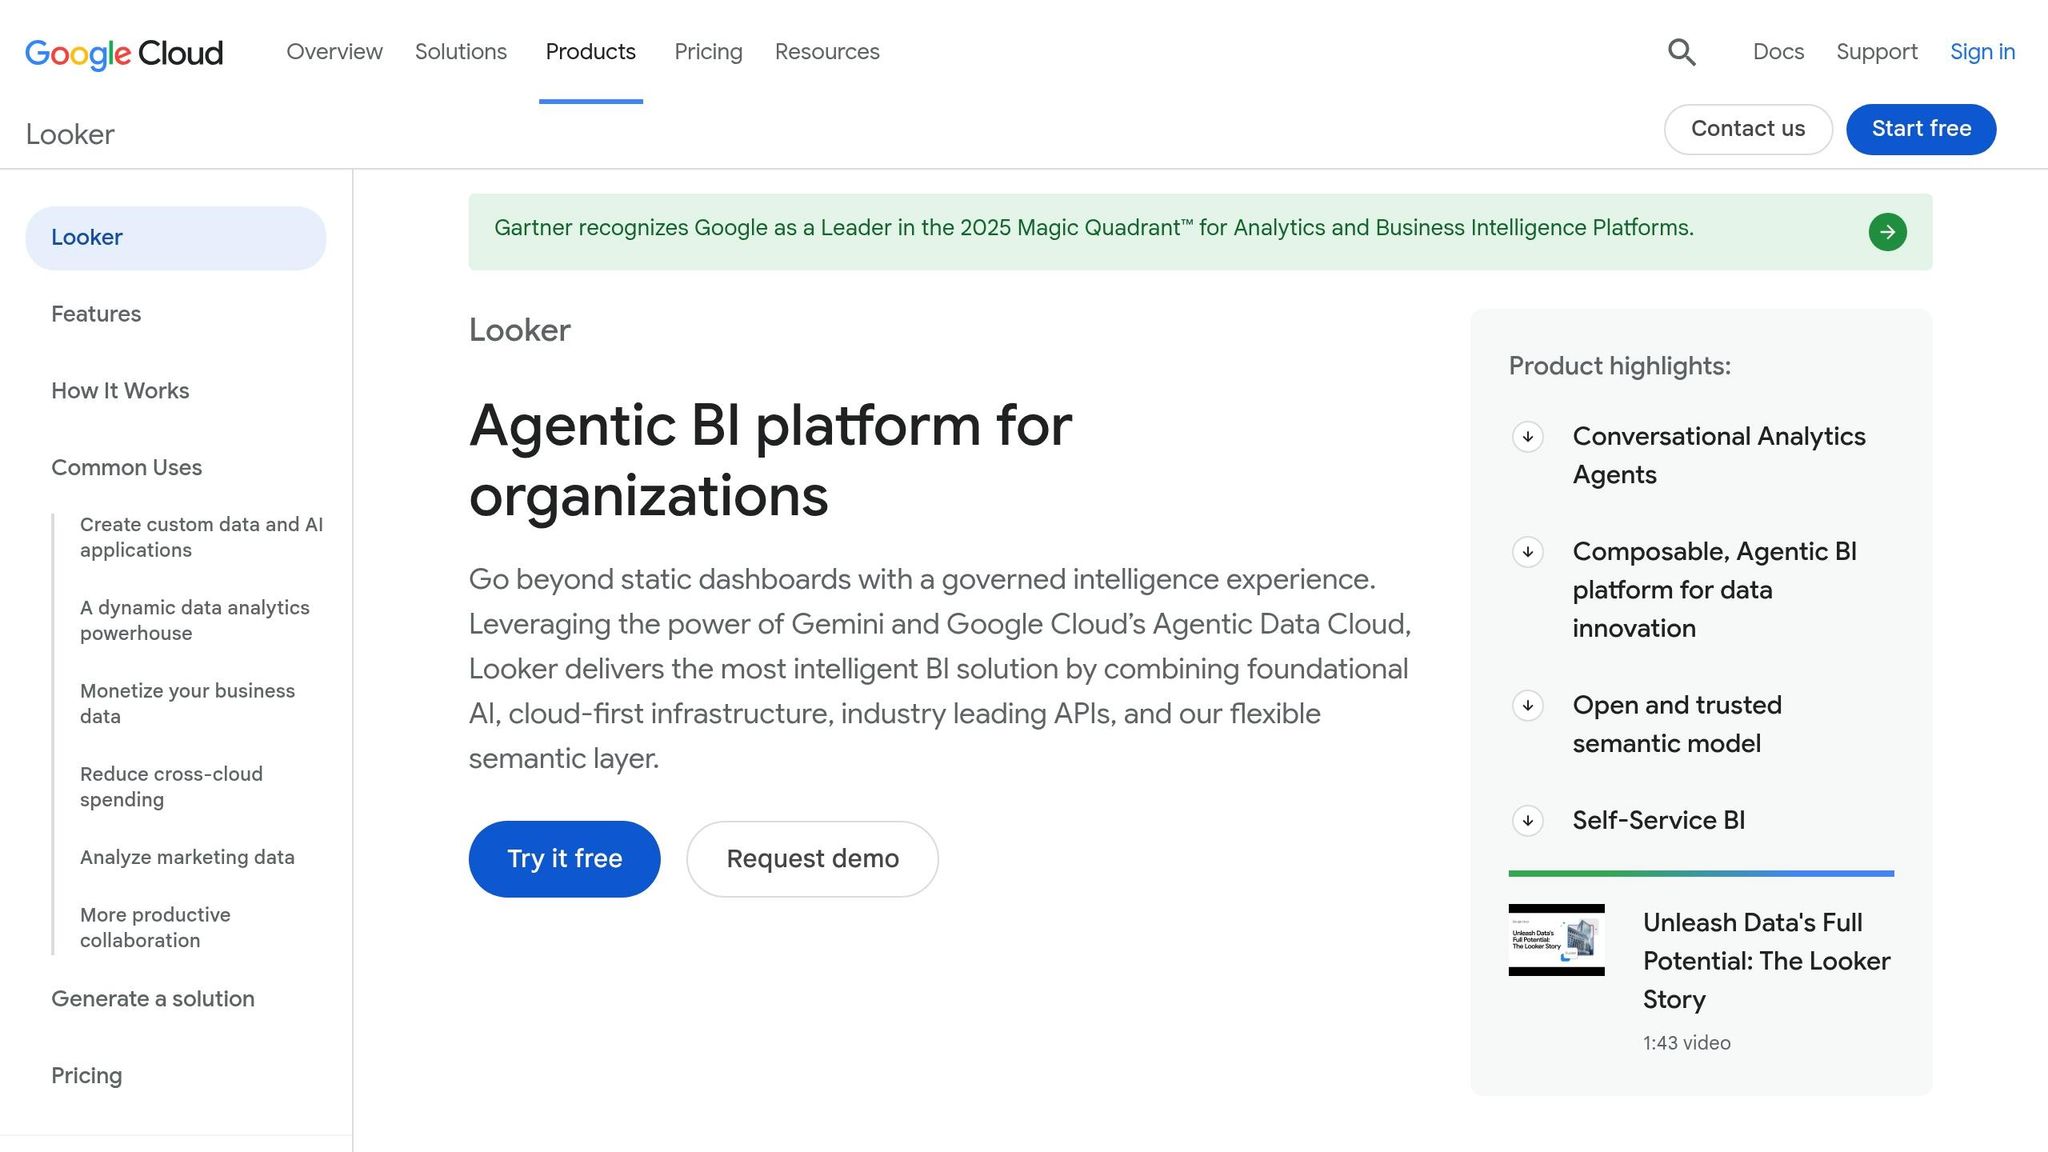
Looker uses a centralized semantic layer, defined by LookML and stored in Git-controlled repositories, to deliver consistent business metrics before any query is executed. This proprietary modeling language ensures all teams operate with the same definitions, creating a unified approach to reporting.
AI Capabilities
Looker is stepping into the AI space by integrating Google Gemini, enabling conversational analytics. This allows users to ask questions in plain English and get responses based on the pre-defined LookML model. The LookML Assistant, introduced in version 25.2, further supports data teams by offering AI-driven suggestions for building and refining models. Looker is also part of Google's Open Semantic Interchange (OSI) effort, which aims to standardize semantic models across BI tools and AI systems. These advancements align with Looker's focus on strong governance and live data connections.
Governance Features
Governance is one of Looker's strongest aspects. As noted in the Promethium Guide:
"Looker's semantic modeling layer, implemented through LookML, defines business metrics and relationships once and reuses them consistently across all reports." - Promethium Guide [2]
By defining metrics like revenue, churn, or activation rate in LookML, Looker ensures all teams work with consistent data. Governance is not an add-on feature but is embedded directly into the platform's design. This structure extends to Looker's live querying, delivering real-time and accurate insights.
Warehouse Integration & User Experience
Looker is one of several warehouse-native data analysis tools that connects directly to your cloud data warehouse - whether it's Snowflake, BigQuery, Redshift, or Databricks - without duplicating data. This live-query, zero-copy approach, combined with defined metrics, provides a real-time analytics experience that’s both governed and reliable. Looker's consistent recognition as a Gartner Magic Quadrant Visionary (2022–2025) reflects its strong position in the market [5].
While non-technical users benefit from governed analytics, building and maintaining the LookML model requires technical expertise. For organizations focused on scaling consistent metrics, this trade-off is often worth it. Enterprise pricing typically starts at approximately $60,000 per year [4] [2].
Feature | Looker Capability |
|---|---|
Warehouse Integration | BigQuery, Snowflake, Redshift, Databricks |
Query Method | Live warehouse queries (zero-copy) |
Modeling Language | LookML (Git-versioned) |
AI Integration | Google Gemini, LookML Assistant |
Governance | Centralized semantic layer |
4. Microsoft Power BI

Microsoft Power BI stands out as a top-tier self-service analytics platform, seamlessly integrating with Microsoft 365 and Azure. It's particularly suited for organizations that rely heavily on tools like Teams, Excel, and Azure Active Directory in their daily workflows.
AI Capabilities
The flagship AI feature in Power BI for 2026 is Copilot, which allows users to create reports, write DAX measures, and summarize dashboards using simple English prompts. This capability relies on natural language to SQL translation to bridge the gap between users and databases. This makes it a fantastic tool for non-technical users who want to dive into data without needing to master complex formulas. Its natural language query (NLQ) accuracy is rated at 4.1/5 [2], which is solid, though slightly behind ThoughtSpot's 4.6. Alongside its AI capabilities, Power BI also incorporates essential governance features to ensure analytics remain consistent and trustworthy.
Governance Features
Power BI provides comprehensive governance options, including dataflows, certified datasets, and sensitivity labels through Microsoft Purview. Teams can designate specific datasets as certified or promoted, ensuring that users rely on trusted data sources. However, for organizations operating in multi-cloud environments or using non-Microsoft tools, Power BI might feel less adaptable compared to warehouse-native semantic layers.
Warehouse Integration & User Experience
Power BI supports connections to modern data warehouses like Snowflake, BigQuery, Redshift, and Azure Synapse. Its DirectQuery mode enables live connections to these warehouses, although performance can suffer at scale. As a result, many teams opt to import data into Power BI's in-memory engine, working with snapshots rather than real-time data. This trade-off is critical for teams requiring live accuracy, especially when using platforms like Snowflake or Redshift. While DirectQuery provides live access, it may not match the performance of tools specifically designed for warehouse-native operations, such as Querio.
At a cost of $24 per user per month for the Premium Per User plan [3], Power BI is one of the more affordable options available. Its value is particularly strong for teams already embedded within the Microsoft ecosystem.
Feature | Power BI Capability |
|---|---|
Warehouse Integration | Snowflake, BigQuery, Redshift, Azure Synapse |
Query Method | DirectQuery (live) or Import (snapshot) |
AI Tool | Copilot |
NLQ Accuracy | 4.1/5 [2] |
Governance | Certified datasets, Microsoft Purview integration |
Pricing | From $24/user/month (Premium Per User) [3] |
5. Tableau

Tableau continues to lead the way in data visualization in 2026, earning a strong 4.7/5 rating for its ability to combine visual storytelling with exploratory analysis [2]. Here's a closer look at its standout features, including AI tools, governance solutions, and warehouse integration, which together define its self-service capabilities.
AI Capabilities
Tableau's AI toolkit enhances the user experience with features like Tableau Pulse, which sends real-time alerts via Slack or email, and Einstein Copilot, offering suggestions for analysis steps and visualization recommendations. For automating data preparation and modeling, Tableau Next reduces manual efforts with advanced automation. Pricing for Tableau Next starts at $40 per seat per month [3].
Governance Features
Tableau's governance framework is centered around a centralized Data Management system. This system ensures reusable metrics and organization-wide controls, making it scalable for thousands of users [3]. The Einstein Trust Layer adds an extra layer of security with automated data masking and protection for personally identifiable information (PII) - a crucial feature for teams focused on compliance. Additionally, Tableau Prep provides a visual, no-code ETL layer, enabling clean and auditable data flows without requiring engineering expertise.
Warehouse Integration & User Experience
Tableau's integration with modern data warehouses strengthens its real-time analytics capabilities. It connects seamlessly to platforms like Snowflake, BigQuery, Redshift, and Postgres, supporting live query modes to ensure teams always work with up-to-date data. Its drag-and-drop interface is user-friendly and intuitive, but organizations needing a governed, warehouse-native semantic layer - such as the one offered by Querio - may need to build additional integrations to complement Tableau's visualization strengths.
Feature | Capability | Target User |
|---|---|---|
Tableau Pulse | Proactive metric monitoring & Slack/Email alerts | Executives & non-technical users |
Einstein Copilot | Suggested analysis steps & visualization recommendations | Business users & junior analysts |
Tableau Next | Automated data preparation & modeling | Enterprise teams |
Einstein Trust Layer | Automated data masking & PII protection | Admins & compliance officers |
Pricing | From $40/seat/month (Tableau Next) | - |
6. Qlik Sense
Qlik Sense has been a Gartner Magic Quadrant Leader for 13 years straight [5], showcasing its staying power in the analytics space. With over 40,000 customers spanning 100+ countries [5], it has become a go-to tool for modern self-service analytics. Let’s break down what makes Qlik Sense a standout platform for data leaders seeking real-time, governed insights.
AI Capabilities
Qlik Sense takes a layered approach to AI, offering tools that cater to a range of user needs. The Insight Advisor covers the basics with features like chart suggestions, anomaly detection, and natural language queries. In 2026, Qlik introduced Qlik Answers, which brought generative AI into the mix. This feature works with both structured and unstructured data sources - think PDFs, Slack messages, and spreadsheets - while also providing citations for its responses. For teams that want proactive monitoring without building custom alerts, Discovery Agents (launched in May 2025) autonomously scan datasets to flag risks, anomalies, and opportunities.
Governance Features
Governance is a strong suit for Qlik Sense, making it a reliable choice for teams that require strict data oversight. Section Access ensures row-level security, while the AI Trust Score (introduced in July 2025) offers a clear measure of data reliability for AI-driven tasks. Additional features like role-based access controls (RBAC) and lineage tracking help maintain audit trails and ensure consistent metric definitions across departments.
Warehouse Integration & User Experience
Qlik Sense integrates seamlessly with major data warehouses like Snowflake, BigQuery, Redshift, and Postgres, offering over 100 native connectors. Its Open Lakehouse architecture, built on Apache Iceberg, combined with the Associative Engine, allows for non-linear, relationship-based data exploration. The Associative Engine uses a "green/white/grey" paradigm to visually differentiate associated, unassociated, and excluded data points [5], making it easier to navigate complex datasets intuitively.
Feature | Capability | Target User |
|---|---|---|
Qlik Answers | Generative AI for structured & unstructured data with citations | Business users & analysts |
Discovery Agents | Autonomous risk and anomaly scanning without user prompts | Data teams & ops leaders |
Insight Advisor | Natural language queries, chart suggestions, anomaly detection | Non-technical users |
AI Trust Score | Assesses data readiness for AI applications | Data & compliance teams |
Associative Engine | Non-linear, relationship-based data exploration | All users |
Pricing | From $300/month (10 users, 10 GB) | - |
Pricing starts at $300/month for 10 users with 10 GB of storage. The Standard plan scales to $825/month for 25 GB, while the Premium plan - featuring predictive analytics and AutoML - costs $2,750/month [3][4]. Enterprise plans, starting at 250 GB, support large apps of up to 50 GB each [3]. For teams requiring governed, live warehouse analytics, Qlik Sense’s native semantic layer simplifies self-service workflows.
Next, we’ll weigh the pros and cons of these platforms to help you make the best decision.
7. Hex
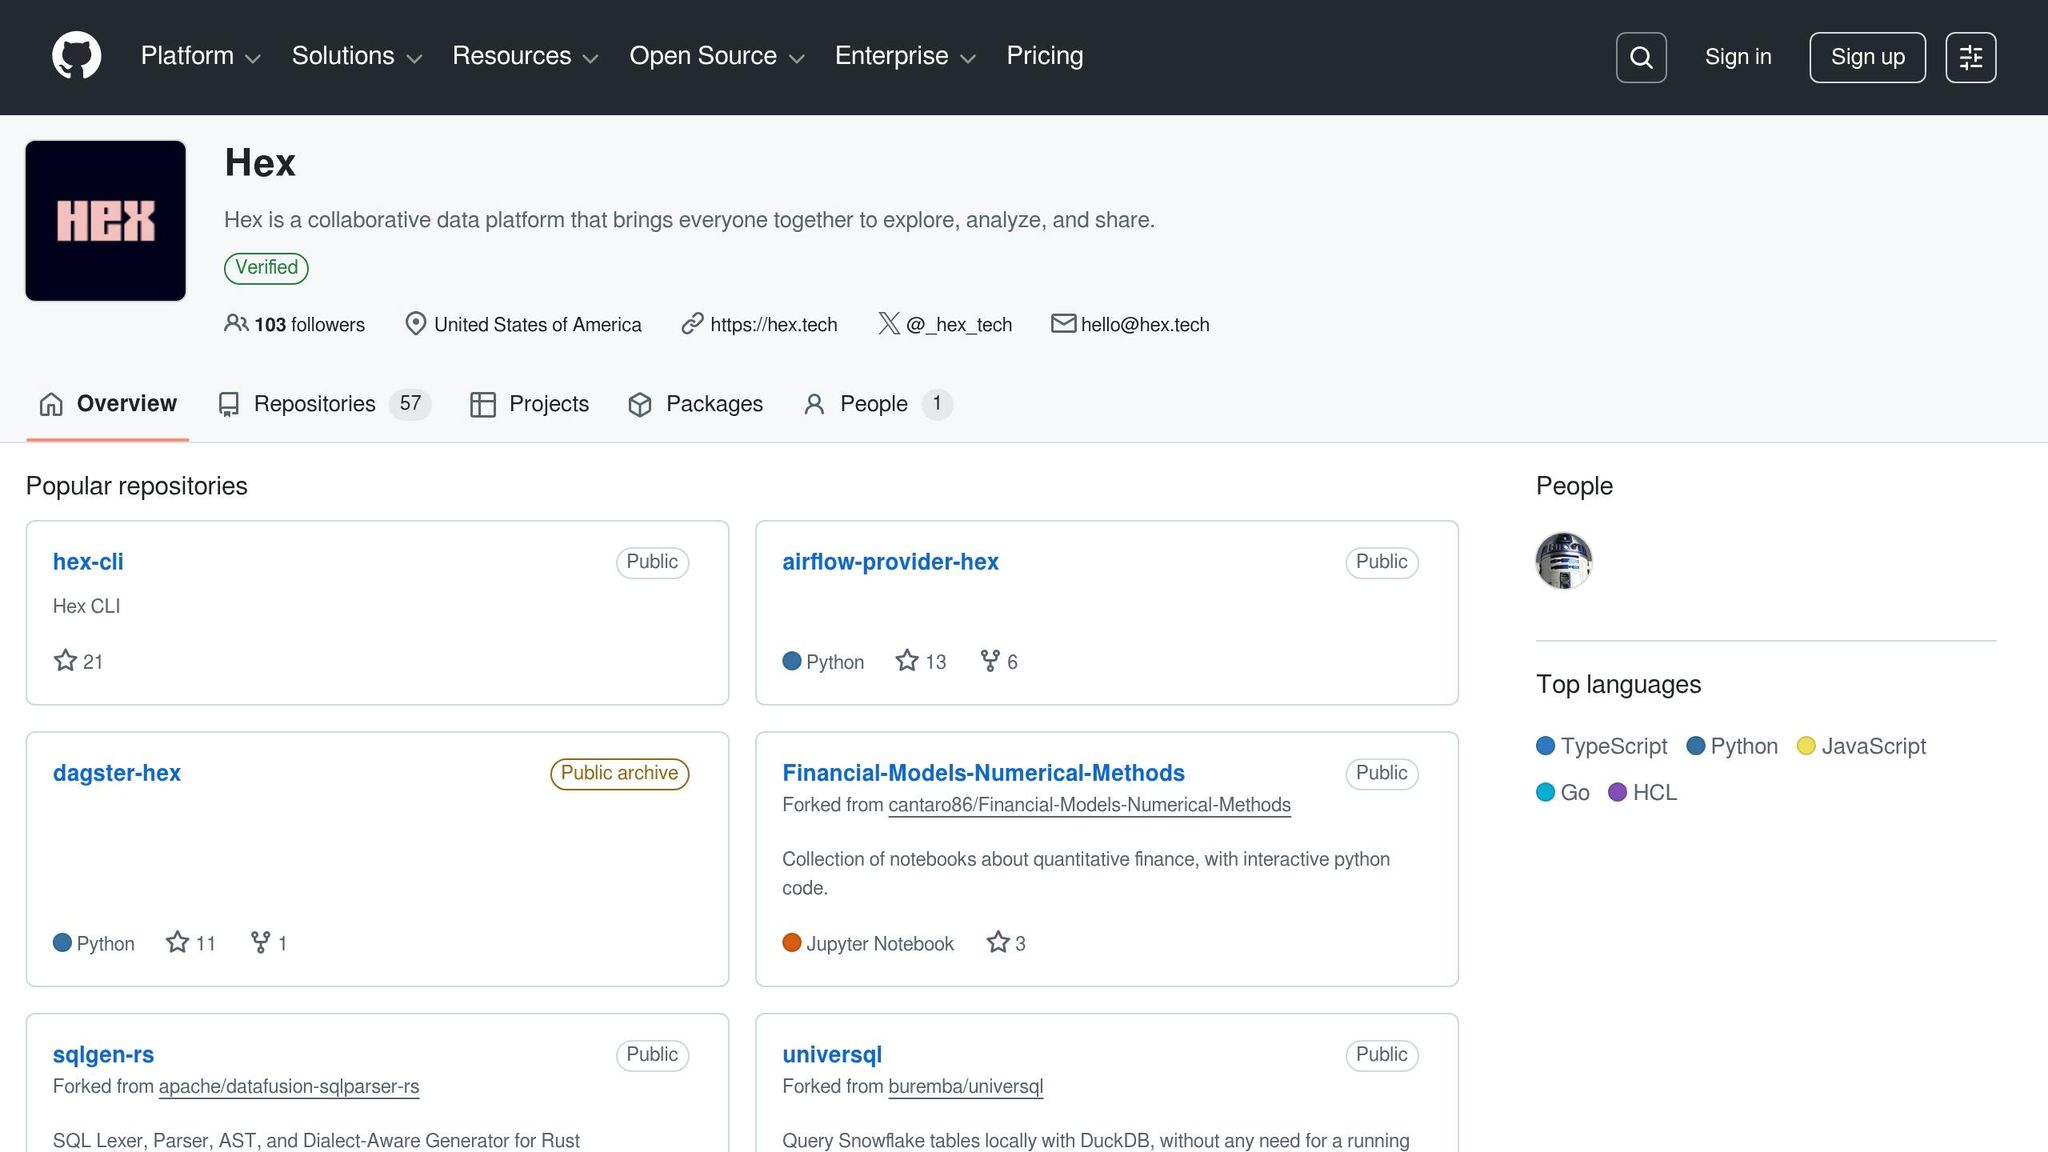
Hex offers a reactive notebook experience that combines coding and no-code visualizations, making it a standout tool for data teams. By allowing SQL and Python to work together in one environment, Hex enables users to seamlessly integrate analysis with storytelling - all within a single platform. This eliminates the need to switch between coding tools and dashboards.
AI Capabilities
Hex's Magic SQL cells bring convenience to analysts by letting them write SQL directly in the notebook interface. The platform then converts these inputs into optimized queries, simplifying the analysis process and speeding up workflows. This feature works seamlessly with Hex's direct connections to data warehouses.
Warehouse Integration & User Experience
Hex is built with a warehouse-native architecture, meaning it runs queries directly on modern data warehouses like Snowflake, BigQuery, Redshift, and Postgres - without requiring any data to be moved. Its polyglot workflow allows users to combine SQL and Python in one reactive document, creating a collaborative and efficient environment for technical data teams. Additionally, this setup ensures transparency and editability for all SQL and Python outputs, aligning well with governed semantic layers.
Feature | Description |
|---|---|
Magic SQL Cells | Write SQL directly in the notebook; Hex translates these into optimized queries. |
Warehouse Connectivity | Live connections to Snowflake, BigQuery, Redshift, and Postgres. |
Notebook Environment | Combines SQL and Python for flexible and comprehensive analysis. |
Hex is an excellent choice for analyst-heavy teams that prioritize a code-first, notebook-driven workflow.
Pros and Cons of Each Platform
This section breaks down the main advantages and drawbacks of each platform to help you make an informed choice. The table below highlights the key features, limitations, and ideal use cases for each tool.
Platform | Key Strength | Main Weakness | Best Fit |
|---|---|---|---|
Querio | Governed semantic layer with inspectable SQL/Python; live connections to Snowflake, BigQuery, and Redshift | High cost (starting at $400/month for 10 users) | Data teams in mid-sized B2B SaaS companies needing governed, self-service analytics with accuracy |
ThoughtSpot | High NLQ precision (4.6/5 rating) [2] and a search interface similar to Google | Requires extensive upfront data modeling with Worksheets | Enterprises ready to invest in data modeling for fast, search-driven insights |
Looker | LookML semantic layer ensuring a single source of truth | Steep learning curve; LookML expertise needed to unlock features | Engineering-led teams on Google Cloud with dedicated BI developers |
Microsoft Power BI | Seamless Microsoft 365 integration; recognized as a Gartner Magic Quadrant Leader for 18 years [5]; affordable entry-level pricing | NLQ accuracy (4.1/5) lags behind search-focused tools; complex analysis requires DAX knowledge [2] | Organizations already using Azure and the Microsoft ecosystem |
Tableau | Known for top-tier visual storytelling (4.7/5 for dashboards) [2] | Lower conversational query accuracy compared to search-first platforms [2] | Teams focused on creating polished, presentation-ready dashboards |
Qlik Sense | Associative engine that uncovers non-linear data relationships | Inconsistent NLQ accuracy (around 50%) and a steeper learning curve [2] | Analysts working with complex, multi-source datasets |
Hex | Reactive SQL and Python notebooks with strong AI code generation for analysts | Not user-friendly for non-technical business users; limited self-service governance | Analyst-heavy teams needing collaborative, code-driven workflows |
Each platform has its own strengths and limitations. The right choice depends on whether your team prioritizes ease of use, advanced visuals, or technical precision.
For instance, AI-driven self-service tools can reduce analysis time by up to 50% [1] when aligned with your team's workflow. A governed semantic layer is ideal for teams with shared metrics, while notebook environments excel in handling rapid, complex analyses.
For B2B SaaS companies with 100–500 employees using Snowflake, BigQuery, or Redshift, tools with lower barriers to entry often lack the governance necessary for consistent metrics at scale. In contrast, more governed solutions, like Looker and Querio, require a deliberate setup process. The distinction lies in whether this setup involves a proprietary modeling language (like LookML) or a shared context layer that non-technical users can access through plain English queries.
These comparisons highlight the trade-offs between governance, usability, and integration, providing a foundation for the final recommendations.
Conclusion
The self-service analytics market is projected to hit $14.01 billion by 2026, with an annual growth rate of 18.4% [2]. When choosing the right platform, the decision goes beyond comparing feature lists. It’s about aligning with your team’s governance requirements, technical expertise, and existing data infrastructure.
Each tool has its niche: Tableau shines in visual storytelling, ThoughtSpot offers search-driven precision, Looker caters to engineering-focused teams on Google Cloud, Power BI integrates seamlessly with Microsoft ecosystems, and Hex supports analyst-heavy, code-centric workflows. For mid-market B2B SaaS companies, however, the challenge lies in more than just picking a tool - it’s about ensuring dependable, governed self-service analytics. This is where Querio steps in.
Mid-market teams, especially those with 100–500 employees using Snowflake, BigQuery, or Redshift, often grapple with maintaining consistent metrics and accessing live data without relying on proprietary modeling languages or a specialized BI engineering team. Querio addresses this by offering a governed semantic layer, live connections to data warehouses, and fully inspectable SQL and Python. This ensures analysts can validate results while business users query data in plain English.
As Mike Krut, Senior Vice President of IT at Penske Transportation Solutions, aptly said:
"AI delivers value when built on curated and governed data." [2]
This highlights the importance of governance maturity over feature count when selecting a platform, making it the critical factor in the decision-making process.
FAQs
Do we need a semantic layer to keep metrics consistent?
A semantic layer is essential for keeping metrics consistent and ensuring everyone operates from a single source of truth. By centralizing business definitions - like metrics, joins, and terminology - it eliminates the risk of conflicting results across teams and tools.
Querio’s governed context layer takes this a step further. It applies versioned logic to all queries and dashboards, ensuring that insights are both reliable and scalable. Instead of relying on assumptions, it uses your defined logic for metrics like revenue or active users. This means you can trust the data driving your decisions.
Can non-technical users query Snowflake or BigQuery in plain English?
Yes, non-technical users can now query tools like Snowflake or BigQuery using plain English, thanks to AI-powered platforms like Querio. These tools translate natural language into SQL or Python, which runs directly on your live data warehouse. Querio also maintains consistent metrics through a governed semantic layer, while giving analysts the option to review and edit the generated code. This empowers business users to explore and analyze data on their own, without requiring advanced technical expertise.
How do we choose between live queries and imported snapshots?
When you need real-time results and want to execute AI-generated SQL or Python directly on your data warehouse (like Snowflake, BigQuery, Redshift, or Postgres), go for live queries. This approach avoids duplicating data and ensures a self-serve experience with consistent metrics, thanks to a semantic layer.
If you're okay with using slightly outdated data and prioritize speed, choose imported snapshots instead. These rely on precomputed datasets for quicker access. By default, Querio uses live connections with built-in governance to deliver reliable insights.
Related Blog Posts


