Business Intelligence
What Makes Great Embedded Analytics UX
Design principles for embedded analytics UX: consistency, integration, performance, security, and personalization for fast, trusted insights.
Embedded analytics integrates insights and visualizations directly into software, making data accessible where decisions happen. A great user experience (UX) is critical for its success, ensuring users trust the data, engage consistently, and make informed decisions. Here's what matters most:
Consistency: Match the design language with the app's style to reduce friction.
Clarity: Avoid clutter; use white space, simple colors, and accessible designs.
Integration: Embed analytics seamlessly into workflows to save time and boost efficiency.
Flexibility: Offer role-based views, self-service tools, and real-time data access.
Performance: Minimize latency with caching and optimized queries.
Security: Protect data with robust authentication and governance.
Personalization: Enable users to customize dashboards and explore data interactively.
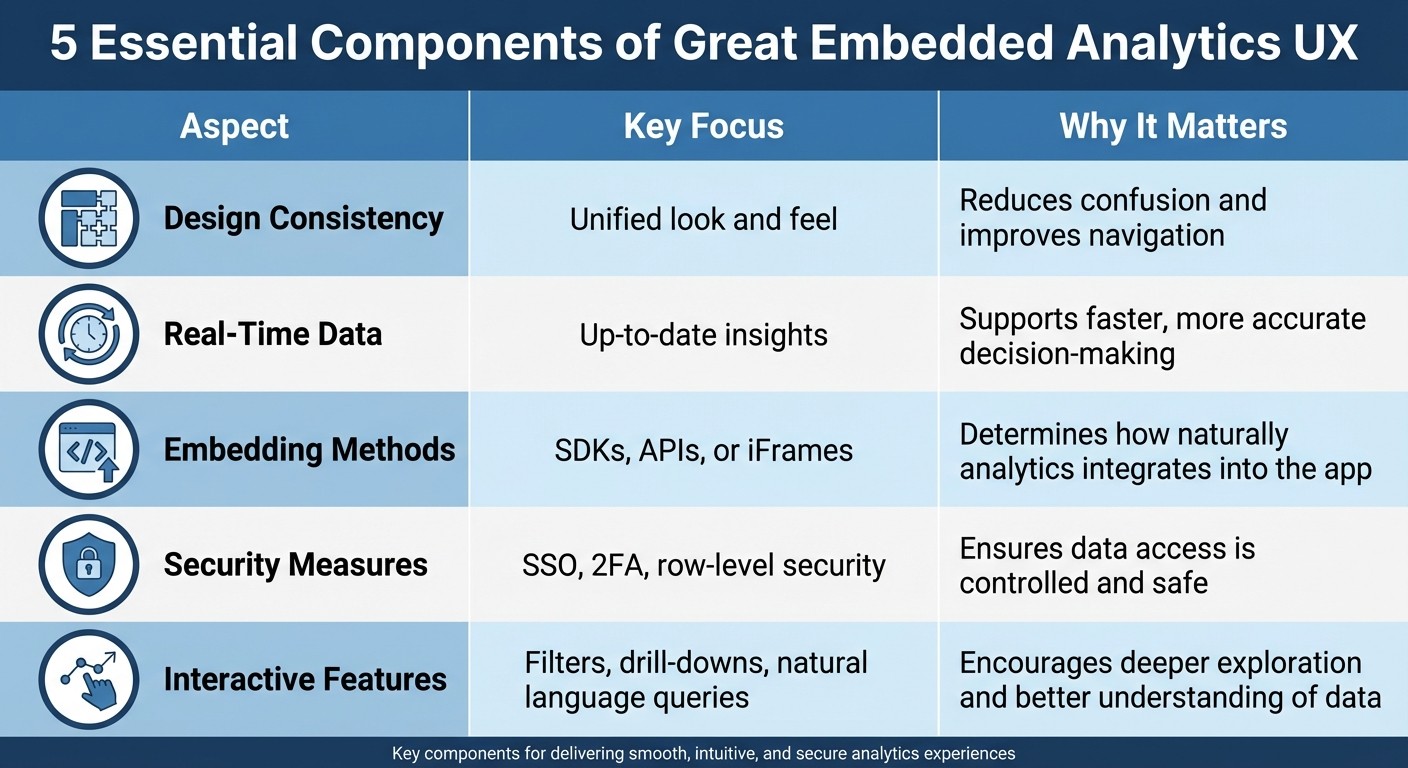
Quick Comparison:
Aspect | Key Focus | Why It Matters |
|---|---|---|
Design Consistency | Unified look and feel | Reduces confusion and improves navigation. |
Real-Time Data | Up-to-date insights | Supports faster, more accurate decision-making. |
Embedding Methods | SDKs, APIs, or iFrames | Determines how naturally analytics integrates into the app. |
Security Measures | SSO, 2FA, row-level security | Ensures data access is controlled and safe. |
Interactive Features | Filters, drill-downs, natural language queries | Encourages deeper exploration and better understanding of data. |
Delivering a smooth, intuitive, and secure analytics experience ensures users trust the insights and engage effectively. Querio exemplifies this by connecting directly to modern data layers, maintaining consistency, and optimizing performance for reliable, real-time insights.
5 Essential Components of Great Embedded Analytics UX
Embedded Analytics: What it is, Methods, & Examples [GoodData Webinar]
Principles of Clear Interface Design
A well-designed interface can make or break how users interact with embedded analytics. Here's a striking fact: 88% of customers won't return after experiencing poor user design [2]. This makes it essential to focus on creating an interface where analytics feel like a natural part of your application.
Consistency in Design Language
Aligning your analytics interface with your application's visual style is key to reducing friction. When typography, colors, and component behaviors match, users can navigate charts and filters without hesitation. In fact, switching between inconsistent interfaces can cost employees 1–2 hours every week [4]. A consistent design eliminates this inefficiency, offering a unified experience.
"Consistent design is intuitive design. It should be immediately obvious to the user how to accomplish whatever they want to do." - Vidisha V, Sisense Employee [1]
For example, keep filtering and exporting actions in the same spots as your app’s existing controls. This keeps workflows smooth and avoids the frustration of hunting for tools across different interface layers [1].
White-Labeling for Custom Branding
White-labeling lets your analytics feel like an integral part of your product rather than an outside addition. By removing third-party branding, you reinforce your product identity, building trust and loyalty among users [1]. It’s no wonder 96% of surveyed project managers and executives agree that embedded analytics boosts revenue growth [4].
To achieve this, follow your corporate brand guidelines. Customize font families, text colors, and visualization palettes to match your brand [1]. Many of the best embedded analytics platforms offer drag-and-drop features for quick adjustments, minimizing the need for heavy development work [1].
Avoiding Visual Clutter
A clean and simple interface keeps users focused on the data, not distracted by unnecessary design elements. Stick to a maximum of three primary colors, using shades to show variation rather than introducing new colors [2]. Skip excessive grid lines, icons, patterned backgrounds, or decorative effects that don’t add value to the data [2].
Use white space generously to separate charts and metrics clearly [3]. Tooltips and popovers can provide additional details when users hover or click, keeping the main view easy to scan [2]. For accessibility, ensure a contrast ratio of at least 4.5:1 for text that’s 18pt (24px) or smaller [2].
"Your unique branding is one of the things that sets you apart from competitors, but designing an original graph that's very hard to read isn't the solution." - Rogan Sage, Author, Embeddable [2]
Integration into User Workflows
Analytics should work with your tasks, not feel like a roadblock. When users constantly switch between different applications, it can add up to nearly five weeks of lost productivity each year [6]. That’s why weaving analytics directly into existing workflows is essential - it boosts both adoption and efficiency. Let’s break down how to make this integration as smooth as possible.
Embedding Methods for Flexibility
How you embed analytics shapes how naturally it blends into your application. Each method comes with its own trade-offs:
iFrames: Quick to set up but limited in customization. They often feel detached, like a separate window within your app.
Web Components: Offer a middle ground - decent flexibility with a moderate level of development effort.
JavaScript or React SDKs: Require more technical expertise but deliver a seamless, native experience with high customization.
API-Only: Grants total control over the integration but demands significant development resources.
The right choice depends on your priorities. If creating an organic, integrated feel is your goal, SDKs are worth the extra time and effort.
Real-Time Data Access
Real-time access to data ensures users always see up-to-date information without needing manual refreshes. In fact, 87% of application providers say embedded analytics is a key feature for their users [4]. By connecting directly to data warehouses, you can maintain consistency across platforms - whether it’s a web app, mobile interface, or another touchpoint - without relying on separate serving databases [6].
Real-time data also unlocks advanced features like:
Linking: Clicking on a chart to navigate to a related page.
Write-Backs: Editing data in a report to update the database directly.
Actionable UI Elements: Selecting parts of a chart to trigger specific actions within the app [5].
These capabilities not only enhance functionality but also build user trust by ensuring information is always current.
Minimizing Latency for Smooth Performance
Even with real-time data, performance is key. High latency can derail the efficiency gains of embedded analytics. Standard data warehouses aren’t always optimized for the low-latency, high-concurrency demands of end users. This is where advanced caching through a semantic layer comes in - it stores frequently used results, speeding up response times [6]. Additionally, optimizing query structures ensures faster processing and keeps the interface responsive.
Slow-loading analytics can negate the benefits of embedding them in the first place [8]. Techniques like preloading resources and consolidating iFrames can cut down on load times and reduce server strain [7]. By focusing on performance, you ensure a smooth, frustration-free user experience.
Personalization and Self-Service Analytics
Imagine turning analytics from a passive reporting tool into an active, decision-making powerhouse. By enabling users to explore data on their own terms, you can transform how decisions are made. When analytics are tailored to suit individual roles and skill levels, users encounter less friction and build greater trust in the system. This personalized approach, combined with seamless integration, enhances decision-making across the board. In fact, embedded analytics usage jumped from 33% to 58% in 2022 alone [11].
Role-Based Customization
Customizing analytics based on roles ensures users only see what’s relevant to them. For instance, a sales manager might focus on pipeline metrics, while a finance director zeroes in on budget variances. This role-specific approach not only reduces information overload but also strengthens security. By using signed embedding, user permissions and attributes can be securely passed through a URL. This method adheres to the principle of least privilege, preventing unauthorized access without requiring separate logins [9].
Different users also need different tools. Technical users might prefer diving into data with SQL, while non-technical users benefit from intuitive drag-and-drop widgets or natural language queries [2][10]. Organizing dashboards into categories - operational (for immediate tasks), strategic (for long-term trends), and analytical (for deep dives) - further aligns with how users work. Progressive disclosure, where complex details are revealed only when needed (like on hover or drill-down), keeps interfaces clean while maintaining depth [2][11].
Interactive Features for Deeper Insights
Static reports can only take you so far. Interactive features, on the other hand, encourage deeper exploration. Dynamic filters let users refine data by date, category, or custom parameters [11]. Drill-downs and linked dashboards make it easy to move from high-level summaries to granular details [11][12].
"Dashboards don't have to be impressive or amazing, they have to be efficient."
– Bilyana Petrova, Embedded Analytics Content Specialist, Reveal BI [11]
Advanced tools like time-series forecasting and outlier detection help uncover patterns that might otherwise be missed [11]. Features like annotations let users add context directly to charts, promoting collaboration and storytelling. By balancing power with simplicity, these tools help users answer critical business questions in seconds [12]. The result? Clearer insights and stronger confidence in the data.
AI-Driven Natural Language Queries
Not everyone is fluent in SQL, and that’s where natural language processing (NLP) steps in. With NLP, users can ask straightforward questions like, “What were our top five customer complaints last quarter?” and get accurate, governed results [13]. This technology makes analytics accessible to everyone - from sales reps to HR managers - without requiring technical know-how.
AI doesn’t stop at simple queries. Automatic data profiling highlights relevant information [13]. Machine learning can uncover trends that traditional methods might miss [13]. Meanwhile, headless analytics allows developers to control the frontend experience while relying on powerful AI-driven logic in the backend [10]. Of course, AI is only as good as the data it processes, so clean, well-formatted data is a must [13]. By integrating AI-driven self-serve analytics creates a more responsive and tailored experience for all users.
Performance, Scalability, and Security
A sleek analytics interface means little if it’s slow, crashes under load, or risks exposing sensitive information. Performance, scalability, and security are the cornerstones of a reliable user experience. When users encounter delays or worry about data safety, trust erodes quickly. These technical elements ensure a seamless and dependable experience, keeping users engaged and confident.
Optimizing for Scalability
Handling massive datasets and accommodating high user demand requires smart architectural choices. Decisions about data modeling - whether to use Import (in-memory), DirectQuery (real-time), or Composite modes - have a direct impact on system speed. For instance, partitioning large tables by attributes like date or region can significantly reduce query times, cutting latency from 6–8 seconds to under 2 seconds in enterprise scenarios [15]. Similarly, incremental refresh can shrink refresh times for datasets with 100 million rows from over an hour to just 5–10 minutes [15].
On the frontend, techniques like preloading APIs, reusing single iFrames, and pre-aggregating data can slash query response times by up to 60%, while also preventing browser memory issues [15][7]. Additionally, adopting a star schema instead of a snowflake structure simplifies relationships and speeds up query execution for large-scale operations [15].
While these performance enhancements keep the system running smoothly, ensuring strong security measures further strengthens user trust.
Data Security and Governance
Security is non-negotiable when it comes to building user confidence. Implementing multi-layered authentication - such as SSO, SAML, and 2FA - along with signed embedding using JWT and row-level security ensures users can only access the data they’re authorized to see [9][14][5].
"The act of embedding a single dashboard or visualization into a single webpage is quite simple, but a well-engineered integration requires handling other things such as authentication, authorization, content management, and performance." – Tableau Embedded Analytics Playbook [14]
For customer-facing analytics, it’s wise to host external data on separate instances from internal analytics, reducing the risk of accidental exposure [9][16]. Use dedicated service accounts with minimal privileges, secure embed secrets and API keys as if they were admin credentials, and limit embed session durations to only what’s necessary [9][16].
With performance and security in place, the next step is ensuring a seamless experience across all devices.
Responsive Design Across Devices
Today’s users frequently switch between desktops, tablets, and smartphones, expecting a smooth experience regardless of the device. Responsive design ensures analytics interfaces adjust effortlessly to different screen sizes while maintaining clarity and functionality [5]. Features like touch-friendly controls make navigating analytics on mobile devices feel natural [5]. Flexible layouts that adapt column widths and font sizes create a consistent experience across platforms.
Imagine a sales manager checking pipeline metrics on their phone during a client meeting with the same ease they’d have at their desk. That’s the essence of excellent embedded analytics UX - consistent, intuitive, and device-agnostic, aligning perfectly with the principles of seamless integration and user-focused design discussed earlier.
Querio's Approach to Embedded Analytics UX
Querio integrates its advanced architecture with essential design principles to create a seamless embedded analytics experience. By combining live data connections, a governed semantic layer, and reusable logic, Querio delivers real-time insights that are both reliable and efficient. This ensures users can access accurate data without dealing with the headaches of duplication or inconsistent metrics.
Live Connections to Data Warehouses
Querio connects directly to Snowflake, BigQuery, and Postgres, bypassing the delays and errors often caused by traditional ETL processes. Your data remains securely stored within your current infrastructure, while Querio uses read-only service accounts with RSA Key-Pair authentication (2048-bit or 4096-bit) to maintain security. This setup ensures a single source of truth across all dashboards and reports, so the metrics your users see always match the data in your warehouse.
To enhance performance, Querio implements query caching to reduce load times and lower costs. Features like Snowflake's "quick resume" further minimize latency. You can adjust cache windows to suit your needs - shorter durations (5–15 minutes) for real-time monitoring and longer ones for static reports.
Governed Semantic Layer
Querio's context layer simplifies complex technical table names into business-friendly terms, ensuring that everyone - whether internal analysts or external users - works with consistent definitions. This eliminates discrepancies in calculations for key metrics like "Monthly Recurring Revenue" or "Customer Lifetime Value." According to research, 91% of business leaders believe democratizing access to analytics is critical for software success, with data-driven companies reporting 77% revenue growth compared to 61% for those that aren't [17].
This semantic layer also powers Querio's AI capabilities. By offering Large Language Models a structured framework, it ensures natural language queries yield precise and governed results instead of inaccurate or misleading outputs. For instance, when a user asks a question in plain English, the AI translates it into SQL using the pre-defined joins and metrics in the context layer.
Reusable Analytics Logic
With Querio, analytics logic is defined once and applied universally across dashboards, reports, and embedded solutions. This eliminates the repetitive task of recreating calculations for different interfaces. When a metric is updated in the semantic layer, the change automatically applies to all embedded instances, maintaining consistency at scale.
For high-demand environments, Querio can pre-aggregate frequently used metrics within the context layer. By generating and caching summary tables, it ensures instantaneous results during peak usage while reducing the load on your data warehouse. This approach keeps analytics fast, responsive, and aligned with user expectations.
Conclusion
Creating a great embedded analytics user experience isn't just about piling on features - it’s about delivering tools that feel intuitive, reliable, and fast. A clean interface design reduces visual clutter and ensures consistency across all interactions. Analytics should blend seamlessly into workflows, while role-based customization and AI-powered queries meet the growing demand for self-service capabilities - something 88% of customers now expect [18]. But even the most polished interface falls short if performance is sluggish or security is compromised. In fact, 94% of buyers will abandon a SaaS platform if it doesn’t guarantee robust data protection [18].
The financial implications of getting it right - or wrong - are huge. Data-driven companies see 77% revenue growth compared to 61% for their peers, and the cost of a data breach averages $4.88 million [17]. These stats underscore the need for embedded analytics to deliver on three fronts: speed, scalability, and security.
"Access to actionable insights empowers smarter, faster decision-making. Leaders across industries are recognizing this and moving fast to prioritize data democratization."
Casey Ciniello, Embedded Analytics Expert, RevealBI [17]
Querio’s approach is built on this principle of actionable insights. By leveraging live warehouse connections, a governed semantic layer, and reusable logic, Querio ensures a single source of truth across all analytics. Its context layer translates complex technical schemas into terms that are easy for business users to understand, empowering both human analysts and AI tools with consistent, accurate metrics. Define a metric once, and it applies everywhere - whether it’s in dashboards, reports, or embedded analytics - so scaling doesn’t come at the cost of consistency.
At its core, Querio’s platform is designed to help data-driven teams make confident decisions. By combining speed, strong governance, and flexibility, Querio delivers analytics that are intuitive and trustworthy, ensuring users can rely on the insights they need to act decisively.
FAQs
Why is consistent design important for creating great embedded analytics experiences?
Consistency in design plays a key role in delivering an intuitive embedded analytics experience. When visual elements, navigation, and interaction patterns are aligned, users can easily understand how to use the tool without needing to re-learn processes. This not only lightens the mental effort required but also helps users complete tasks more quickly while boosting their confidence in the tool's dependability.
Beyond usability, a consistent design ensures embedded analytics feel like a seamless part of the host application, rather than a disconnected feature. Matching colors, fonts, and styles with the main product creates a cohesive look and feel, reinforcing the brand's identity and keeping users focused on their work. This harmony encourages better user engagement and paves the way for quicker, more informed decision-making.
What are the advantages of using real-time data in embedded analytics?
Integrating real-time data into embedded analytics ensures users always have the latest insights at their fingertips, empowering faster and more confident decisions. Dashboards automatically update, keeping information fresh, relevant, and ready to act on.
It also boosts user engagement by offering context-aware analytics right within their existing workflows. This smooth integration allows users to stay focused on their tasks while gaining timely, data-driven insights that align perfectly with their specific needs.
How does role-based customization improve the user experience in embedded analytics?
Role-based customization takes embedded analytics to the next level by tailoring the experience to fit the unique needs and responsibilities of different user groups. Whether it's sales reps, finance analysts, or operations managers, this approach ensures that users see only the metrics, visualizations, and tools that matter most to them - cutting out unnecessary clutter.
This targeted design not only lightens the mental load but also helps users make decisions faster and use the tools more often. For instance, a sales rep might get quick access to pipeline trends, while a finance analyst focuses on cash flow forecasts. By aligning the interface with each user's workflow, role-based customization creates a smooth, intuitive experience that feels personal and well-integrated, encouraging better engagement and driving stronger results for the business.
Related Blog Posts


