Business Intelligence
Tableau Pulse vs ThoughtSpot Sage vs Querio: 2026 Comparison
Compare Tableau Pulse, ThoughtSpot Sage, and Querio on NLQ, governance, live warehouse access, and setup to find the right BI fit.

Here’s the short answer: I’d pick Tableau Pulse for KPI updates, ThoughtSpot Sage for search-led self-serve, and Querio for governed analysis on top of the warehouse.
If you want the same revenue, churn, or MRR number to match across teams, the big issue is not just AI chat. It’s how each tool handles metric definitions, permissions, live warehouse queries, SQL visibility, and setup time.
At a glance:
- Tableau Pulse: best for Tableau-first teams that want KPI summaries and metric stories
- ThoughtSpot Sage: best for larger teams that want search-driven answers across the business
- Querio: best for 100–500-person teams that want warehouse-native self-serve with inspectable SQL and Python
This comparison looks at seven things that shape day-to-day use:
- Natural-language accuracy
- Speed to answer
- Governance and access controls
- Shared metric definitions
- Live warehouse access
- Question-to-action workflow
- Setup and maintenance cost
The pattern is simple. Pulse is narrow but fast. Sage is broad but needs more modeling. Querio gives more visibility into what ran. That matters when finance, RevOps, and product all need one number they can check.
::: @figure 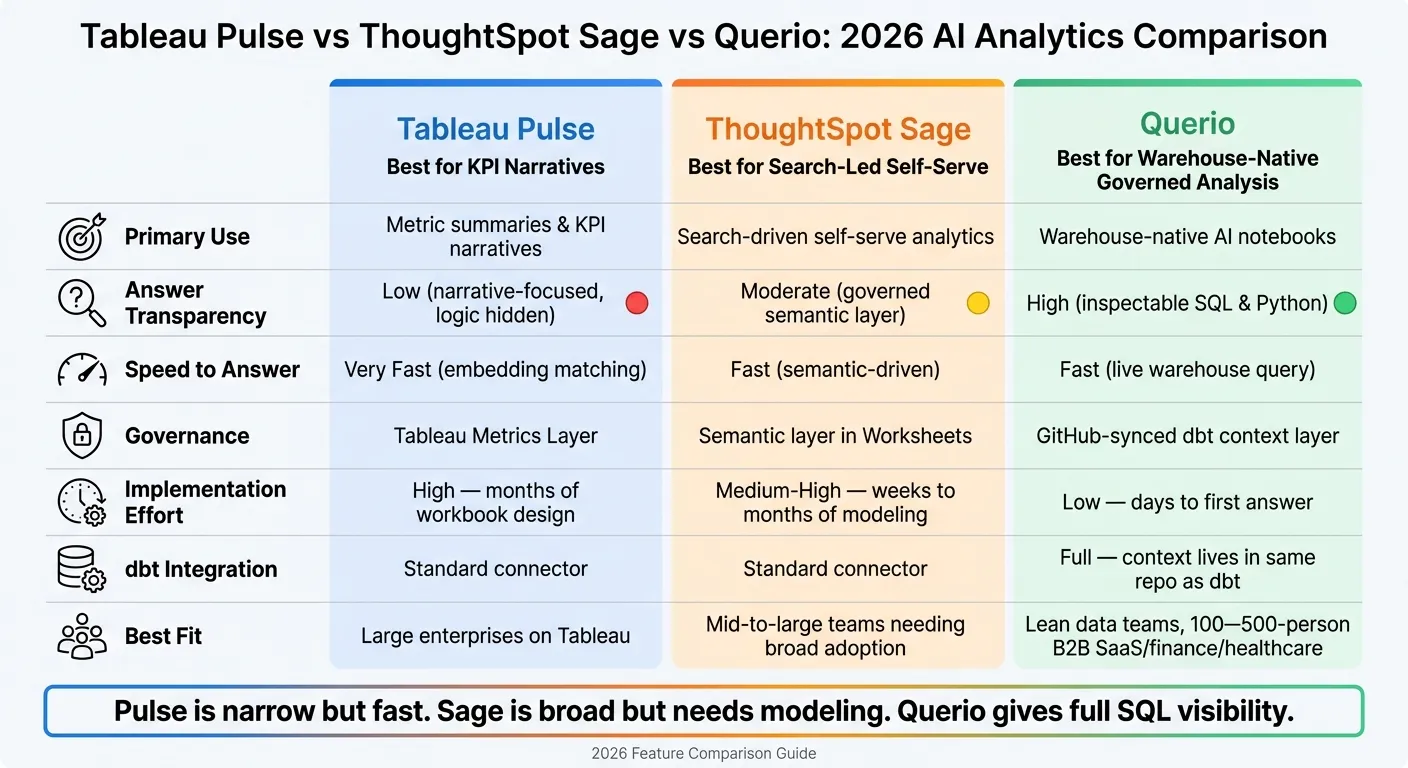 {Tableau Pulse vs ThoughtSpot Sage vs Querio: 2026 Feature Comparison}
:::
{Tableau Pulse vs ThoughtSpot Sage vs Querio: 2026 Feature Comparison}
:::
Thoughtspot Vs Tableau | Which Business Intelligence Software Is Better? (2026)
::: @iframe https://www.youtube.com/embed/Y5XlosSPy9E :::
sbb-itb-284a532
Quick Comparison
| Tool | Best for | Main strength | Main limit | Setup |
|---|---|---|---|---|
| Tableau Pulse | Tableau-first KPI tracking | Fast metric summaries tied to modeled KPIs | Weak for analysis outside pre-built metrics | Higher |
| ThoughtSpot Sage | Search-led self-serve at larger companies | Strong search experience with semantic controls | More lift if modeling is not in place | Medium to high |
| Querio | Warehouse-native governed self-serve | Inspectable SQL/Python and dbt-aligned context | More notebook-led than search-first | Lower |
If you’re choosing between these three, I’d use one filter: Do you need KPI narratives, search answers, or governed warehouse-native analysis? (which relies on semantic context for accuracy) That one question gets you close to the right pick fast.
Side-by-side comparison across the criteria that matter
The table below turns those criteria into day-to-day tradeoffs. What matters most is simple: which system fits how your team already works? This is where the three options split in a clear way: KPI narratives, search-led answers, or warehouse-native analysis.
| Criterion | Tableau Pulse | ThoughtSpot Sage | Querio |
|---|---|---|---|
| Primary use | Metric summaries and KPI narratives | Search-driven self-serve analytics | Warehouse-native AI notebook and self-serve analytics |
| NLQ maturity | High - metric-centric, embedding matching against modeled metrics | High - search-first, AI-assisted | Moderate - notebook-centric, with editable SQL and Python |
| Answer transparency | Low - narrative-focused, underlying logic is hidden | Moderate - governed semantic layer | High - every answer is inspectable SQL and Python |
| Speed to answer | Very fast - embedding matching against modeled metrics | Fast - semantic-driven | Fast - direct live warehouse query |
| Governance | Tableau Metrics Layer | Semantic layer in Worksheets | GitHub-synced context layer, built around dbt |
| Live warehouse access | Yes - standard connectors | Yes - Snowflake, BigQuery, and other major warehouses | Yes - Snowflake, BigQuery, Redshift, and Postgres |
| dbt integration | Standard connector | Standard connector | Full - context lives in the same repo as dbt |
| Workflow depth | Pre-modeled metrics only | Search plus proactive Spotter agent | Notebook, dashboard, Slack, and automations |
| Implementation effort | High - months of workbook design | Medium-high - weeks to months of modeling | Low - days to first answer |
| Best fit | Large enterprises standardized on Tableau | Mid-to-large teams needing broad business adoption | Lean data teams, warehouse-native dbt users |
Natural-language analytics, speed to answer, and answer transparency
Tableau Pulse handles NLQ in a different way from most tools. Instead of writing SQL from scratch for each question, it matches a user's question to pre-defined metrics with embeddings. That keeps answers fast and cuts hallucinations. The catch? Users can only work with what has already been modeled. If a metric doesn't exist in the Tableau Metrics Layer, Pulse won't show it.
ThoughtSpot Sage pushes further with the Spotter agent. It can handle multi-step queries, flag anomalies on its own, and suggest follow-up questions before a user asks them. When AI is paired with a strict semantic layer, natural-language query errors can drop by as much as two-thirds compared with direct text-to-SQL methods [1].
Querio goes another way. Every answer is produced as plain SQL and Python inside a reactive notebook. When the SQL changes, charts update on their own, so analysts can inspect any answer and see what actually ran. That level of visibility matters when finance and RevOps need to agree on the same number.
Governance, semantic context, and live warehouse access
The main issue isn't whether these tools connect to the warehouse. They all do. The bigger issue is how semantic layers in business intelligence keep metrics and permissions in sync.
Tableau handles this through its Metrics Layer. ThoughtSpot relies on its semantic layer and permission controls.
Querio uses a data-as-code setup. Joins, metric definitions, and trusted queries live as SQL, Markdown, and Python in the same GitHub-synced dbt repo. The agent can suggest what it learns, but only logged-in users can approve and commit changes. For teams already using dbt on Snowflake, BigQuery, or Redshift, that keeps metric logic close to the warehouse instead of burying it inside the BI layer.
Workflow depth and implementation cost
Tableau Pulse works well at the top of the funnel: executive KPI summaries, metric narratives, and scheduled digests. But that's also where it starts to taper off. If someone wants to dig into data that hasn't been pre-modeled, they still need to jump back into the broader Tableau setup.
ThoughtSpot Sage covers more ground. The Spotter agent can watch for anomalies and surface insights on its own, which shortens the gap between "something changed" and "someone noticed." The tradeoff is setup time. Implementation can take weeks to months, depending on how much semantic modeling is already in place.
Querio has a lighter setup, which means a data team can connect a warehouse and get first answers in days instead of months. From there, the workflow keeps moving: a Slack question can spin up a real notebook in the app, anomaly automations can check root causes before the team logs in, and dashboards are built straight from notebooks. For lean teams, that means less maintenance work. And when you're trying to move from answer to action, that gap can make all the difference.
Where Tableau Pulse fits best in 2026
Tableau Pulse works best for teams that already run on Tableau Cloud or Tableau Server and want KPI updates from a trusted Metrics Layer without opening a dashboard every morning. On the points that matter most here, Pulse stands out for fast KPI delivery and falls behind on deeper exploration.
Best use cases: KPI monitoring, executive updates, and metric narratives
So where does it shine? Pulse is a good fit for teams that need routine, executive-facing metric updates. It’s at its best with executive KPI digests and recurring status updates.
One of the main draws is Data Headlines - short, AI-generated summaries that explain what changed and why - shown inside the Tableau workflow or through Slack. Pulse also maps questions to modeled metrics, which helps keep answers fast and consistent [2].
Where Tableau Pulse falls short for deeper self-serve analysis
The tradeoff is pretty simple: Pulse gets its speed and ease from staying inside a pre-modeled metric set. That also limits it. Pulse is weak for exploratory analysis when the data hasn’t been modeled ahead of time [2].
If a metric isn’t already defined in the Metrics Layer, users have to leave Pulse and move into analyst-led work or broader Tableau analysis. In plain English, Pulse is a monitoring layer, not a full self-serve analysis environment.
Where ThoughtSpot Sage fits best in 2026
Sage tends to fit best when a company already has a well-built semantic layer in Snowflake, BigQuery, Redshift, or Databricks and wants a search-first way for non-technical users to get answers. In plain terms, it works best for large teams that don't want every question to bottleneck at the data team.
Best use cases: search-driven self-serve and broad business adoption
Sage shines when executive KPI exploration needs to reach people who aren't going to write SQL. That's where the search-led setup starts to pay off, especially in large deployments where getting people up and running fast matters.
A good example is WEX Field Service Management. The company rebranded Spotter as "AssistIQ," hit a 65% AI adoption rate within 90 days, and reduced report generation times from five-minute timeouts to under three seconds [3].
Tradeoffs for mid-sized teams with lean data resources
The catch is pretty simple: Sage is much easier to justify when the semantic layer is already in good shape. If the modeling work is still uneven, the lift can feel heavy. Sage also gives users only limited SQL transparency (see how ThoughtSpot and Querio compare on technical depth), even with Query Inspector, and its enterprise pricing can be tough for smaller teams to support.
Where Querio fits best in 2026
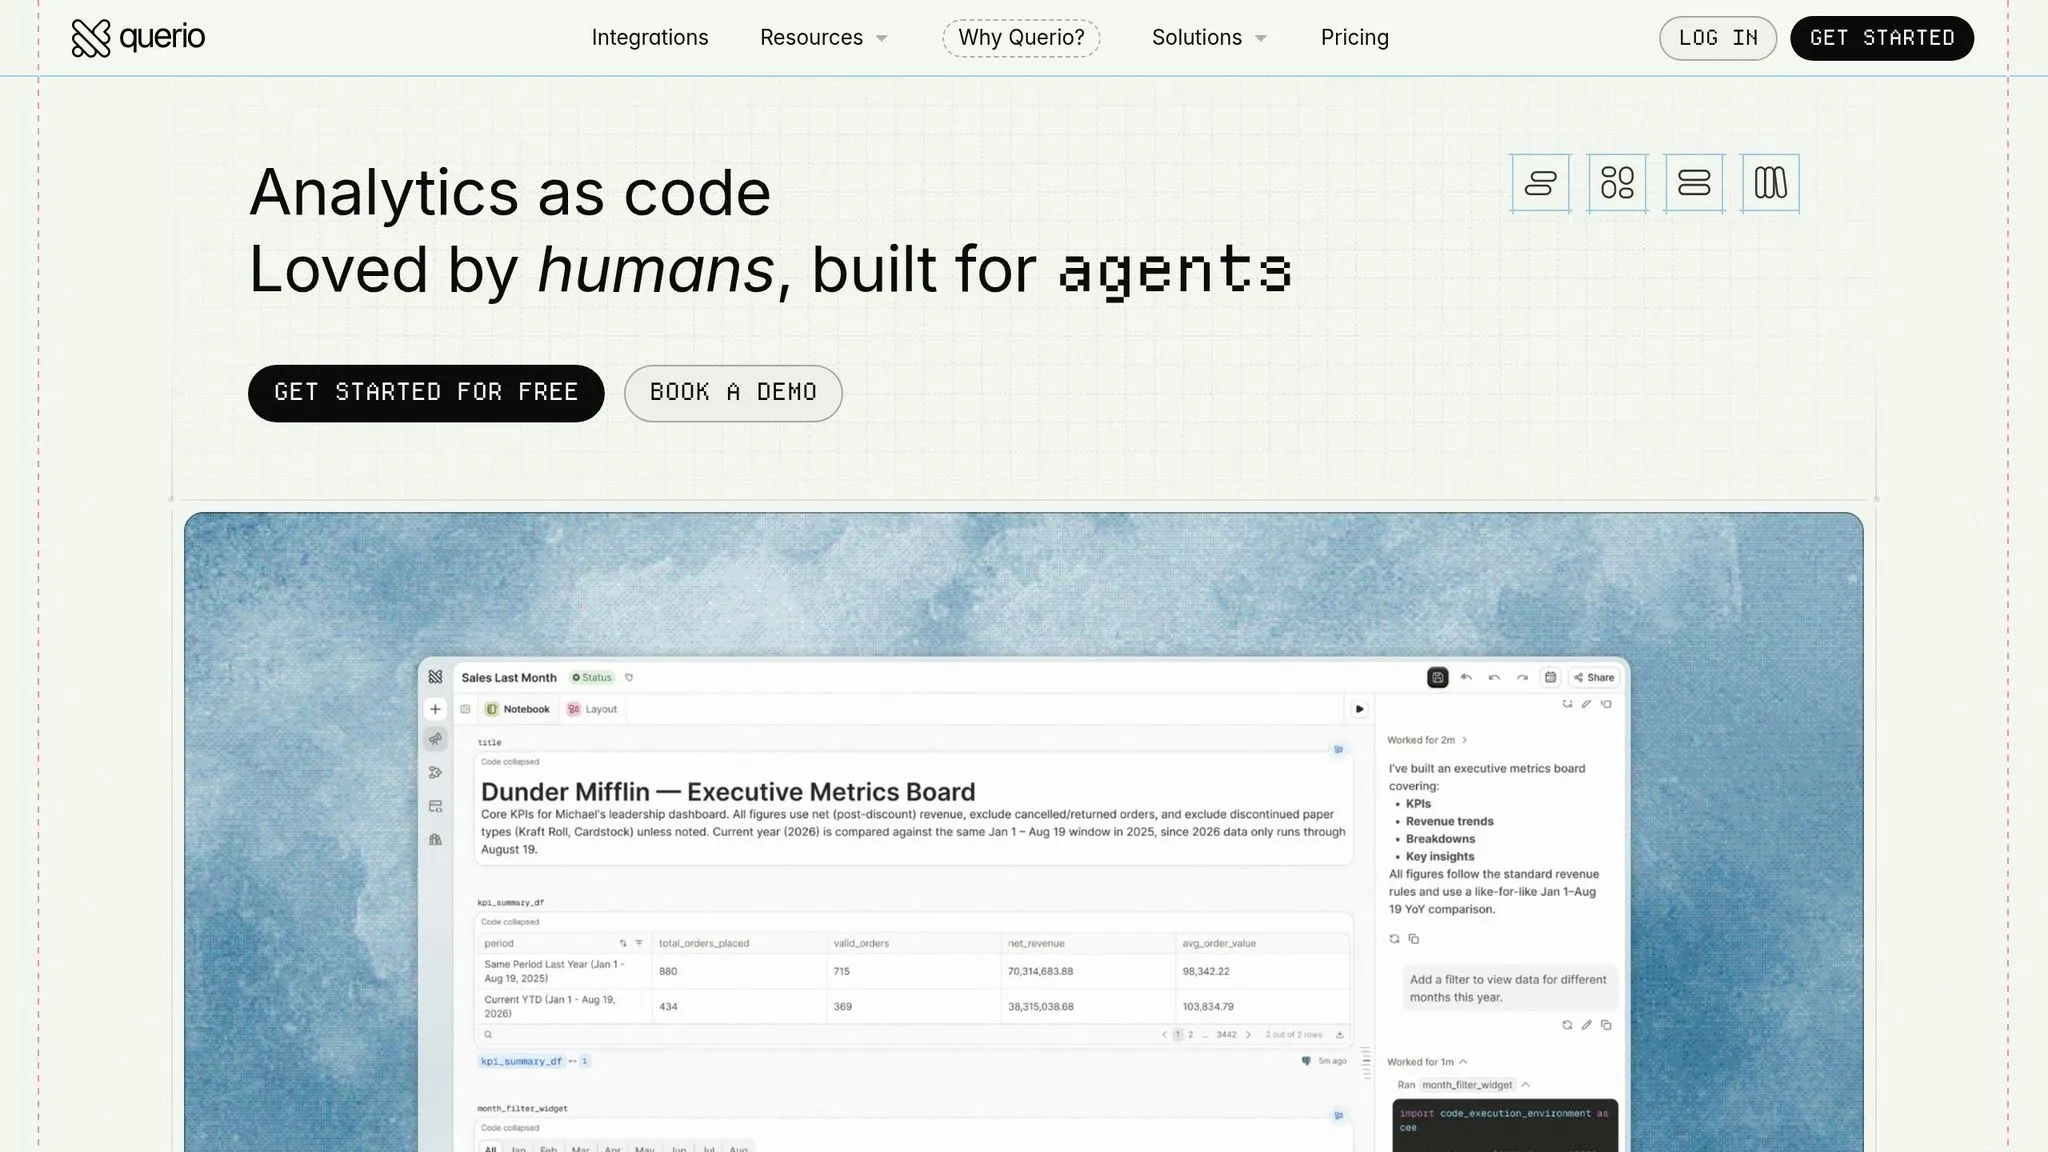
Querio fits best for teams that want governed self-serve without pulling analytics out of the warehouse.
It’s a strong match for 100–500-employee B2B SaaS, healthcare, and finance teams that already run a live warehouse like Snowflake, BigQuery, Redshift, or Postgres and want self-serve access without giving up SQL-level visibility. It’s built for lean data teams that are tired of being the manual go-between for the warehouse and the business, but still need governance, audit trails, and live warehouse access.
Best use cases: analyst handoff, Slack questions, anomaly follow-up, and governed self-serve
A common flow starts in Slack or Teams. Someone asks a churn or revenue question, Querio answers from live warehouse data inside a reactive notebook, and then an analyst can check the logic, edit it, and save it as a dashboard.
Teams can also schedule prompt-driven investigations that watch metrics like revenue or marketing efficiency and send root-cause findings to Slack or email. In healthcare and finance, that full audit trail matters a lot. Every answer includes inspectable SQL and Python, so if a number looks wrong, the logic is right there to review and fix.
That setup works because metric context stays versioned, shared, and editable.
Why Querio works well for warehouse-native teams running dbt
Querio’s context layer is especially useful for teams already using dbt.
Definitions for metrics like MRR, churn, or active users live as version-controlled SQL, Markdown, and Python files synced to GitHub. So when someone asks about “MRR” in Slack or opens a notebook, they’re working from the same definition. The agent can suggest context updates, but only logged-in users can approve and commit those changes.
For small teams already on dbt, implementation is lighter.
FAQs
::: faq
Which tool is best if our KPI definitions must match across teams?
Querio is the best fit when KPI definitions need to stay the same across teams. It uses a versioned, governed context layer where data teams define joins, metric formulas, and business terms once. From there, Querio applies those definitions across the AI interface and dashboards, which helps cut down on metric drift.
Tableau Pulse also centralizes KPIs through a Metrics Layer. But Querio leans harder into a governed semantic/context layer that connects to inspectable SQL/Python on your live warehouse. :::
::: faq
How much setup work should we expect before getting useful answers?
With Querio, teams can usually get useful answers in about 15 minutes thanks to automated schema discovery and live warehouse connections.
The platform also uses a centralized context layer. So you define core business logic, metrics, and table relationships once, then reuse them across the team.
That setup is often much lighter than the upfront modeling, permissions, and integration work many enterprise BI tools ask for. :::
::: faq
What should we prioritize: KPI summaries, search, or inspectable SQL?
For teams scaling self-serve analytics, inspectable SQL should come first over simple search or high-level KPI summaries. KPI summaries help with executive monitoring, and search helps people get fast answers. But inspectable SQL is what makes people trust the numbers.
It also helps to look for a governed semantic layer and workflow depth. Those two pieces keep metrics consistent and let teams move from a question to root-cause analysis without breaking their flow. :::